This report examines the ways in which zoning laws affect housing and schooling opportunities in the Buffalo region. It begins with an examination of two communities—the Martin Luther King Park neighborhood in Buffalo and the suburban Village of East Aurora. Earlier reports in this series have made similar comparisons of neighborhoods in Queens, Long Island, and Westchester County.1 In addition to the two Buffalo communities where discriminatory zoning has caused extreme segregation, this report also introduces a third Buffalo-area neighborhood—the community of Elmwood–Bidwell—where the city’s zoning policies allowed a mix of uses, building types, and densities that may point in the direction of a better future.
Buffalo, New York, is the state’s second-largest city, and is known for its citizens’ determination in the face of brutal winters, its grand industrial past, its spirited football fans, and its spicy chicken wings.2 But in recent years, it has become known for a couple of other things—one a point of enormous pride, the other a point of great sadness and tragedy.
In November of 2022, a daughter of the Buffalo area, Kathy Hochul, became the first woman ever elected governor in New York State.3 Hochul’s father worked for a time for the region’s Bethlehem Steel plant while pursuing his education, and the family lived “in the shadow of” the plant.4 Although Hochul’s father would later go on to become president of a small technology business, for a time, she recounts, the family lived in a trailer.5 Today, as governor, she says that she knows first-hand how families struggle finding affordable housing, and she has made efforts to build more homes and to make housing less expensive a major priority of her administration.
A few months prior to Hochul’s election, Buffalo drew national attention for a very different reason. On May 14, 2022, a young self-proclaimed white supremacist walked into a Topps grocery store in Buffalo and murdered ten Black people who were simply shopping on a Saturday afternoon. One, Andre Mackneil, was at Topps to buy his three-year-old son a birthday cake.6
The primary pathology involved was the racism of the shooter. But local commentators also recognized that residential segregation contributed in its own way to the tragedy. “This white supremacist knew only one supermarket serviced the east side’s 68,000 Black residents,” said Henry Louis Taylor, Jr., a professor at the University at Buffalo. “Ironically, white racism fueled the shooter’s racial hatred and white racism also created the marginalized, underdeveloped neighborhood conditions that drew him to the city.”7 Black people constitute 37 percent of Buffalo’s population, and 85 percent of them live east of Main Street.8 According to a 2018 report from the Partnership for Public Good, the Buffalo–Niagara metropolitan area is the sixth most segregated in the nation for Black and white people.9
The region’s schools are also highly segregated. According to recent Century Foundation research, Buffalo–Cheektowaga is the twenty-seventh most segregated metro area for Black–white school segregation out of 403 metro areas. It is also the twenty-fourth most segregated for white versus nonwhite students. Most of the white-nonwhite segregation—81 percent—is due to segregation between school districts. The region is also the forty-second most segregated by school income, as measured by eligibility for free or reduced price lunch. The average Black student in a public school attends a school in which 75 percent of students are low-income, whereas the average white student is in a school in which just 37 percent of students are low-income.10
How did the Buffalo region and its schools become so segregated? How does that impact opportunity—including schooling opportunities—for thousands of people who live in the Buffalo area? And what is a daughter of Buffalo, who now sits in the governor’s mansion, trying to do about it?
This report proceeds in four parts. The first part examines how Martin Luther King Park and East Aurora differ in their demographic makeups, home prices, and in the educational opportunities that their public school systems provide. The second part examines how they became so different. That section of the report takes a close look at the history of racial engineering (including redlining) in the Buffalo region in the twentieth century and the very different zoning regimes that exist to this day. The third part discusses the Elmwood–Bidwell community near Buffalo State University as an example of how zoning policies can play a part in creating greater racial and economic integration that avoids the extremes of Martin Luther King Park or East Aurora. That section also examines a limitation when it comes to schooling: Elmwood–Bidwell neighborhood schools don’t reflect the rich diversity of the neighborhood. The fourth part discusses how reform of exclusionary zoning at the state level and school reform at the local level could positively impact the Buffalo region and create a better future.
Comparing Two Buffalo-Area Communities: Martin Luther King Park and East Aurora
The Buffalo–Cheektowaga–Niagara Falls metropolitan area was home to 1.16 million residents in 2022.11 The population was 75 percent white, 11 percent Black, 6 percent Hispanic, 4 percent Asian, and 4 percent multiracial. The median household income was $62,794.12 The City of Buffalo itself had a population of 276,486 in 2022, and was more racially diverse and poorer. The population was 44.7 percent white, 33.3 percent Black, 12.2 percent Hispanic, 6.7 percent Asian, and 5.9 percent multiracial in 2022. The median income was $42,186.13
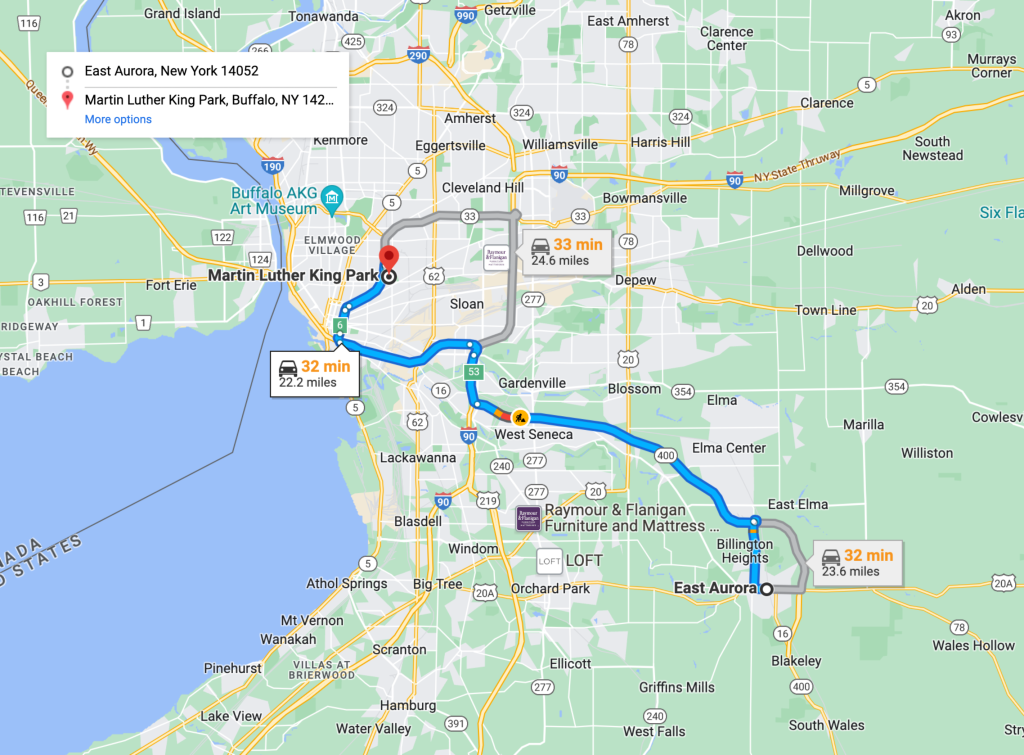
To examine the connection between zoning, residential segregation, and educational opportunities, The Century Foundation worked with Vicki Been, a former deputy mayor for housing and economic development in New York City and now a faculty director of the Furman Center at New York University, and Been’s Furman colleagues Hayley Raetz, Jiaqi Dong, and Matthew Murphy, to identify Buffalo-area communities that are located within easy driving distance (a little more than twenty miles apart) but that have different zoning regimes: East Aurora and Martin Luther King Park. (See Figure 1). The respective zoning regimes in the two communities are associated with very different racial and economic demographics, and starkly different performance levels in their respective public schools.
Figure 1: Martin Luther King Park and East Aurora are Twenty-One Miles Apart
East Aurora, a village of 5,998 residents, had a population that was 94.9 percent non-Hispanic white, 1.9 percent Hispanic, 0.7 percent Black, and 0.5 percent Asian in 2021. Some 53.5 percent of residents had a bachelor’s degree or more. The median household income was $88,286.14 East Aurora is the international headquarters of Fisher-Price toys and was home to President Millard Fillmore.15
The community of Martin Luther King Park, within the city of Buffalo, is much poorer and more racially diverse. In 2021 it had 4,685 residents, of whom 70.4 percent were Black, 12.5 percent Hispanic, 12.2 percent Asian, and 1.5 percent non-Hispanic white. Just 17.4 percent of adults had a bachelor’s degree or more. The median household income in Martin Luther King Park was $24,643, less than one-third of the income in East Aurora. (See Table 1 and Appendix 1.) The area was named to honor Dr. King in 1977, in part to mark his visit to the community in 1967 after rioting in Buffalo’s East Side.16 Martin Luther King Park is located in Buffalo’s East Side, about a mile from the site of the tragic shooting at the Topps grocery store on Jefferson Avenue.
Table 1
| EAST AURORA AND MARTIN LUTHER KING PARK DEMOGRAPHICS, 2021 | ||
| East Aurora | Martin Luther King Park | |
| Median household income | $88,286 | $24,643 |
| Percentage of adults with a bachelor’s degree or higher | 53.5% | 17.4% |
| White (non-Hispanic) | 94.9% | 1.5% |
| Black | 0.7% | 70.4% |
| Hispanic | 1.9% | 12.5% |
| Asian | 0.5% | 12.2% |
| Source: NYU Furman Center. For more details, see Appendix 1. | ||
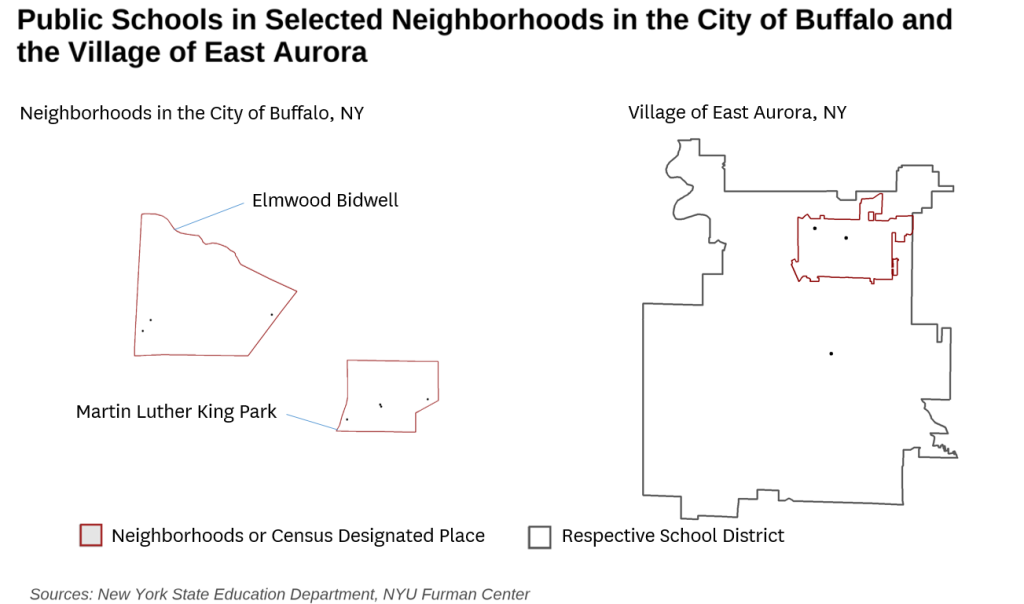
The local public school student populations in East Aurora and Martin Luther King Park reflect the different demographics of the two communities. The public school students in the Village of East Aurora attend the East Aurora Union Free School District, which has one elementary school, one middle school, and one high school.17 Public school students who reside in the Martin Luther King Park area of Buffalo have four local schools to choose from but also may apply to attend any of Buffalo’s public schools. (See Figure 2, prepared by the Furman Center.) Figure 2 also provides information about the location of schools in the Elmwood–Bidwell neighborhood of Buffalo, which will be discussed further below.
Figure 2
In East Aurora, just 12.3 percent of students were reported as eligible for free or reduced price lunch in 2021 at the elementary school level (meaning the students come from families at or below 185 percent of the poverty line). In the Martin Luther King Park neighborhood, by contrast, 88.2 percent of public school students were eligible for subsidized lunch. (See Table 2.)
Researchers have consistently found that in order to provide genuine equal opportunity, schools with higher concentrations of poverty such as those in Martin Luther King Park should spend substantially more money per pupil. Martin Luther King Park area public school expenditures in 2020 were $14,629 per pupil, or $2,854 more than the $11,775 spent in East Aurora, which amounts to a 24 percent premium. Researchers estimate that, to equalize opportunity, high-poverty schools such as those found in Martin Luther King Park should be spending some 78 percent more.18
Recent Century Foundation research found that on the whole, New York State public schools are better funded than schools in many other states. The research also found that there were relatively few funding gaps across the state—meaning low-income students were receiving the extra resources they deserve. But the Buffalo area was an exception.
East Aurora Union Free School District has no gap identified—they were already spending at least as much as the model calculated would be needed to achieve at least average outcomes for students, based on student and district characteristics
Buffalo City School District, however, had a funding gap of $3,841 per pupil—meaning that they would need to spend at least that much more in order to meet the model’s baseline for funding required to reach at least average outcomes. This adds up to a total of $143 million per year of additional funding needed—the largest total funding gap of any school district in New York.19
Teacher experience can improve academic achievement for children, yet in Martin Luther King Park, 20.6 percent of teachers were in their first or second year of teaching in 2017, compared with 13.3 percent of teachers in their first or second year in East Aurora. At East Aurora High School, seventeen Advanced Placement (AP) courses are offered, compared with fewer than three AP classes at East Community High School in the Martin Luther King Park area.
Table 2
| EAST AURORA AND MARTIN LUTHER KING PARK: SCHOOL FACTORS AND OUTCOMES | ||
| East Aurora | Martin Luther King Park | |
| Percent of students qualifying for free and reduced-price lunch, elementary level, 2021–22 | 12.3% | 88.2% |
| Per-pupil expenditure, 2020 | $11,775 | $14,629 |
| Share of teachers in their first or second year of teaching, 2017 | 13.33% | 20.59% |
| Percentage of students performing at grade level in English, 2019 | 45.0% | 16.1% |
| Percentage of students performing at grade level in Math, 2019 | 54.5% | 13.1% |
| Percentage of high school students who graduated in four years, 2019 | 98.1% | 41.6% |
| Source: NYU Furman Center. For more details, see Appendix 1. | ||
In 2019, 16 percent of Martin Luther King Park students were performing at grade level in English, compared with almost three times that success rate (45 percent of students) in East Aurora. In math, 13 percent of students performed at grade level in Martin Luther King Park, compared with a success rate four times higher (55 percent) among East Aurora students. Most troubling of all, in 2021, Martin Luther King Park students were less than half as likely to graduate from high school in four years (42 percent) as those in East Aurora (98 percent).
How can we explain these gigantic differentials in outcomes? They likely reflect the separate effects of family-level and school-level poverty. To begin with, students in Martin Luther King Park face the challenges of poverty much more often than those in East Aurora. As a result, they are more likely to be hungry or to lack high-quality health care, access to the Internet, or a quiet place to do homework.20 Economic segregation—the concentration of student poverty—also has a well-documented detrimental effect on student achievement.21 Low-income students given a chance to live in lower-poverty neighborhoods and attend their schools have been found to cut the achievement gap with their middle-class peers by half in math and by one third in reading.22
Given the power of economic segregation to negatively impact student achievement, it is important to understand precisely how economic and racial segregation has been perpetrated on the families living in places like Martin Luther King Park. As seen below, deliberate public policy choices are a big part of the explanation.
How Did the Buffalo Region—and Places like Martin Luther King Park and East Aurora—Become Separate and Unequal?
How did Martin Luther King Park and East Aurora—and other communities in the Buffalo region—end up so economically and racially segregated? And how did their schools end up providing such different educational opportunities and, therefore, outcomes?
Many people tend to think that economic and racial disparities in communities such as Martin Luther King Park and East Aurora are in large measure a reflection of personal preferences and the workings of the marketplace in housing: places such as East Aurora have higher-performing public schools, for example, so property values are higher and only people who have more substantial resources can afford to live there. What this explanation misses, however, is the powerful role of government policies in creating segregation by race and class—and vast differences in family and neighborhood resources that result. In Buffalo—as in much of the United States—twentieth-century government policies socially engineered racial segregation, and to this day, local exclusionary government zoning policies continue to shape who can live where. This report studies each in turn.
Blatant Racial Discrimination in the Twentieth Century
The Buffalo region was not always racially segregated. In the early twentieth century, according to a research report by Henry Louis Taylor, Jr. and colleagues of the University at Buffalo Center for Urban Studies, the Black population in Buffalo was small and “low-wage Black and White immigrant workers shared residential space on the industrial waterfront.” Indeed, they write, “sometimes Blacks and White ethnics even lived in the same dwelling unit.”23
But over time, Black migration to Buffalo increased. Between 1940 and 1990, the Black population rose from 18,000 to 101,000 and the Black share of the total Buffalo population increased from 3 percent to 31 percent. During the same time period, Buffalo’s white population shrunk from 558,000 to 212,000. White people moved from Buffalo’s East Side to the suburbs in droves.24
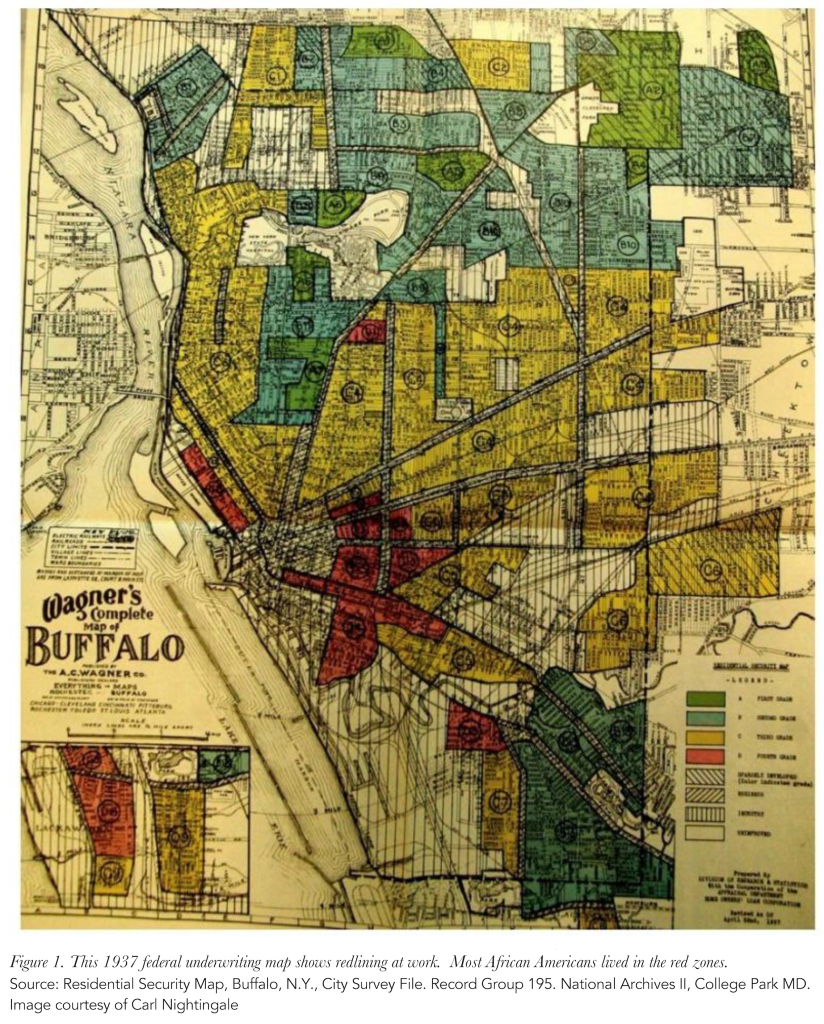
Just like elsewhere, the rising segregation in Buffalo was facilitated and encouraged by a number of federal and local government policies.25 Among the most powerful was the practice of “redlining,” under which federal support for homeownership was denied in areas designated as “red zones” because they had large numbers of Black residents. (See Figure 3.) Redlining not only robbed Black people of resources, it hardened lines of segregation because federal authorities were more likely to insure mortgages in communities that instituted barriers to the “infiltration of inharmonious racial or nationality groups.”26 In addition, local housing officials tended to place segregated Black public housing units in Buffalo’s East Side, thereby contributing to “a public perception of the East Side as ‘Buffalo’s black neighborhood,’” one commentator noted.27 Likewise, public investment in highways facilitated suburban sprawl and white flight.28
FIGURE 3: 1937 Holc Map of Buffalo, New York
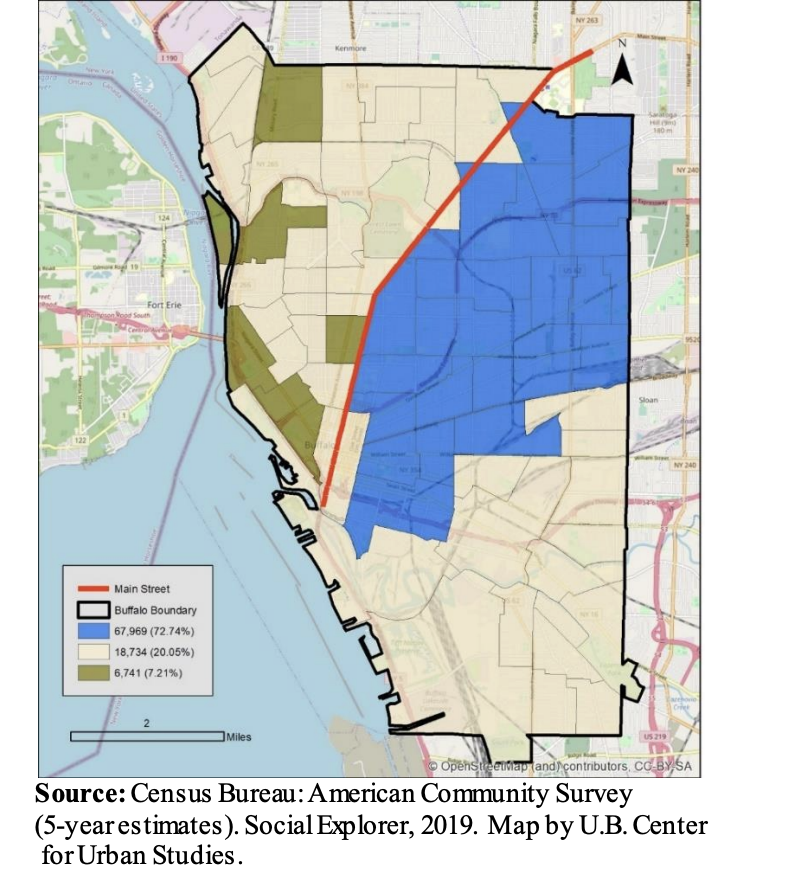
Housing patterns are slow to change, and long after passage of the 1968 Fair Housing Act outlawing racial discrimination, racially discriminatory government policies continue to have a lasting legacy on who lives where in the Buffalo region. As Figure 4 shows, in 2019, Black residents remained highly concentrated in the portion of Buffalo located east of Main Street. (See Figure 4.)
Figure 4: Black East Side and Secondary Settlements
In a 2021 report, The Harder We Run, Taylor and colleagues at the University at Buffalo extensively document the ways in which predominantly Black neighborhoods in Buffalo provide far few opportunities for citizens to thrive, for reasons such as they have less access to healthy food and good medical care. Given that reality, they conclude, “the driving force behind the challenges facing Black Buffalo is racial residential segregation.”29
Today: Income Discrimination through Zoning
Given entrenched patterns of racial and economic segregation in the Buffalo region, Taylor and colleges call for “opening the housing markets in Buffalo City and across Erie County.”30 But that aspiration is stymied by pervasive exclusionary zoning policies, such as those that ban multifamily housing, that are considered perfectly legal and continue to shape economic and racial residential patterns today. Nationally, these policies have a profound effect. As Princeton sociologist Douglas Massey and his colleagues observe: “Density zoning is now the most important mechanism promoting class and racial segregation” in the United States.31
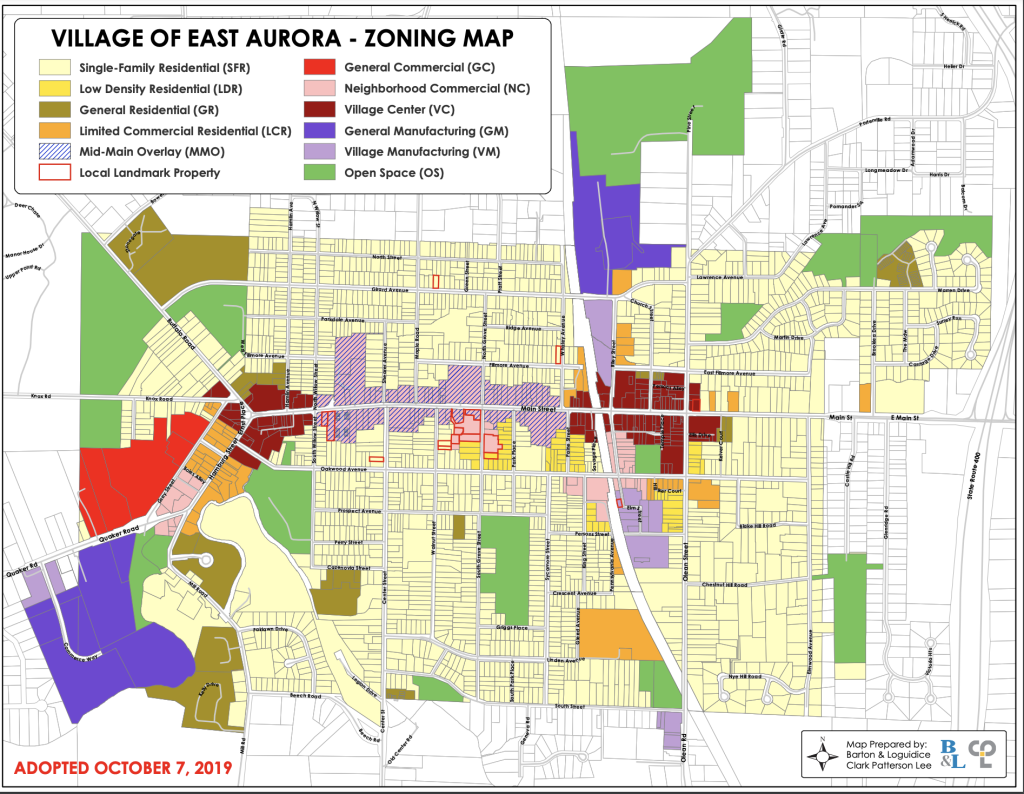
East Aurora and Martin Luther King Park offer a stark contrast in how communities choose to zone, and what sort of housing they allow to be built. In East Aurora, the vast majority of the land is set aside for single-family residential living (depicted in yellow in Figure 5). As Vicki Been notes in Appendix 2, these single family areas are further limited to “detached homes on lots of at least 10,500 square feet.” In 2021, just 3.5 percent of East Aurora’s lot area was made up of existing structures classified as two- or three-family homes or apartments.
Figure 5: East Aurora Zoning Map
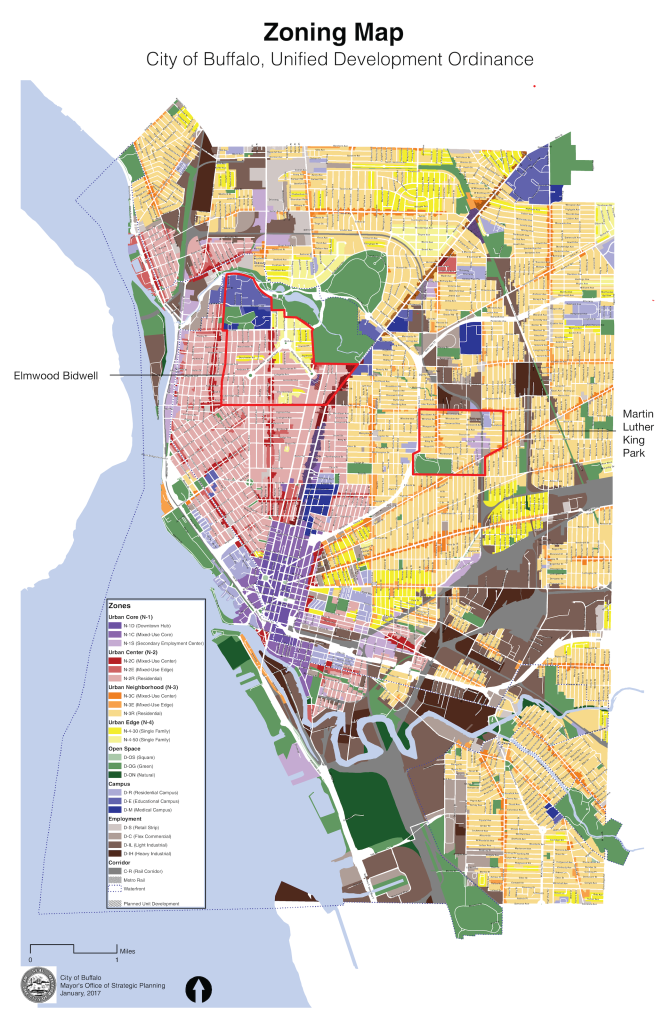
By contrast, the city of Buffalo has taken a much more inclusive approach to zoning on the whole. According to Been, in 2017, Buffalo enacted a widely heralded “greencode” zoning ordinance, which won a national award from the Congress for New Urbanism.32
As Figure 6 indicates, many of the areas of Martin Luther King Park are coded N3-R (light orange), “Urban Neighborhood Residential,” which Been notes “allows detached and attached dwellings as well as three story multifamily apartment buildings.” Likewise, Elmwood–Bidwell, which will be discussed later in this report, is mostly coded N-2R (light pink), “Urban Center Residential,” which allows for “housing types from single family detached and attached homes to three story apartment building and Shopfront homes.’” (See Appendix 2).
Figure 6: Buffalo Zoning Map (Including Martin Luther King Park)
Buffalo drew accolades, for example, for eliminating onerous off-street parking requirements that can unnecessarily drive up the price of housing or even prevent its construction outright. Cornell University researcher Sara Bronin found that some zoning codes in wealthy Connecticut communities, for example, “would require three units of parking for one studio apartment,” an absurd condition that was employed to make new development economically infeasible.33 After Buffalo and some other jurisdictions—such as Harford and St. Paul—eliminated off-street parking requirements entirely, researchers found that developers, weighing consumer demand, decreased the amount of parking built below what had previously been required by law. To some economists, this suggested that the government requirements had been artificially high—if not enough parking were being built, consumers wouldn’t have purchased the properties.34
Within the City of Buffalo, Martin Luther King Park’s zoning rules are particularly inclusive. As Been points out in Appendix 2, much of the neighborhood “allows detached and attached dwellings as well as three story multifamily apartment buildings.” In 2021, nearly one-quarter (22.9 percent) of lot area was classified as two- or three-family lots or apartments —more than six times the share found in East Aurora.
Recent housing growth in East Aurora and Martin Luther King Park vividly illustrate their starkly different zoning regimes. In East Aurora, 100 percent of units (17 out of 17 units) authorized to be built between 2014 and 2021 were for single-family housing units. In Martin Luther King Park, by contrast, only 2 percent of new units (1 out of 51 units) were for single-family homes. (See Table 3 and Appendix 1.) Although real estate developers typically can make higher profits building multifamily housing than single-family homes because they can divide the cost of a parcel of land between more than one home, East Aurora authorized none.35
Table 3
| EAST AURORA AND MARTIN LUTHER KING PARK HOUSING POLICIES AND OUTCOMES | ||
| East Aurora | Martin Luther King Park | |
| Share of lot area, existing structures classified as two- or three-family residences or apartments, 2021 | 3.5% | 22.9% |
| Share of new units authorized that are single-family housing, 2014 to 2021 | 100% (17 or 17) | 2% (1 of 51) |
| Median single-family housing price, 2020 | $320,000 | $65,000 |
| Share of occupied housing, occupied by renters, 2021 | 26.9% | 57.0% |
| Population density per square mile, 2020 | 2,390 | 6,820 |
| Growth of population, 2010 to 2020 | -3.8% | 24.3% |
| Source: NYU Furman Center. For more details, see Appendix 1. | ||
In East Aurora, with its restrictive zoning, the population did not grow at all from 2010 to 2020; indeed, it shrunk by 3.8 percent. In Martin Luther King Park, by contrast, the ten-year period between 2010 and 2020 saw a high level of growth, as the population increased by roughly one quarter.
In 2020, the median single-family housing price in East Aurora was $320,000, or almost five times the $65,000 median price of a home in Martin Luther King Park. Renters are about twice as likely to be found in Martin Luther King Park (57 percent) as in East Aurora (27 percent. Overall, the density of people per square mile is almost three times as high in Martin Luther King Park (6,820 people) as East Aurora (2,390 people), despite the fact that Martin Luther King Park has, according to Been, “many vacant properties.”36
The relatively higher prices of homes in East Aurora may help explain why residents skew older than in Martin Luther King Park. In East Aurora, 26.1 percent of residents are age 65 or older, compared with 16.2 percent of residents in Martin Luther King Park. Young families with children who are just starting out in life may be much less likely to be able to afford the higher home prices in East Aurora.37
Elmwood–Bidwell: An Inclusive Approach to Zoning with Very Positive Outcomes
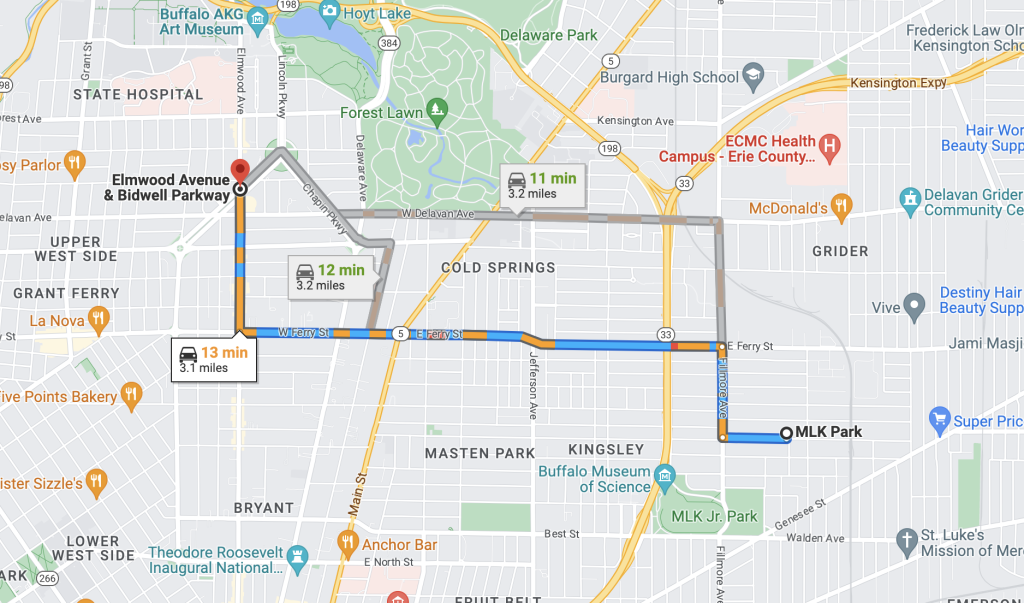
Is there a way to avoid the stark segregation between places such as East Aurora (which is virtually all white and relatively well off) and Martin Luther King Park (which is virtually all Black, Hispanic, and Asian and has high concentrations of poverty)? The Buffalo City community of Elmwood–Bidwell offers an alternative—an economically and racially mixed area, just three miles from Martin Luther King Park. (See Figure 7.)
FIGURE 7: MARTIN LUTHER KING PARK AND ELMWOOD-BIDWELL ARE THREE MILES APART
Success with Residential Integration
Elmwood–Bidwell’s population of 16,513 people is 68.2 percent white, 15.6 percent Black, 9.4 percent Hispanic, and 3.2 percent Asian. Its median family income was $66,882 in 2021, falling between East Aurora ($88,286) and Martin Luther King Park ($24,683). (See Appendix 1.)
Unlike East Aurora, Elmwood–Bidwell is much more open to multifamily housing. As Been notes in Appendix 2, the area allows “housing types from single family detached and attached homes to three story apartment buildings and ‘shopfront homes.’” Given this less-restrictive zoning, Been says, the neighborhood has a variety of home types, including “single family homes on small lots on tree-lined streets, many small two-, three-, and four-apartment buildings” as well as “some larger six- to ten-story apartment buildings.”
And yet—contrary to the fear of some not in my back yard (NIMBY) forces—the availability of multifamily housing has not led to the level of concentrated poverty found in communities like Martin Luther King Park. The Elmwood–Bidwell community is home to Buffalo State University, which is part of the State University of New York (SUNY) system, and offers numerous cultural amenities, such as the Buffalo History Museum, the Buffalo Zoo, and the Buffalo AKGH Art Museum. As Been points out, the surrounding Elmwood Village has been named by the American Planning Association as one of the “Top 10 Great Places to Live in America.”38
Likewise, NIMBY fears to the contrary, the presence of multifamily homes is consistent with strong property values for single family homes. The share of lot area with two- to three-family structures or apartment buildings in Elmwood–Bidwell was higher (35.2 percent) in 2021 than in Martin Luther King Park (22.9 percent) or East Aurora (3.5 percent), and yet the median price of single family homes in that year ($436,750) exceeded those in both East Aurora ($320,000) and Martin Luther King Part ($65,000). Location, walkability, and accessibility to amenities trumped exclusion as a driver of single family home values.
More Work Needed to Integrate Schools
The Elmwood–Bidwell story does have one major flaw, however: the higher levels of racial, ethnic, and socioeconomic diversity found among Elmwood–Bidwell residents has not translated into racial and socioeconomic diversity in the local public schools. Although Elmwood–Bidwell residents were 68.2 percent white, for instance, just 13.2 percent of students in the local elementary schools were white, and just 8.6 percent of those in the local secondary schools were white. Likewise, although Elmwood–Bidwell’s median household income was $66,882, almost three times the median household income in Martin Luther King Park ($24,643), the share of students in the local elementary schools eligible for subsidized meals in Elmwood–Bidwell was 86.6 percent, nearly identical to the proportion in Martin Luther King Park (88.2 percent). (See Appendix 1.)
One explanation for this difference is that many students in Elmwood–Bidwell attend private school. The Furman Center’s analysis of Census data indicates that about half of students in the Elmwood–Bidwell neighborhood attend private school—a very high rate in a country where only 9 percent of K–12 students attended private school in 2019.39
In addition, Buffalo has a system of “open choice.” Families can enter a lottery to send their children to any school in the district. As the school system website explains:
Buffalo Public Schools is a district of “Choice” with 42 elementary schools that offer families a wide variety of educational programs designed to meet the academic interest and needs of students. The Schools of Choice process maximizes choices for parents and their children by enabling them to choose from any school in the District. Families have the option to apply to a school down the street from their home or anywhere in the city that they are eligible for and where seats are available.40
It is possible, therefore, that some middle-class and white Elmwood–Bidwell children are attending Buffalo public schools but not those schools located within the Elmwood–Bidwell community. (Data were not available to indicate precisely where Elmwood–Bidwell children attend school within the Buffalo public school system.) While the public schools located within the Elmwood–Bidwell neighborhood have a 13.2 percent white representation at the elementary level, and an 8.6 percent representation at the secondary level, citywide, the white representation in Buffalo public schools is somewhat higher (19 percent.). And while 87 percent of elementary students and 92 percent of secondary students in the Elwood-Bidwell neighborhood are eligible for free or reduced price lunch, the citywide public school figure is somewhat lower, at 71 percent.41 (One exception—discussed below—is an intentionally diverse charter school, the Elmwood Village Charter School, which has a vibrant racial and socioeconomic mix of students.)
School segregation is an issue that Buffalo has struggled with for years. For decades, the Buffalo schools were highly segregated, and in 1976, a federal district court concluded in the case of Arthur v. Nyquist that school officials “intentionally created and maintained, in substantial part, the segregation in the [Buffalo Public Schools System] BPSS.”42
Buffalo’s school desegregation plan required that each school be made up of between 30 percent and 65 percent nonwhite students. Much of the integration was accomplished through the creation of magnet schools to voluntarily create integrated settings, and the plan was recognized as “a national model for school integration.”43 But in 1987, the court order was lifted, and schools re-segregated. By 2014, 70 percent of the schools had either more than 80 percent minority or more than 80 percent white enrollment.44
The magnet schools dropped their integration goals and some of them became “highly selective exam schools” that had a “virtual absence of black and Latino students,” according to University of California at Los Angeles researcher Gary Orfield.45 In 2018, Orfield and his colleague Jennifer Ayscue co-edited a book, Discrimination in Elite Public Schools: Investigating Buffalo, which concluded that Buffalo’s magnet school and choice system was perpetuating inequality. “Without intentional efforts, choice systems are likely to exacerbate problems of inequality and segregation,” they found.
What Is to Be Done to Chart a Better Future?
The findings in East Aurora, Martin Luther King Park, and Elmwood–Bidwell suggest that if policymakers want to open up housing and educational opportunities, they need to take a two-pronged approach: address discriminatory housing barriers, and then implement smart school plans (described further below) that help attract an economically and racially student population by offering powerful incentives for middle-class families whose children are not currently using the public schools to do so.
Reforms to housing policy will address exclusionary zoning rules in places like East Aurora; and schooling policies help complement housing policies to promote diversity by finding ways for places like Elmwood–Bidwell to have integrated schools. Most important, these housing and schooling policies should be designed to increase opportunities for families and children in places like Martin Luther King Park who may want to exercise the choice to experience something different but are now consciously excluded.
Housing Reforms
In the housing arena, two state-level reforms can help reduce exclusion: a version of Governor Hochul’s New York Housing Compact, which would place pressure on restrictive communities to build more housing; and what I have called a state-level “Economic Fair Housing Act” to make it illegal for exclusionary communities to use zoning laws to unfairly discriminate against people of modest means.
While zoning is usually thought of as a local issue, states are vested with the legal authority to set zoning rules, which they have in turn often delegated to localities such as East Aurora. That delegation of authority is appropriate and proper under most circumstances because local authorities are most attuned to the individual needs of municipalities. But when local lawmakers abuse that authority to exclude people and artificially inhibit the ability of home builders to meet the market demand for housing, it is entirely appropriate for state policymakers to reassert their authority to promote the public interest.
Abuse of power by local authorities has led state authorities in many states—blue and red—to enact rules to make communities less exclusive. In recent years, policymakers have enacted reforms to curb exclusionary zoning in Arkansas, California, Oregon, Maine, Montana, Utah, Vermont, and Washington.46 Although exclusive communities often exercise disproportionate power in the legislature, unsustainable housing price increases have created the political support to enact zoning reform. In 2022, California Governor Gavin Newsom openly declared, “NIMBYism is destroying the state.”47 (Century Foundation reports to be published later this year will highlight the political coalitions that made change possible in these types of states.)
Hochul’s New York Housing Compact
In January 2023, Governor Kathy Hochul proposed the New York Housing Compact to build 800,000 new homes over the next decade. Under the Compact, downstate municipalities would have been given the goal of increasing their housing supply by 3 percent every three years. Upstate communities—like East Aurora—would have been asked to seek to increase housing supply by 1 percent every three years. The differing goals made sense because the demand for housing is stronger downstate, and the corresponding need to expand supply is greater. Upstate, in an exclusive Buffalo suburb like East Aurora, for example, the median single family home price in 2020 was $320,000. In an exclusive New York City suburb, such as Scarsdale, the median single family home price in 2020 was $1,648,925.48
Under the Hochul proposal, if communities failed to reach their goals, the state would require municipalities to provide applicants for housing permits with a fast-track approval process. In addition, downstate areas would need to rezone for greater housing within a half mile of commuter railway and subway stations.49
Governor Hochul’s housing plan was slated to be “the most consequential” reform in decades, a “potential centerpiece for her first term,” the New York Times reported. But in a “spectacular failure,” a Democratically controlled legislature ended up killing a Democratic governor’s proposal, mostly under pressure from New York City suburban areas.50 One New York Assembly source told New York Focus, “There were a lot of members who thought they’d get killed in re-election if they were overriding local control.” The source said: “All the suburban members were very thankful that the mandates are out.”51
Governor Hochul responded in July 2023 with some constructive executive actions, including a program that will give cities and towns who apply for $650 million in competitive state grants an advantage if they take steps to permit more housing.52
But housing prices remain unaffordable for millions of New Yorkers, so Hochul’s modest stopgap measures are unlikely to relieve the political pressure to do more. Notably, in other states, reform has taken a number of legislative cycles to prevail. In 2018, 2019 and 2020, the State of California sought to enact reform and failed each time, but in September 2021, it successfully eliminated exclusive single-family zoning statewide.53 The New York legislature should revisit the issue, considering some version of the New York Housing Compact in the next legislative session.
A New York State Economic Fair Housing Act
New York State could also adopt a state-level Economic Fair Housing Act to create a new cause of action to allow plaintiffs harmed by exclusionary zoning to challenge government policies that discriminate by income without sufficient justification.
Federal legislators have called for a federal Economic Fair Housing Act, under which communities that discriminate by income through their zoning laws would, if challenged, have to provide a powerful justification that such laws are “necessary.” If they failed to do so, federal judges could impose injunctive relief to eliminate the economic discrimination. East Aurora’s ban on multifamily housing in much of its community, for example, could come under close judicial scrutiny under the law. A federal judge would then rule on whether or not such a policy is unjustified income discrimination and possibly order a relaxation of that regulation.54
New York State could take the lead in creating the nation’s first state-level Economic Fair Housing Act. In the realm of civil rights laws, state governments have often enacted their own anti-discriminatory laws in advance of federal action. For example, several states—including New York—have enacted protections against “source-of-income” discrimination (typically, to shield Section 8 Housing Choice Voucher recipients from discrimination by landlords who refused to take vouchers.)55 A New York State Economic Fair Housing Act could make clear that just as source-of-income discrimination is wrong, so is income discrimination by government zoning laws.
Residents in places such as East Aurora may well object, saying they like the system the way it is as their neighborhoods are quiet and our schools are high performing. But research finds that there is no negative effect of socioeconomic integration. Moreover, something important is missing from East Aurora schools: the greater racial integration that dropping economic barriers would bring. For instance, East Aurora kids lose out when they attend schools that are virtually all white. That is not the world in which most Americans live anymore. And homogeneity in a school environment can stunt academic growth and creativity. Research from Columbia University’s Amy Stuart Wells and colleagues finds that “students’ exposure to other students who are different from themselves and the novel ideas and challenges that such exposure brings leads to improved cognitive skills, including critical thinking and problem solving.”56 Researchers have found that more diverse schools enhance student engagement, civil participation, and a sense of belonging.57 Kids can be happier as well. Some parents are beginning to recognize this. Some privileged “happiness-oriented parents” want to affirmatively seek diverse and welcoming settings for their children, where classmates see the big picture and don’t care exclusively about being number one.58
School Reforms
In addition to housing reforms such as the New York State Housing Compact and a New York State Economic Fair Housing Act, this case study of the Buffalo region underlines the importance of supplementing housing reform with educational reform. Housing policy is school policy, because it helps decide who gets to live where in America, and where students of different backgrounds get to attend school. But the Elmwood–Bidwell case—where good zoning policy creates racial and economic housing integration—is a reminder that school integration does not follow housing integration automatically.
Buffalo Public Schools, which once used public school choice and a system of magnet schools to become a leader on school integration, now has highly segregated schools because its “open choice” system does not include civil rights guardrails to ensure that choice leads to integration rather than segregation.
One exception is the Elmwood Village Charter School, which draws a rich diversity of students. It is intentionally diverse, meaning it has policies that consciously seek to bring students of different backgrounds together.59 It provides a preference to Buffalo city residents and the student population is 45 percent white, 25 percent Black, 18 percent Hispanic, and 10 percent two or more races. About half of the students (53 percent) are low-income.60
Nationally, 171 school districts and charter schools have voluntarily adopted plans to ensure that schools promote socioeconomic (and thereby, often racial) integration.61 Many of these school systems use choice as a way to promote integration by including a set of fairness guidelines to advance diversity.
One of the pioneers of this approach has been Cambridge, Massachusetts. Whereas in Buffalo, a smaller number of magnet schools are considered especially desirable, Cambridge has taken steps to try to make every school attractive in its own way by employing a variety of teaching approaches and themes, such as Montessori. Parents rank their choices and then the school district honors those choices with an eye to ensuring that all schools have a healthy socioeconomic mix of students. Middle-class families who had been using private and parochial schools were attracted back to public education because of the new offerings provided. This socioeconomic integration program has resulted in high levels of racial integration, and student outcomes are strong.62
Although Cambridge is smaller in terms of student population and geographic scope than Buffalo, the Cambridge model of managing choice to promote integration has been employed in many larger school districts across the country, such as Charlotte–Mecklenburg, North Carolina and New York City Community School District 15.63
Conclusion
Like many American metropolitan areas, the Buffalo region continues to struggle with residential and school segregation by race and class. For a brief period in the 1970s and 1980s, Buffalo public schools became a national model for implementing realistic programs to desegregate. But after decades of backsliding, it is time to renew that earlier commitment.
Likewise, this report serves as a reminder that in the housing arena, it is not just very wealthy New York City suburbs like Scarsdale that exclude. The problem reaches across the state to communities such as East Aurora, where only 3.5 percent of the municipality’s lot area contains multifamily housing—and none of the units authorized between 2014 and 2021 were for duplexes, triplexes or any other type of multifamily home.
Buffalo has shown that it can lead the way on integration and opportunity. If it faces the challenge head on, it can do so again.
Appendixes
Notes
- Richard D. Kahlenberg, “How Housing Policies Create Unequal Educational Opportunities: The Case of Queens, New York,” The Century Foundation, April 3, 2023, https://tcf.org/content/report/how-housing-policies-create-unequal-educational-opportunities-the-case-of-queens-new-york/; Richard D. Kahlenberg, “Housing and Educational Inequality: The Case of Long Island,” The Century Foundation, June 1, 2023, https://tcf.org/content/report/housing-and-educational-inequality-the-case-of-long-island/; and Richard D. Kahlenberg, “How Zoning Drives Educational Inequality: The Case of Westchester County,” The Century Foundation, July 17, 2023, https://tcf.org/content/report/how-zoning-drives-educational-inequality-the-case-of-westchester-county/.
- For a description of Buffalo’s changing economic fortunes over time, see Appendix 2.
- Ian Pickus, “Democrat Kathy Hochul wins full term as New York Governor defeating Lee Zeldin,” National Public Radio, November 9, 2022, https://www.npr.org/2022/11/09/1134203429/new-york-governor-election-results-kathy-hochul-lee-zeldin.
- “Kathleen C. Hochul,” U.S. House of Representatives History, Art and Archives, https://history.house.gov/People/Detail/15616.
- Kathy Hochul for Congress, https://web.archive.org/web/20110620013236/http://www.kathyhochul.com/khwordpress/meetkathy/local-history/; and Cindy Adams, “Why Kathy Hochul says her ‘rough and tumble’ childhood prepared her for governing,” New York Post, April 20, 2022, https://nypost.com/2022/04/20/kathy-hochul-says-her-childhood-turned-her-into-a-politician/.
- Joshua Rhett Miller and Steve Vago, “Buffalo shooting victim was picking up son’s birthday cake: family,” New York Post, May 16, 2022. https://nypost.com/2022/05/16/buffalo-shooting-victim-andre-mackneil-was-picking-up-cake-family/.
- Bill Hutchinson, Alysha Webb, and Jade Lawson, “A year after racist shooting rampage, Buffalo struggles to correct decades of segregation and systemic racism,” ABC News, May 8, 2023, https://abcnews.go.com/US/year-after-racist-shooting-rampage-buffalo-struggles-correct/story?id=89466367.
- Thomas O’Neil-White, “Not a thing of the past: How a history of racial residential segregation in Buffalo led to the Tops shooting,” WBFO Radio, May 10, 2023, https://www.wbfo.org/racial-equity/2023-05-10/not-a-thing-of-the-past-how-a-history-of-racial-residential-segregation-in-buffalo-lead-to-the-tops-shooting.
- Anna Blatto, “A City Divided: A Brief History of Segregation in Buffalo,” Partnership for the Public Good, April 2018, 2, https://ppgbuffalo.org/files/documents/data-demographics-history/a_city_divided__a_brief_history_of_segregation_in_the_city_of_buffalo.pdf.
- Halley Potter, “School Segregation in Cities Across America Mapped, The Century Foundation, May 17, 2022, https://tcf.org/content/data/school-segregation-in-cities-across-america-mapped/.
- “Resident Population in Buffalo-Cheektowaga-Niagara Falls, NY,” St. Louis Federal Reserve, https://fred.stlouisfed.org/series/BUFPOP.
- “Buffalo-Cheektowaga NY Metro Area,” Census Reporter, https://censusreporter.org/profiles/31000US15380-buffalo-cheektowaga-ny-metro-area/?ref=kirbykersels.com.
- “Quick Facts: Buffalo City, New York,” U.S. Census Bureau, https://www.census.gov/quickfacts/fact/table/buffalocitynewyork/PST045222.
- See Appendix 1.
- “About the Village,” Village of East Aurora, https://www.east-aurora.ny.us/about/history.
- Bradley Bethel, “The Three Phases of Martin Luther King Park,” Buffalo Rising, January 16, 2020, https://www.buffalorising.com/2020/01/the-three-phases-of-martin-luther-king-park/.
- East Aurora Union Free School District, https://www.eastauroraschools.org/.
- See Sylvia Allegretto, Emma García, and Elaine Weiss, “Public education funding in the U.S. needs an overhaul: How a larger federal role would boost equity and shield children from disinvestment during downturns,” Economic Policy Institute, July 12, 2022, Figure B, https://www.epi.org/publication/public-education-funding-in-the-us-needs-an-overhaul/ (suggesting highest poverty school per pupil spending should be $18,231, or 78 percent higher than lowest poverty school spending of $10,239).
- “Closing America’s Education Funding Gaps,” The Century Foundation, July 22, 2020, https://tcf.org/content/report/closing-americas-education-funding/.
- See, e.g., Richard Rothstein, Class and Schools: Using Social, Economic and Educational Reform to Close the Black-White Achievement Gap (New York: Teachers College Press, 2004).
- See, e.g., The Future of School Integration: Socioeconomic Diversity as an Education Reform Strategy, ed. Richard D. Kahlenberg (New York: Century Foundation Press, 2012).
- Heather Schwartz, “Housing Policy Is School Policy: Economically Integrative Housing Promotes Academic Success in Montgomery County, Maryland,” The Century Foundation, 2010, https://tcf.org/content/commentary/housing-policy-is-school-policy.
- Henry-Louis Taylor, Jr., Jin-Kyu Jung, and Evan Dash, “The Harder We Run: The State of Black Buffalo in 1990 and the Present,” University at Buffalo Center for Urban Studies, September 2021, 15, https://www.investigativepost.org/wp-content/uploads/2021/10/TaylorHL-The-Harder-We-Run.pdf.
- Taylor et al., “The Harder We Run,” 18–20.
- Between 1950 and 2000, the Black population in Buffalo increased from 3 percent to 39 percent. Blatto, “A City Divided,” 12.
- See Arthur v. Nyquist, 415 F. Supp. 904, at 961(W.D.N.Y. 1976), https://law.justia.com/cases/federal/district-courts/FSupp/415/904/2248864/.
- Blatto, “A City Divided,” 8.
- Blatto, “A City Divided,” 11.
- Taylor et al., “The Harder We Run,” 7; see also ibid., 76 (“Racial Residential Segregation is the linchpin in the system of Black inequality”).
- Taylor et al., “The Harder We Run,” 11.
- Douglas S. Massey, Len Albright, Rebecca Casciano, Elizabeth Derickson, and David N. Kinsey, Climbing Mount Laurel: The Struggle for Affordable Housing and Social Mobility in an American Suburb (Princeton, N.J.: Princeton University Press, 2013), 19.
- See Appendix 2.
- Sara Bronin, “Zoning and Equity: Rappaport Center for Law & Public Policy Webinar Co-Sponsors: Harvard Joint Center for Housing Studies; BC Black Law Students Association,” YouTube video, 1:28:20 at 1:15, BC Law, October 21, 2021, https://www.youtube.com/watch?v=l-CjFtLwmsc.
- Linda Poon, “Buffalo Becomes First City to Bid Minimum Parking Goodbye,” CityLab, Bloomberg, January 9, 2017, https://www.bloomberg.com/news/articles/2017-01-09/buffalo-is-the-first-to-abandon-minimum-parking-requirements-citywide. See also James Brasuell, “How Parking Reform Changed Development in Buffalo: New Research Quantifies the Effect of Parking Reforms Implemented by the City of Buffalo in 2017,” Planetizen, April 8, 2021, https://www.planetizen.com/news/2021/04/112901-how-parking-reform-changed-development-buffalo; Bronin, “Zoning and Equity” video; and Kea Wilson, “How the Twin Cities Abolished Parking Minimums (and How Your City Can, Too),” Streets Blog USA, September 2, 2021, https://usa.streetsblog.org/2021/09/02/how-the-twin-cities-abolished-parking-minimums-and-how-your-city-can-too/.
- See Lisa Prevost, “Town After Town, Residents Are Fighting Affordable Housing in Connecticut,” New York Times, September 4, 2022, https://www.nytimes.com/2022/09/04/realestate/connecticut-affordable-housing-apartments .html.
- See Appendix 2. The share of lot area that had vacant land for residential use in 2021 was 19.1 percent in Martin Luther King Park. In East Aurora, the comparable figure was 5.6 percent. See Appendix 1.
- See Appendix 1.
- See Appendix 2.
- National Center for Education Statistics, “Fast Facts: Public and private school comparison,” https://nces.ed.gov/fastfacts/display.asp?id=55.
- “2023-2024 Elementary Application Process,” Buffalo Public Schools, https://www.buffaloschools.org/o/bps/page/2023-2024-elementary-application-process.
- “Buffalo City School District,” Great Schools, https://www.greatschools.org/new-york/buffalo/buffalo-city-school-district/.
- Arthur v. Nyquist, 415 F. Supp. 904, at 960 (W.D.N.Y. 1976), https://law.justia.com/cases/federal/district-courts/FSupp/415/904/2248864/.
- Marc Byrnes, “Buffalo Was Once a Model for Integration. Now the Vast Majority of Its Public Schools Are Segregated,” Bloomberg CityLab, April 11, 2014, https://www.bloomberg.com/news/articles/2014-04-11/buffalo-was-once-a-model-for-integration-now-the-vast-majority-of-its-public-schools-are-segregated.
- Byrnes, “Buffalo Was Once a Model.”
- See Gary Orfield, “Great Schools Perpetuating Inequality,” 3, in Discrimination in Elite Public Schools: Investigating Buffalo, ed. Gary Orfield and Jennifer Ayscue (New York: Teachers College Press, 2018), https://eric.ed.gov/?id=ED581772.
- Richard D. Kahlenberg, Excluded: How Snob Zoning, NIMBYism, and Class Bias Build the Walls We Don’t See (New York: Public Affairs, 2023), 14, 157–81.
- Kahlenberg, Excluded, 179 and 211.
- Kahlenberg, “How Zoning Drives Educational Inequality: The Case of Westchester County,” Table 3.
- Governor Kathy Hochul, “Governor Hochul Announces Statewide Strategy to Address New York’s Housing Crisis and Build 800,000 New Homes,” January 10, 2023, https://www.governor.ny.gov/news/governor-hochul-announces-statewide-strategy-address-new-yorks-housing-crisis-and-build-800000; and Governor Kathy Hochul, “Remarks as Prepared: Governor Hochul Delivers 2023 State of the State,” January 10, 2023, https://www.governor.ny.gov/news/remarks-prepared-governor-hochul-delivers-2023-state-state.
- Luis Ferré-Sadurní and Mihir Zaveri, “New York Officials Failed to Address the Housing Crisis. Now What?” New York Times, April 27, 2023, https://www.nytimes.com/2023/04/27/nyregion/nyc-housing-crisis.html; Grace Ashford, “Gov. Hochul Gets a Budget Deal, but No Signature Win,” New York Times, April 28, 2023, https://www.nytimes.com/2023/04/28/nyregion/hochul-budget-ny.html; and Kahlenberg, “How Zoning Drives Educational Inequality: The Case of Westchester County.”
- Sam Mellins, “The State Assembly Is Foreclosing Hochul’s Housing Supply Plan,” New York Focus, April 18, 2023, https://nysfocus.com/2023/04/18/hochul-housing-compact-dead-assembly-budget.
- Mihir Zaveri and Luis Ferre-Sadurni, “Hochul Orders Stopgap Measures in Face of New York’s Housing Crisis,” New York Times, July 18, 2023, https://www.nytimes.com/2023/07/18/nyregion/housing-crisis-421a-hochul.html.
- Kahlenberg, Excluded, 179.
- See Jerusalem Demsas, “Could a 54-year-old civil rights law be revived? Decades after Martin Luther King Jr.’s fight, American cities still segregate communities by race and class,” Vox, January 17, 2022 (quoting Rep. Emmanuel Cleaver on the need for an Economic Fair Housing Act); Richard D. Kahlenberg, “An Economic Fair Housing Act,” The Century Foundation, August 3, 2017, https://tcf.org/content/report/economic-fair-housing-act/; Kahlenberg, “Excluded,” 191–205; and Equitable Housing Institute, “Economic Fair Housing Act of 2021: Partial Draft Bill and Comments,” November 30, 2020, https://www.equitablehousing.org/images/PDFs/PDFs–2018-/EHI_Economic_FHA_of_2021_draft-rev_11-30-20.pdf.
- See Poverty and Race Research Action Council, “Expanding Choice: Practical Strategies for Building a Successful Housing Mobility Program—Appendix B: State, Local and Federal Laws Barring Source-of-Income Discrimination,” July 2023, http://www.prrac.org/pdf/AppendixB.pdf.
- Amy Stuart Wells, Lauren Fox, and Diana Cordova-Cobo, “How Racially Diverse Schools and Classrooms Can Benefit All Students,” The Century Foundation, February 9, 2016, https://tcf.org/content/report/how-racially-diverse-schools-and-classrooms-can-benefit-all-students/.
- See “New Research: Benefits for white students in integrated schools,” Center for Education and Civil Rights at Penn State University, February 18, 2021, https://sdnotebook.com/2021/02/17/new-research-benefits-for-white-students-in-integrated-schools/ (citing research by Jack Schneider, Rachel White and Ashley Carey in the Journal of Education and Urban Society).
- See “New Research: Happiness-oriented parenting and school integration,” Center for Education and Civil Rights, School Diversity Notebook, March 28, 2023, https://sdnotebook.com/2023/03/28/new-research-happiness-oriented-parenting-school-integration/ (citing Allison Roda, Molly Makris, Judith Kafka and Mira Debs, “Choice and Diversity: An Alternative Perspective on Privileged Parents Choosing Schools).
- See “Elmwood Village Charter School,” https://www.evcsbuffalo.org.
- “Elmwood Village Charter School,” Great Schools, https://www.greatschools.org/new-york/buffalo/8754-Elmwood-Village-Charter-School/.
- Halley Potter and Michelle Burris, “Here Is What School Integration in America Looks Like Today,” The Century Foundation, December 2, 2020, https://tcf.org/content/report/school-integration-america-looks-like-today/.
- Richard D. Kahlenberg, “School Integration in Practice: Lessons from Nine Districts,” The Century Foundation, October 14, 2016, https://tcf.org/content/report/school-integration-practice-lessons-nine-districts/.
- Potter and Burris, “Here is What School Integration in America Looks Like Today.”