America is in the midst of a profound political reckoning. Against the backdrop of an unprecedented public health crisis and steadily rising death toll, a historically deep economic recession, and widespread protests against police brutality and racial injustice, people across the country are awakening and grappling anew with longstanding issues of inequality, opportunity, and justice—and confronting the hard truths of the American experience for people of color.
One of the starkest examples of this inequality, as well as a leading cause of it, is our nation’s highly unequal and highly segregated K–12 public education system. By underinvesting in our public schools, we rob millions of American children—particularly Black, brown, and low-income children—of the opportunity to succeed. Inequality, in effect, begins at birth.
While we have known for decades that the United States is failing in its commitment to provide equal educational opportunity, there is far less consensus and understanding of how to reverse these trends. Now, for the first time ever, The Century Foundation (TCF) has calculated the level of investment needed to lift up every student in the country that is currently falling behind. In other words, in this report we estimate what it would cost to provide each child in America—no matter their background—with the opportunity to succeed in school.
Inequality begins in childhood: The United States is underfunding our public schools by nearly $150 billion annually, robbing millions of children—predominantly minority and low-income children—of the opportunity to succeed.
We can begin to restore the promise of public education by simply investing more in our students and in our schools. A wide-ranging and rigorous body of research makes it clear: spending matters in education. More specifically, greater investments in schools translate to improved student outcomes, and these outcomes are more pronounced and significant for low-income and minority students.
Across a range of metrics, U.S. students score lower than students in other developed nations, and these outcomes vary significantly along racial, ethnic, and socioeconomic lines. At the same time, state- and district-level data show wide variation in educational spending across the country. Some school districts and states spend vastly more per pupil, and pay educators much higher wages, than others. Not surprisingly, variation in education spending largely overlaps with variation in student outcomes. In general, where states invest more in public schools, students tend to achieve higher scores and perform better.
To calculate exactly “how much” more spending is needed, TCF partnered with the nation’s leading school finance expert, Bruce D. Baker, Ed.D., of Rutgers University Graduate School of Education, to develop a first-of-its-kind national cost model study. Our model estimates what it would cost for students to achieve national average outcomes on reading and math assessments by 2021 for every school district in the country, more than 13,000 in total.
For the majority of school districts in the country (7,224 in total, serving almost two-thirds of public school students, or more than 30 million children in total), bringing students up to the nation’s current average outcomes requires greater public investment, enough to fill what we call a “funding gap.” The remaining districts currently provide funding at or above what our model estimates is needed to achieve average outcomes, and thus have no funding gap.1
We have visualized the findings of the model in a nationwide map, available above. The interactive map allows users to identify what, if any, funding gap exists for a particular school district or state. It includes estimates for both aggregate and per-pupil funding gaps in each school district and state, which serve to tell us the following:
- Aggregate funding gaps provide the overall scope of the investment needed in each jurisdiction. In districts and states with larger populations of students, these aggregate gaps will be larger.
- Per-pupil funding gaps, on the other hand, allow comparisons across districts and states, irrespective of population size.
In addition, we include two different estimates for what it would cost to close the gap:
- The first represents the cost to states and districts if they acted swiftly to close the gap within one year.
- The second represents the costs to localities if they scale up and phase in spending over five years to close the gap (the map below).
Our model is designed to add concrete data and evidence to ongoing public debates on education spending and school finance reform, which have acquired a renewed sense of urgency amid the COVID-19 pandemic and nationwide protests against racism and structural inequality. Following the Great Recession, many state and local governments chose to cut education funding, which exacerbated existing inequities. Policymakers today should heed the lessons learned from those cuts and not repeat the mistakes of the past.
Ultimately, education spending is a political matter. Closing funding gaps will require both state and local policymakers, as well as the federal government, to make the commitments necessary to lift up students. This model provides a roadmap to do just that. For the first time, we have developed scientifically rigorous estimates of the investments needed to raise up students that are currently falling behind. Our analysis is both a starting point and a floor.
For the first time, we have developed scientifically rigorous estimates of the investments needed to raise up students that are currently falling behind. Our analysis is both a starting point and a floor.
As the COVID-19 pandemic and its resulting recession force policymakers to make tough budgetary choices about our future, this new data can inform better decision-making on public education funding and ensure that existing education inequalities do not balloon in the wake of the public health and economic crisis. The promise of equal opportunity—and the future of our children—depends on it.
For more information on the project and cost model, see our three background papers:
- The Unequal State of Public Education in the United States
- A Review of Evidence That Increased Educational Spending Leads to Improved Outcomes
- How We Developed the National Education Cost Model
For an explanation of our methodology, see here. To access the full dataset for all 13,000+ school districts, see here.
Key Findings
Our cost model and interactive map identify every district in the country with a funding gap—that is, where current spending is below the amount that our model estimates is necessary to achieve average outcomes, based on that district’s unique geography and student demographics. The result is that broad swaths of the country, including much of the south, southwest, and west United States, show sizable funding gaps.
Similarly, many of the nation’s large cities, which have more diverse school districts, have significantly larger funding gaps. As the COVID-19 pandemic constrains state and local budgets further, additional cuts to public education spending may exacerbate these gaps.
District-Level Findings
Districts with high concentrations of students living in poverty are more likely to have funding gaps, and these students experience significantly larger funding gaps, than wealthier districts.
- Low-income school districts are more than twice as likely to have a funding gap as higher income districts.
- Districts with the highest concentrations of poverty—those in the highest 20 percent of districts by Census poverty rate—are 2.6 times more likely to have a funding gap.
- The average gap in these districts is more than $6,700 per pupil.
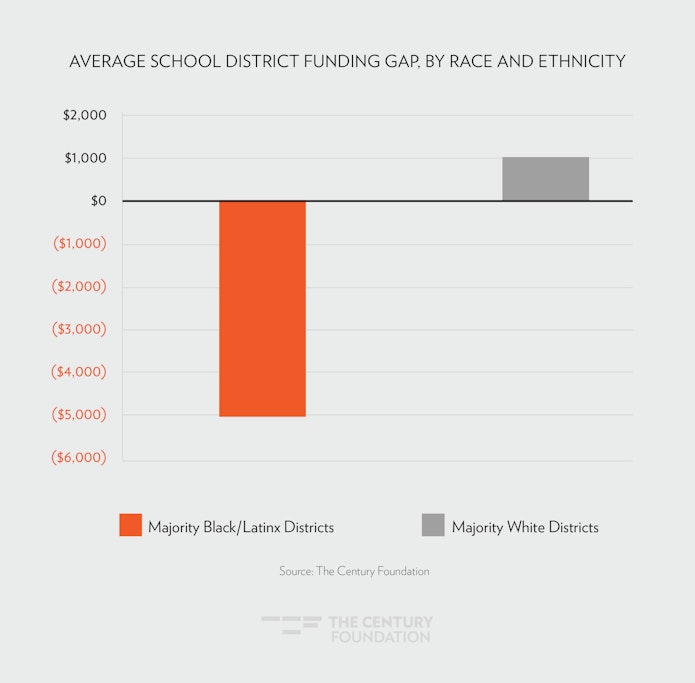
Districts with high concentrations of Latinx and Black students have much larger funding gaps, and are more likely to have funding gaps to begin with, than majority white districts.
- Districts that have more than 50 percent Black or Latinx enrollment are nearly twice (1.95 times) as likely to have a funding gap than districts with minority enrollment less than 50 percent.
- Nationally, districts with over 50 percent Black and/or Latinx students face a funding gap of more than $5,000 per pupil on average (see Figure 1).
Figure 1
- Black students are disproportionately concentrated in poorly funded, low-performing districts.
- While only 8 percent of children in well-funded, high-performing districts are Black, over 20 percent of children in poorly funded, low-performing districts are Black.
- 86 percent of children attending districts with majority Black student populations have funding gaps.
- Districts with the largest funding gaps have a high concentration of Latinx students. In fact, few districts with very high Latinx shares spend more than enough to achieve national average outcomes.
- While only 13 percent of children in well-funded, high-performing districts are Latinx, nearly 40 percent of children in poorly funded, low-performing districts are Latinx.
- 96 percent of children attending districts with majority Latinx student populations have funding gaps.
- Majority Latinx districts are nearly 2.3 times as likely as minority Latinx districts to have funding gaps. Their average gap is more than $8,000 per pupil.
- Of the ten districts with the largest aggregate funding gaps, six are majority Latinx (see Table 1). All have poverty rates well above the national average.
- Among districts of at least 25,000 students (288 districts overall), the ten districts with the largest funding gaps per pupil are all majority Latinx (see Table 2).
- The three districts with the largest gaps per pupil—La Joya ($18,398), Pharr—San Juan—Alamo ($14,104), and Brownsville ($14,008)—are almost entirely Latinx and are all located in Texas.
table 1
| Ten Districts with Largest Aggregate Funding Gaps | |||||
| District Name | State | Funding Gap (Total) | % in Poverty | % Latinx | % Black |
| Los Angeles Unified | California | $5.77 Billion | 33 | 74 | 8 |
| Clark County School District | Nevada | $2.62 Billion | 25 | 46 | 14 |
| Houston ISD | Texas | $2.61 Billion | 33 | 62 | 24 |
| City of Chicago SD 299 | Illinois | $2.36 Billion | 34 | 47 | 38 |
| Dade | Florida | $2.24 Billion | 25 | 70 | 21 |
| Dallas ISD | Texas | $2.17 Billion | 35 | 70 | 23 |
| Philadelphia City SD | Pennsylvania | $1.40 Billion | 40 | 20 | 51 |
| Fort Worth ISD | Texas | $997 Million | 32 | 62 | 23 |
| Hillsborough | Florida | $983 Million | 20 | 36 | 21 |
| Fresno Unified | California | $966 Million | 44 | 68 | 8 |
| National Averages | 17 | 26 | 14.5 | ||
table 2
| Ten Districts with Largest Per-Pupil Funding Gaps (in Districts of at least 25,000 Students) | |||||
| District Name | State | Funding Gap (Per Pupil) | % in Poverty | % Latinx | % Black |
| La Joya ISD | Texas | $18,398 | 47 | 100 | 0 |
| Pharr-San Juan-Alamo ISD | Texas | $14,104 | 38 | 99 | 0 |
| Brownsville ISD | Texas | $14,008 | 38 | 98 | 0 |
| Dallas ISD | Texas | $13,913 | 35 | 70 | 23 |
| Alief ISD | Texas | $13,518 | 35 | 53 | 29 |
| Phoenix Union High School District | Arizona | $13,391 | 35 | 81 | 8 |
| Fresno Unified | California | $13,224 | 44 | 68 | 8 |
| Compton Unified | California | $13,196 | 37 | 79 | 19 |
| San Bernardino City Unified | California | $13,023 | 42 | 74 | 12 |
| Santa Ana Unified | California | $12,937 | 32 | 93 | 0 |
| National Averages | 17 | 26 | 14.5 | ||
State-Level Findings
State Investment in K–12 Education Is a Policy Choice
- With regards to aggregate funding gaps, three states have gaps greater than $10 billion (California, Texas, and Florida; see Table 3). These states collectively enroll more than 14 million students in the United States.
Table 3
| Aggregate Funding Gaps by State | ||
| State | Total Gap (One-Year) |
Gap as Percentage of Current Spending |
| California | $37.52 Billion | 4.4 |
| Texas | $30.44 Billion | 63.3 |
| Florida | $10.91 Billion | 41.8 |
| Arizona | $6.58 Billion | 89.7 |
| Georgia | $5.20 Billion | 29.2 |
| North Carolina | $4.77 Billion | 36.5 |
| Illinois | $4.02 Billion | 13.8 |
| Nevada | $3.01 Billion | 72.3 |
| Michigan | $2.87 Billion | 20.6 |
| Alabama | $2.77 Billion | 40.0 |
| Indiana | $2.64 Billion | 26.7 |
| Pennsylvania | $2.49 Billion | 10.9 |
| Colorado | $2.45 Billion | 28.0 |
| Oklahoma | $2.41 Billion | 46.4 |
| Ohio | $2.41 Billion | 13.1 |
| Mississippi | $2.17 Billion | 54.9 |
| Washington | $2.09 Billion | 1.5 |
| New Mexico | $1.90 Billion | 60.7 |
| Missouri | $1.64 Billion | 18.5 |
| Arkansas | $1.62 Billion | 36.3 |
| South Carolina | $1.57 Billion | 20.1 |
| Louisiana | $1.46 Billion | 20.4 |
| Oregon | $1.46 Billion | 23.8 |
| Tennessee | $1.45 Billion | 18.9 |
| Massachusetts | $1.33 Billion | 9.4 |
| Kentucky | $1.31 Billion | 19.1 |
| New Jersey | $1.28 Billion | 5.4 |
| Virginia | $1.28 Billion | 8.2 |
| Wisconsin | $1.18 Billion | 11.6 |
| Utah | $1.17 Billion | 28.3 |
| Idaho | $812.51 Million | 37.7 |
| Minnesota | $679.22 Million | 6.8 |
| Kansas | $611.77 Million | 12.1 |
| Connecticut | $555.34 Million | 6.0 |
| Iowa | $544.86 Million | 9.7 |
| Maryland | $450.03 Million | 3.3 |
| New York | $427.54 Million | 0.7 |
| Rhode Island | $297.69 Million | 14.3 |
| West Virginia | $199.03 Million | 6.7 |
| Montana | $189.94 Million | 11.4 |
| Nebraska | $170.79 Million | 4.4 |
| South Dakota | $118.71 Million | 8.6 |
| Vermont | $112.78 Million | 9.3 |
| Maine | $72.22 Million | 4.3 |
| New Hampshire | $47.41 Million | 1.7 |
| Alaska | $40.35 Million | 1.7 |
| North Dakota | $35.62 Million | 2.5 |
| District of Columbia | $31.80 Million | 3.0 |
| Delaware | $26.74 Million | 1.5 |
| Wyoming | $0 | 0.0 |
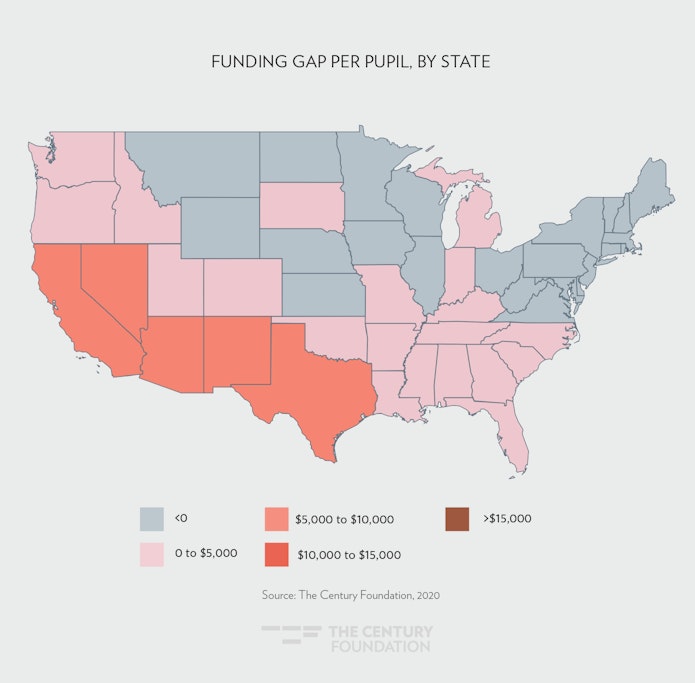
- States with the largest funding gaps per pupil are concentrated in the southwest and southeast United States.
- Arizona has the largest funding gap per pupil ($7,020), followed by Nevada ($6,693) and California ($6,089).
- Many of the states with the largest funding gaps saw significant public education cuts following the Great Recession.
- The four states that implemented the largest statewide cuts to public education following the Great Recession—Oklahoma, New Mexico, Florida, and Arizona— are all among the 10 worst states for funding gaps per pupil (see Table 4).
Table 4
| Ten Largest Funding Gaps Per Pupil, by State | |
| State | Funding Gap Per Pupil |
| Arizona | $7,020 |
| Nevada | $6,693 |
| California | $6,089 |
| New Mexico | $5,924 |
| Texas | $5,740 |
| Mississippi | $4,642 |
| Florida | $3,758 |
| Alabama | $3,489 |
| Oklahoma | $3,389 |
| Arkansas | $3,349 |
Figure 2
-
-
-
- Even high-spending states have districts that are underfunded. For example, New York and Connecticut appear mostly gray on the map because the majority of their districts meet or exceed the funding levels indicated by our model. However, zooming in on the map shows that even in these states, there are districts with large funding gaps.
- Figure 3 shows a close-up view of Connecticut, with Bridgeport, Waterbury, New Britain, Hartford, and Chaplin school districts all showing large funding gaps . These districts also have relatively higher rates of Black/Latinx enrollment and higher poverty rates than other districts in the state.
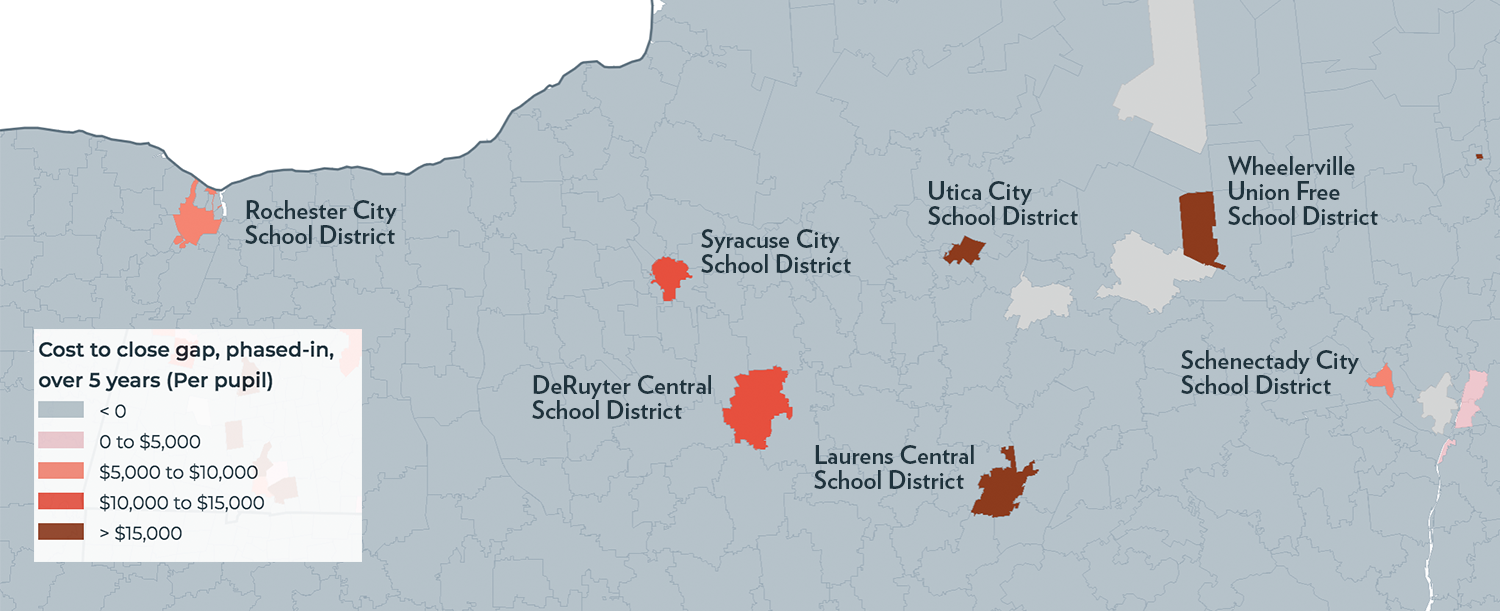
- Likewise, Figure 4 shows that New York state districts such as Schenectady, Utica, and Syracuse have large funding gaps. Compared with other New York districts, these three districts all have higher than average poverty rates and have a greater concentration of Latinx students.
- Even high-spending states have districts that are underfunded. For example, New York and Connecticut appear mostly gray on the map because the majority of their districts meet or exceed the funding levels indicated by our model. However, zooming in on the map shows that even in these states, there are districts with large funding gaps.
-
-
Figure 3
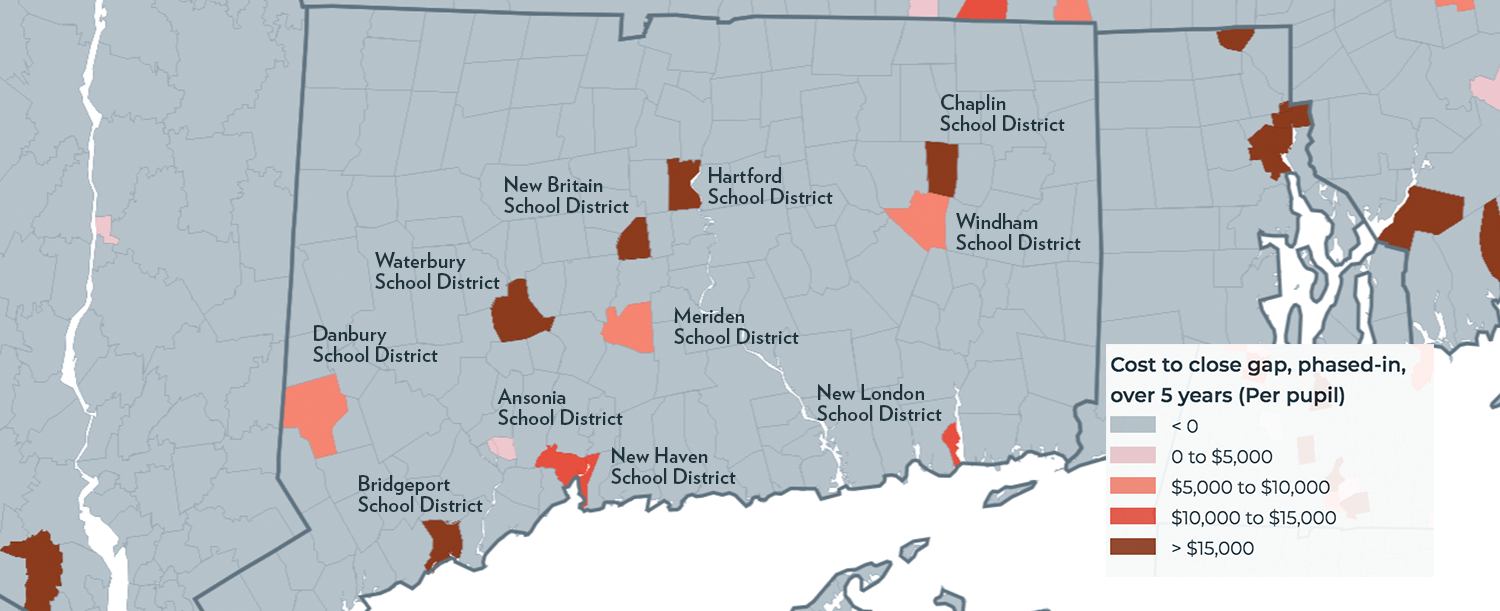
Figure 4
Conclusion
Inequity in public education is not a natural occurrence, but rather the result of funding choices. Decades of disinvestment in public education at the state and federal level have a cost, and it has primarily come at the expense of Latinx, Black, and low-income students. As protests across the country call into question how our policies affect communities of color and where we choose to direct our resources, policymakers have the power to make different choices that advance equity, rather than exacerbate inequality.
Some districts face daunting gaps. Minneapolis Public School District, for example, has a gap of $159 million, but it could bring every child up to grade level by redirecting its police department’s $193 million budget to public education. Many other districts, however, could tackle their funding gaps within five years if they allocated just a fraction of what they spend on policing toward public education.
Although the COVID-19 pandemic and the resulting recession will put more pressure on state and local budgets, the findings of this report remind us that the decisions we make on where to invest resources can have long-term consequences for the opportunities afforded to American children. By having a better understanding of where funding gaps exist, policymakers will be more prepared to make choices that advance racial and economic justice.
Appendix: Data and Methodology
I. Calculating One-Year Gaps (Map A)
i. District Funding Gap (Per Pupil)
For every school district in the country, our national cost model estimates what it would cost on a per-pupil basis for a district to achieve national average outcomes (based on 2016 reading and math assessments, grades three through eight) by 2020. The model takes into account varied geographic contexts and schools serving varied student populations—for example, that, all else equal, high-poverty districts must spend more to achieve the same outcomes.
These (2020) cost targets are then compared with the most recent year of actual district-level spending available (2017). Districts in which the 2020 cost estimate is greater than its 2017 spending have what we call a “funding gap” (7,224 districts nationwide). Districts in which the 2020 cost estimate is below its 2017 actual spending do not have a funding gap (5,8065 districts nationwide). Taken together, the funding gaps represent the total cost to the country of realizing the modest goal of raising the national floor to average outcomes of past years.
ii. District Funding Gap (Total)
To calculate the total funding gap in a given school district, we multiply the per-pupil gap from (i) by the district’s 2017 enrollment.
iii. State Funding Gap (Per Pupil)
To calculate the per-pupil statewide funding gap, we sum the total funding gaps (ii) for all districts in that state—meaning both districts in which 2017 spending is below 2020 estimated costs, as well as districts in which 2017 spending is above 2020 estimated costs. That is, we combine both under-achieving and over-achieving districts, adding together the negatives and the positives. In states that have an aggregate (positive) funding gap, we then divide that gap by statewide enrollment to produce a per-pupil statewide funding gap estimate.
States that have a “negative” funding gap do not have a per-pupil statewide funding gap (some two dozen states nationwide). This does not mean that there are not students or districts in that state with a funding gap. It means that on-average, when taking into account both districts with a funding gap as well as districts that are currently spending more than what is needed to achieve average outcomes, there is no per-pupil gap. In effect, the overachieving districts “cancel out” the under-achieving districts. States such as Wisconsin and Minnesota, for example, have many districts with significant funding gaps; but they also have many districts with “negative gaps,” and these districts outweigh the positive funding gaps.
iv. State Funding Gap (Total)
To calculate the total statewide funding gap, we sum all the districts in that state that have a funding gap—that is, districts where 2017 actual spending is below 2020 estimated costs. Unlike in (iii), we do not include districts that are currently spending more than what our model estimates is needed to achieve average outcomes. In other words, we sum only the positive funding gaps in each state. As a result, all states but one (Wyoming, which doesn’t have a single district with a funding gap) have a total statewide funding gap.
II. Calculating Five-Year Phase-In Gaps (Map B)
In part two, we built off of our one-year cost model to estimate what it would cost to “close the gaps” by phasing in funding from over five years, from 2021 to 2025. This model offers more realistic estimates for policymakers, in particular, as it provides them a roadmap for scaling up investments over time and gradually, rather than magically closing gaps overnight. Of course, these phase-in costs would be shared by both increased federal aid and increased state and local aid (precisely how such costs would be distributed is outside the scope of this paper).
For our five-year phase-in projections, we make the following assumptions:
- school district demographics remain constant;
- changes in school district enrollment continue on a linear trend;
- per-pupil costs grow at a constant rate (the rate of education cost inflation); and
- future cost estimates are compared to 2017 reported spending to determine gaps.
v. District Gap, Five-Year Phase-In (Per Pupil)
We expect that any plan to increase funding toward closing a gap would be phased in over time—for example, five years. However, five years down the road, the costs to achieve a given outcome will have changed by some amount in each district. For example, in a district in which the number of students stays constant, the spending target we are trying to hit in 2025 will have grown by the rate of education cost inflation (a rate derived from our model). At the same time, in some districts with very small enrollment, the per-pupil costs may actually be lower in 2025, if future increases in the number of students enrolled is projected to yield new economies of scale, thus driving down costs to achieve the same outcome level.
Once we have determined a new per-pupil cost target for 2025, we compare that number to a district’s most recent actual spending (2017 totals), which then provides us with a new per-pupil funding gap. We assume that we will close that gap using a five-year, phased-in approach, scaling up investments by 20 percent each year. This means that the per-pupil costs to close the funding gap using a phased-in approach is the sum of the costs in years 2021 through 2025, in which annual costs in those years are equal to:
- in 2021: 20 percent of five-year gap (2025 cost estimate less 2017 spending)
- in 2022: 40 percent of five-year gap (2025 cost estimate less 2017 spending)
- in 2023: 60 percent of five-year gap (2025 cost estimate less 2017 spending)
- in 2024: 80 percent of five-year gap (2025 cost estimate less 2017 spending)
- in 2025: 100 percent of five-year gap (2025 cost estimate less 2017 spending)
While 55 percent of all districts have one-year per-pupil funding gaps, 62 percent of districts have a positive cost for closing the funding gap through a phased-in approach. This is largely due to the fact that phased-in costs are calculated using 2017 spending levels against 2025 cost targets, which tend to be higher than 2020 cost targets. A district that has no one-year per-pupil gap may still have costs for a five-year phase-in due to the projected increase in the cost of education in 2025.
vi. District Gap, Five-Year Phase-In (Total)
To calculate the total costs to districts to close funding gaps using a phased-in approach, we use the same method as above (v), multiplying the per-pupil cost in each year by the projected enrollment in 2025, then summing across the five years:
- in 2021: 20 percent of five-year gap X estimated enrollment in 2025
- in 2022: 40 percent of five-year gap X estimated enrollment in 2025
- in 2023: 60 percent of five-year gap X estimated enrollment in 2025
- in 2024: 80 percent of five-year gap X estimated enrollment in 2025
- in 2025: 100 percent of five-year gap X estimated enrollment in 2025
vii. State Gap, Five-Year Phase-In (Per Pupil)
For each school district in a state with a projected phase-in gap, we divide the total costs in years one through five by projected enrollment in 2025, giving us a per-pupil phase-in gap for each year.
- in 2021: 20 percent of total five-year gap/estimated enrollment in 2025
- in 2022: 40 percent of five-year gap/estimated enrollment in 2025
- in 2023: 60 percent of five-year gap/estimated enrollment in 2025
- in 2024: 80 percent of five-year gap/estimated enrollment in 2025
- in 2025: 100 percent of five-year gap/estimated enrollment in 2025
We then sum those totals for each district, then some the district totals for each state.
viii. State Gap, Five-Year Phase-In (Total)
To calculate the total statewide costs of phasing in funding to close gaps over five years, we sum all the district totals (vi above) in that state that have positive projected phase-in costs—that is, districts in which 2025 cost estimates exceed 2017 actual spending.
III. Dataset and Interpretation
We are making the full dataset from our national cost model available here. This includes all calculations for every school district in the country, more than 1,300 in total. Note that cells with a value of (999) represent “negative” gaps—meaning that the district is currently spending above what our model estimates is needed to achieve average outcomes in 2020 or 2025.
What follows is an explanation for how to interpret the data that we have made available. The table below includes all estimates derived from our model for one representative school district, New Britain, Connecticut.
Below the table, we provide a real-life explanation for the various calculations, using New Britain as an example. We also provide a legend for New Britain, which corresponds to the larger datasheet, to help users locate specific pieces of information for any district in the country.
| Calculation Example: New Britain Central Schools | ||
| In Datasheet | ||
| LEAID | 902670 | Column A |
| District Name | New Britain School District | Column B |
| State | Connecticut | Column C |
| One-Year Estimates | ||
| Enrollment (Current) | 10,314 | Column D |
| Current Spending Per Pupil (2017) | $17,015 | Column E |
| Cost Target Per Pupil (2020) | $23,605 | Column F |
| Funding Gap (Per Pupil) | $6,590 | Column G |
| Funding Gap (Total) | $67,974,128 | Column H |
| Five Year Phase-In Estimates | ||
| Enrollment (2025 Estimated) | 10,729 | Column I |
| Current Spending Per Pupil (2017) | $17,015 | Column E |
| Year 5 Cost Target Per Pupil (2025) | $24,506 | Column K |
| Funding Gap Year 5 (Per Pupil) | $7,491 | Column L |
| Year 4 Costs Per Pupil (80% Gap) | <$5,993 | Column M |
| Year 3 Costs Per Pupil (60% Gap) | $4,495 | Column N |
| Year 2 Costs Per Pupil (40% Gap) | $2,996 | Column O |
| Year 1 Costs Per Pupil (20% Gap) | $1,498 | Column P |
| Summed 2025 Phase-In Costs (Per Pupil) | $22,473 | Column Q |
| Funding Gap Year 5 (Total) | $80,371,136 | Column R |
| Year 4 Costs Total (80% Gap) | $64,296,908 | Column S |
| Year 3 Costs Total (60% Gap) | $48,222,684 | Column T |
| Year 2 Costs Total (40% Gap) | $32,148,454 | Column U |
| Year 1 Costs Total (20% Gap) | $16,074,227 | Column V |
| Summed 2025 Phase-In Costs (Total) | $241,113,408 | Column W |
Using the most recent available data, we see that New Britain enrolls 10,314 students (column D) and spends approximately $17,015 per student (column E). Our national cost model projects that New Britain would need to spend $23,605 per pupil (column F) in order to bring students up to national average outcomes by 2020. This leaves a current per-pupil funding gap of $6,590 (column G), or nearly $68 million (column H) district-wide based on its current enrollment.
A gap of this size would likely need to be closed incrementally and over time. We model a scenario in which New Britain takes a gradual five-year phase-in approach to close its funding gap. Five years down the road, however, costs will have increased in New Britain. According to our model, which factors in various elements of New Britain’s demographics, we estimate that the costs to achieve common average outcomes will have increased by 104 percent in 2025 compared with 2020. This translates to a per-pupil cost target in 2025 of $24,506 (column K). This means that the funding gap between the 2025 target and the most recent actual spending is now $7,491 (column L), up from $6,590 in 2020 terms.
Further, we assume that New Britain attempts to close the gap 20 percent at a time, increasing per-pupil spending by $1,498 (column P) in the first year, by $2,996 (column O) in the second year, and so on. At year five, in 2025, New Britain will have fully closed the $7,491 per-pupil funding gap.
To determine the total per-pupil costs to close the gap (column Q), we then sum the amounts spent in each year of the phase-in (years one through five, or columns L through P). To calculate the total (not per pupil) costs to the district, we follow the same approach, only we multiply the per-pupil costs in each year (e.g. $1,498 in year one) by the expected enrollment in 2025, which is 10,729 (column I) based on a linear trend. We then sum the totals for each year 2020 through 2025 (columns R through V), and find that New Britain needs approximately $241 million (column W) in additional spending to gradually close its funding gap in five years.


