
Many policymakers agree that housing and land use reform is a top priority, particularly in New York State, in order to moderate housing prices. But an often-overlooked point is that such reform is also important in order to promote equal educational opportunity.
Because most public school students are assigned to schools in the neighborhoods where they live, housing reform is also education reform—a point that a series of Century Foundation reports on different communities in New York State is seeking to emphasize. In early April, TCF published a case study showing how restrictive zoning policies inhibit educational opportunity in Queens.1 And now this report focuses on how exclusionary housing policies (such as bans on multifamily housing and minimum lot size requirements) reduce educational opportunities on Long Island. Two subsequent reports in this series will address the connection between housing and schooling in other areas in the state.
A critical observation running through all the reports is that exclusionary zoning thwarts the opportunity of children from low wage and working-class families to attend high-performing schools. A 2016 study examining ninety-five big metropolitan areas found that those with more restrictive zoning and land use regulation were associated with higher levels of income segregation. The researchers, Michael C. Lens and Paavo Monkkonen, found that greater “density restrictions” (such as minimum lot sizes) increased income segregation by segregating the wealthy from the middle class. In addition, the authors found that “the complexity of the municipal review process, measured by the number of approvals that local governments require for new housing developments, is strongly related to the segregation of low-income households.”2
An additional body of research finds that providing low-income students a chance to attend more economically integrated schools can be one of the most powerful engines for improving academic achievement. Economically mixed schools are far more likely to have experienced teachers, and a community of parents who have the time and resources to volunteer in classrooms and support the education of all students.3 The one–two punch of exclusionary zoning that segregates families, and residency requirements for attending local public schools, drives separate and unequal schooling in America.
This report proceeds in five parts. The first part takes a deep dive into how two Long Island communities located in Nassau County—Flower Hill and Hempstead—vary dramatically in their demographic makeups, the prices of their homes, and in the educational opportunities that their school systems provide. The second part examines how it came to be that Flower Hill and the Village of Hempstead, located just nine miles apart, ended up so profoundly separate and unequal. That section of the report looks at the role of location, choice, racial engineering, and exclusionary zoning in driving economic and racial inequality between the two communities. The third part transitions to how the Long Island findings fit into the ongoing housing debate in New York State: what Governor Kathy Hochul has proposed, and how the political opposition from New York City suburbs kept the plan from making it into the state budget. The fourth part outlines reasons why the failure to produce a robust housing plan to date is deeply troubling. The fifth part charts a path for a better future.
Comparing Two Nearby Long Island Communities: Flower Hill and the Village of Hempstead
This report examines zoning restrictions and educational opportunity in two communities in Nassau County on Long Island. Nassau County, which is nestled between Queens and Suffolk County, is associated with some of the greatest wealth in the entire country. In F. Scott Fitzgerald’s The Great Gatsby, the opulent East Egg and West Egg are modeled, one reporter notes, after “Cow Neck and Great Neck, respectively, two peninsulas of Nassau County that border Manhasset Bay.” This area of Long Island is known as the Gold Coast.4 Nassau County is also home to Theodore Roosevelt’s famous Sagamore Hill estate, located in Oyster Bay.5 Long Island’s Suffolk County, meanwhile, is home to the Hamptons, with its glittering summer estates.
But the enormous wealth that resides on Long Island is just one part of the story, as the region also has considerable economic and racial diversity. According to the U.S. Census Bureau, of Nassau County’s 1.38 million residents in 2022, 57 percent were non-Hispanic whites, 18 percent Hispanic, 13 percent Black, and 12 percent Asian. The median household income was $127,000.6 But median income fluctuates a great deal. In Inwood, for example, median household income was $65,298 for 2017 to 2021, while in Sands Point, the median household income exceeded $250,000.7 Suffolk County, with a population of 1.53 million in 2022, was 66 percent non-Hispanic white, 21 percent Hispanic, 9 percent Black, and 4 percent Asian. The median household income was $112,000.8 In recent years, median household income varied a great deal. Riverside had a median income of just $39,571 in 2017, while more recently, Lloyd Harbor had a median household income in excess of $250,000.9
Long Island’s diverse residents are highly segregated by race and income.10 The civil rights group ERASE Racism reports that Long Island is “one of the 10 most racially segregated regions in the nation.”11 A recent ERASE Racism report found that Nassau County has the largest number of school districts with students of color who are intensely segregated of any county in the state.12 Consider the communities that are located near Long Island’s Meadowbrook Parkway. On one side of the parkway is mostly white Merrick, North Merrick, and East Meadow, while on the other is mostly minority Freeport, Roosevelt, and Uniondale. Some communities on one side of the parkway are as little as 1 percent white, and others on the other side are as little as 2 percent Black. Out of 291 Long Island communities, most Black residents are concentrated in just eleven of them.13
To examine the connection between zoning and educational opportunities, The Century Foundation worked with Vicki Been, a former deputy mayor for housing and economic development in New York City, and a faculty director of the Furman Center at New York University, and Been’s Furman colleagues Hayley Raetz, Jiaqi Dong, and Matthew Murphy, to identify two Long Island communities near one another that have different zoning regimes: Flower Hill and the Village of Hempstead. The communities are located just nine miles from one another, but in terms of zoning, racial and economic demographics, and the performance of the public schools, the two municipalities are a world apart.
FIGURE 1: FLOWER HILL AND THE VILLAGE OF HEMPSTEAD ARE NINE MILES APART
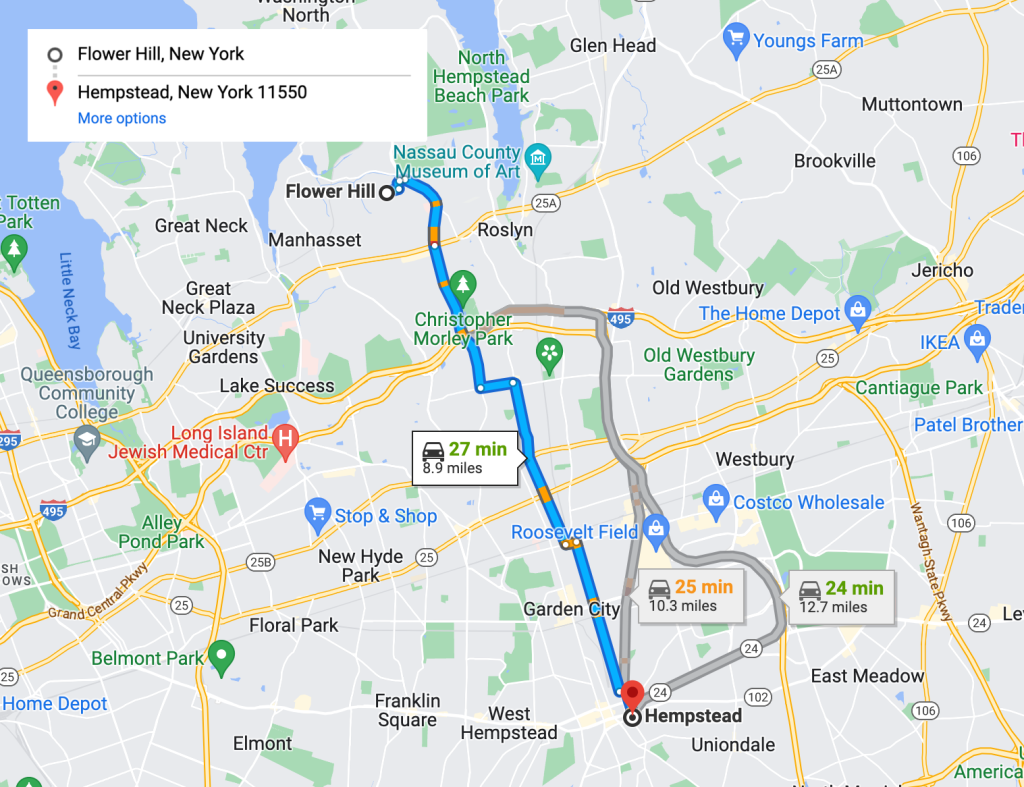
Flower Hill, a small community of 4,794 residents, had a population that is 74.4 percent non-Hispanic white, 12.3 percent Asian, 8.3 percent Hispanic, and just 1.7 percent Black in 2021. Eighty percent of the adult population had a bachelor’s degree or more. The median household income was a staggering $246,533.
The Village of Hempstead, a community with 59,169 residents, had a population that is 46.3 percent Black, 45.1 percent Hispanic, and just 4.8 percent non-Hispanic white and 1.7 percent Asian in 2021. Just 17 percent of adults had a bachelor’s degree or more—a gaping 63-point gap in college attainment compared with Flower Hill. The median household income in Hempstead was $74,680, less than one third the income in Flower Hill. (See Table 1 and Appendix 1.)
TABLE 1
| FLOWER HILL AND THE VILLAGE OF HEMPSTEAD DEMOGRAPHICS, 2021 | ||
| Flower Hill | Village of Hempstead | |
| Median household income | $246,533 | $74,680 |
| Percentage of adults with a bachelor’s degree or higher | 80.1% | 17.3% |
| White | 74.4% | 4.8% |
| Black | 1.7% | 46.3% |
| Hispanic | 8.3% | 45.1% |
| Asian | 12.3% | `1.7% |
| Source: NYU Furman Center. For more details, see Appendix 1. | ||
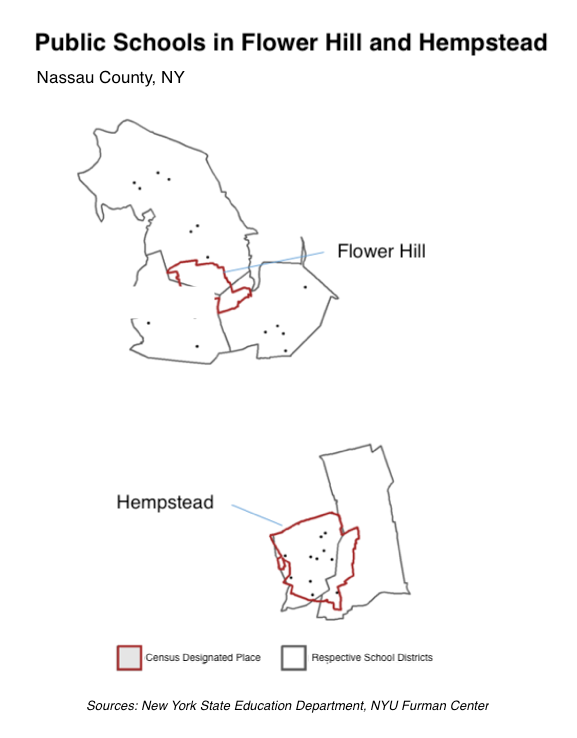
The local public school student populations in Flower Hill and the Village of Hempstead reflect the different demographics of the two communities. Flower Hill does not have its own school system and is instead served by three public school districts—Roslyn Union Free School District, Manhasset Union Free School District, and Port Washington Union Free School District.14 In Flower Hill–serving schools, 14.1 percent of students were eligible for free or reduced price lunch in 2021 at the elementary school level (meaning they come from families at or below 185 percent of the poverty line). In Hempstead, where almost all students are served by the Hempstead Union Free School District, the comparable proportion of public school students eligible for subsidized lunch was 65.1 percent. (See Figure 2.)
FIGURE 2
Researchers have concluded that in order to provide equal opportunity, schools with higher concentrations of poverty like those in the Village of Hempstead should spend more money per pupil in order to provide genuine equal opportunity. In fact, however, the per pupil expenditure in 2020 was $16,443 in Hempstead, or about $4,000 less per pupil than in Flower Hill, where the expenditure was $20,457. That extra money in Flower Hill was able to purchase important educational benefits, such as lower student–teacher ratios. In 2021, for example, there were 9.6 students for every teacher in Flower Hill at the elementary school level, compared with 17.6 students for every teacher in Hempstead.
Teacher experience can improve academic achievement for children, yet in Hempstead, 15.2 percent of teachers were in their first or second year of teaching in 2017, six times the rate of Flower Hill, where just 2.5 percent of teachers were in their first or second year.
Finally, access to College Board Advanced Placement (AP) classes can be a sign of a rich and rigorous curriculum. At Flower Hill, those courses are abundant. Roslyn High School offers twenty-four types of AP classes, and Paul D. Schrieber Senior High School offers thirty-seven types of AP classes. Data were not available for AP offerings in Hempstead through the same source as those found for Flower Hill. (See Appendix 3.) But local data suggest that Hempstead High School offered seventeen AP courses.15
TABLE 2
| FLOWER HILL AND THE VILLAGE OF HEMPSTEAD: SCHOOL FACTORS AND OUTCOMES | ||
| Flower Hill | Village of Hempstead | |
| Percent of students qualifying for free and reduced-price lunch, elementary level, 2021–22 | 14.1% | 65.1% |
| Per-pupil expenditure, 2020 | $20,457 | $16,443 |
| Student–teacher ratio, elementary level, 2021 | 9.6 | 17.6 |
| Share of teachers in their first or second year of teaching, 2017 | 2.5% | 15.2% |
| Percentage of students performing at grade level in English, 2019 | 73.8% | 30.9% |
| Percentage of students performing at grade level in Math, 2019 | 76.7% | 30.8% |
| Percentage of high school students who graduated in four years, 2019 | 94.6% | 75.0% |
| Source: NYU Furman Center. For more details, see Appendix 1. | ||
In 2019, 31 percent of Hempstead students were performing at grade level in English, compared with 74 percent of students in Flower Hill—a staggering 43-percentage-point gap. In math, 31 percent of Hempstead students performed at grade level, compared with 77 percent of Flower Hills students, an even larger 46-point gap. In 2021, only 75 percent of Hempstead public high school students graduated in four years, compared with 95 percent of Flower Hill public high school students.
Some might attribute the different level of student performance entirely to the fact that wealthier parents can provide, on average, more opportunities to children, but that would be an overstatement. It is true that the socioeconomic status of a child’s family has a powerful relationship to opportunity, and therefore student achievement. A student who has good nutrition, health care, a quiet place to study, and access to the Internet, can be expected, on average, to perform better academically than a student deprived of these supports.16 So the higher levels of student economic need found in Hempstead compared to Flower Hill would be expected, by itself, to translate into somewhat lower levels of achievement for the student body as a whole.
But separate and unequal schooling itself plays a well-documented role in exacerbating inequalities. Lower levels of school expenditure, lower levels of teacher experience, and the well-documented harmful effects of concentrated poverty all take an additional toll on student achievement at the national level. Student performance in Hempstead suggests it is no exception.
How Did Flower Hill and the Village of Hempstead Become Separate and Unequal?
How did Flower Hill and the Village Hempstead—and other communities on Long Island—end up so economically and racially segregated? And how did their schools end up so unequal?
There are three broad theories advanced by researchers: (1) segregation reflects the family choices and the working of the marketplace; (2) segregation reflects past and present racial discrimination (which is illegal today); and (3) segregation reflects income discrimination through zoning (which remains totally legal).17 There is some truth in each of these theories, and we examine the strength of the evidence to support each below.
Choice and the Marketplace
The most benign interpretation of the staggering inequalities between Flower Hill and the Village of Hempstead is that the racial and socioeconomic differences represent individual choices, as well as the reality that in a market-based economy, communities that offer stronger amenities—such as well-run public schools, or large homes—will command higher housing prices that tend to exclude working class families, a disproportionate share of whom are people of color.
There is some truth to this analysis, but it is at best an incomplete truth. There is, for example, some reason to believe that Black and Hispanic Americans, who can face discrimination in the workplace and schooling, may seek a residential area where they can avoid such indignities. And it is true that higher-income Americans will pay extra for a strong public school system, or for a home in a North Shore Long Island community such as Great Neck that affords picturesque views of the bays associated with the Long Island Sound.
But there are also limits to this explanation. A poll of Long Island Black residents found that 69 percent preferred integrated neighborhoods, while just 1 percent wanted to live in all-Black neighborhoods.18 The preferences of Black families clearly does not explain the very high levels of segregation found in parts of Long Island. And in the cases of Flower Hill and Hempstead, both provide roughly similar commutes to work in Manhattan and neither is located on the water. Choice and the marketplace both matter (Flower Hill’s higher performing schools can explain higher housing prices); but the evidence outlined below suggests there is more to the story.
Past and Present Racial Discrimination
Racial discrimination—past and present—also helps explain why Long Island communities such as the Village of Hempstead and Flower Hill and others became and remain highly segregated. While Hempstead has a long history of being open to African Americans, many other Long Island communities were strictly off limits.19 One tool of exclusion was the use of racially restrictive covenants, which forbade homeowners from reselling a property to Black people. Richard Rothstein’s monumental history of racial discrimination in housing, The Color of Law, notes that a survey of 300 developments built between 1935 and 1947 in Nassau County (and other Manhattan suburbs such as Queens and Westchester County) found that “56 percent had racially restrictive covenants. Of the larger subdivisions (those with seventy-five or more units) 85 percent had them.”20
Emblematic of the exclusion was Nassau County’s famous Levittown, a massive development of 17,500 homes, popular among returning World War II veterans, and located just six miles from Hempstead. As Rothstein notes, some returning Black veterans literally helped build Levittown, but they were not permitted to live there.21 The creator of Levittown, William Levitt, was a bigot, Rothstein says, but even if he had not been, the Federal Housing Administration and Veteran’s Administration—which helped provide the necessary financial guarantees to make Levittown possible—would not have provided public support for Levittown had the development allowed Black people to live there. Having racially restrictive covenants was a key condition of federal approval.22 (Another Levittown was subsequently built in Bucks County, Pennsylvania, with the same set of racially exclusionary requirements.)23 The effect of the federal policies was to establish starkly segregated communities—on Long Island, in Bucks County, and throughout the country. In 2022, Levittown, New York was just 2 percent Black.24
Racially restrictive covenants were struck down by the U.S. Supreme Court in 1948 in the case of Shelley v. Kraemer, but the effects linger.25 The policies in towns like Levittown robbed Black families of the wealth they might have accumulated—an important factor in perpetuating segregation today. Because many white families won’t buy in predominantly Black communities, houses in Black communities appreciate at slower rates than in white communities. Rothstein estimates that families buying in a predominantly Black community on Long Island saw home appreciation of about $45,000 over three generations, compared with more than $200,000 in appreciation for the white families in Levittown.26 The lingering wealth gap between Black and white people—which is enormous—continues to make it difficult for Black people to purchase homes in higher-opportunity communities such as Flower Hill today. While Black families make about 58 percent of what white families make in annual income in the United States, median Black family wealth was just 12.5 percent of median white family wealth in 2019.27
Moreover, although the 1968 Fair Housing Act made it illegal to discriminate based on race in the sale or rental of housing, undercover testers continue to expose such discrimination in various parts of the country—including Long Island. In November 2019, Newsday revealed the stunning results of a three-year-long investigation of racial discrimination by Long Island real estate agents.28
Newsday hired 25 undercover testers—potential homebuyers showing the same financial strength and seeking similar types of homes, but coming from different racial and ethnic communities—to investigate 93 real estate agents on Long Island. The newspaper conducted 39 tests pairing Black and white homeseekers; 31 comparing Hispanics and whites, and 16 comparing Asians and whites. They also used hidden cameras to record encounters with agents. All in all, Newsday found that Asian Americans suffered unequal treatment 19 percent of the time, Hispanics 39 percent of the time, and Black people 49 percent of the time.
The discrimination took various forms. Real estate agents tended to steer white testers to more heavily white communities, and Black testers to areas with lower white representation. One Black tester, Johnnie Mae Alston, told Newsday, “They’re putting you in a place that they think you belong. They’re telling you that you don’t belong on this side of town because of your race or whatever and it’s not right.” Alston continued: “Just because you think I would rather be here or because I’m a certain race you think that I should be over here. But what about my choices of where I want to live?”
The Newsday series did not feature Flower Hill in particular, but it did discuss the way brokers treated housing properties in Hempstead. Newsday’s investigation found that “agents directed all but a small share of testers to communities with larger proportions of white residents” than those of Hempstead and other heavily minority communities. Interestingly, even minority testers were steered away from places like Hempstead.29
Some might read the steering of minority residents away from Hempstead as evidence of an absence of discrimination, but experts say that instead it can be seen as a different form of discrimination based not on the race of the home seeker but on the race of entire neighborhoods. “You could argue that this does not show discrimination against the home seekers because everybody was steered away from these neighborhoods,” Gregory Squires of George Washington University told Newsday. “If in fact that’s the case, what it suggests is discrimination against certain neighborhoods because of the racial composition of those neighborhoods.”30
Newsday also interviewed Lenora W. Long, a longtime Hempstead broker, who said that when white agents from big firms do contact her about Hempstead properties for their clients, “It’s usually black or Hispanics shuttled into Hempstead.” She said in her eighteen years in real estate, “I’ve never had the experience of an agent from the North Shore or South Shore bringing a Caucasian looking for a home in Hempstead.”31
In 2021, following the Newsday reporting, Governor Andrew Cuomo created New York’s Fair Housing Testing program to provide state resources to nonprofits to detect and expose unlawful racial discrimination in housing by agents, landlords and sellers. (Nonprofits such as the Fair Housing Justice Center have long been engaged in this type of work.)32 In 2023, Governor Hochul allocated a modest $2.2 million in additional funding for the program.33
Income Discrimination through Zoning
Research suggests that there is a third powerful explanation for economic and racial segregation of the type found in places such as Flower Hill and the Village of Hempstead: the role of government zoning in producing income discrimination. Unlike racial discrimination, government-sponsored income discrimination is perfectly legal.
Government-sponsored zoning restrictions that make it illegal to build multifamily housing, or require that homes not be built unless they are on very large plots of land, systematically exclude low-income and working-class people, a disproportionate share of whom are people of color. Princeton researcher Douglas Massey and his colleagues concluded in a 2013 analysis that “Density zoning is now the most important mechanism promoting class and racial segregation” in the United States.34
After racial zoning laws were struck down by the U.S. Supreme Court in 1917, many communities switched to economic zoning as another way to achieve racial (and economic) exclusion.35 In the Long Island community of Huntington, New York, for example, an urban renewal effort in the 1960s allowed multifamily homes to be built in a heavily minority community, but an attempt to build similar homes in a 98-percent-white area zoned for single-family homes exclusively was rejected.36 Four decades later—in 2022—Huntington was 76 percent white, 12 percent Hispanic, 5 percent Asian, and 4 percent Black.37
Data from NYU’s Furman Center show that Flower Hill employs a number of key zoning restrictions that differ dramatically from those in the Village of Hempstead. The two most important differences have to do with the degree to which multifamily housing is allowed; and the requirements around minimum lot sizes for homes.
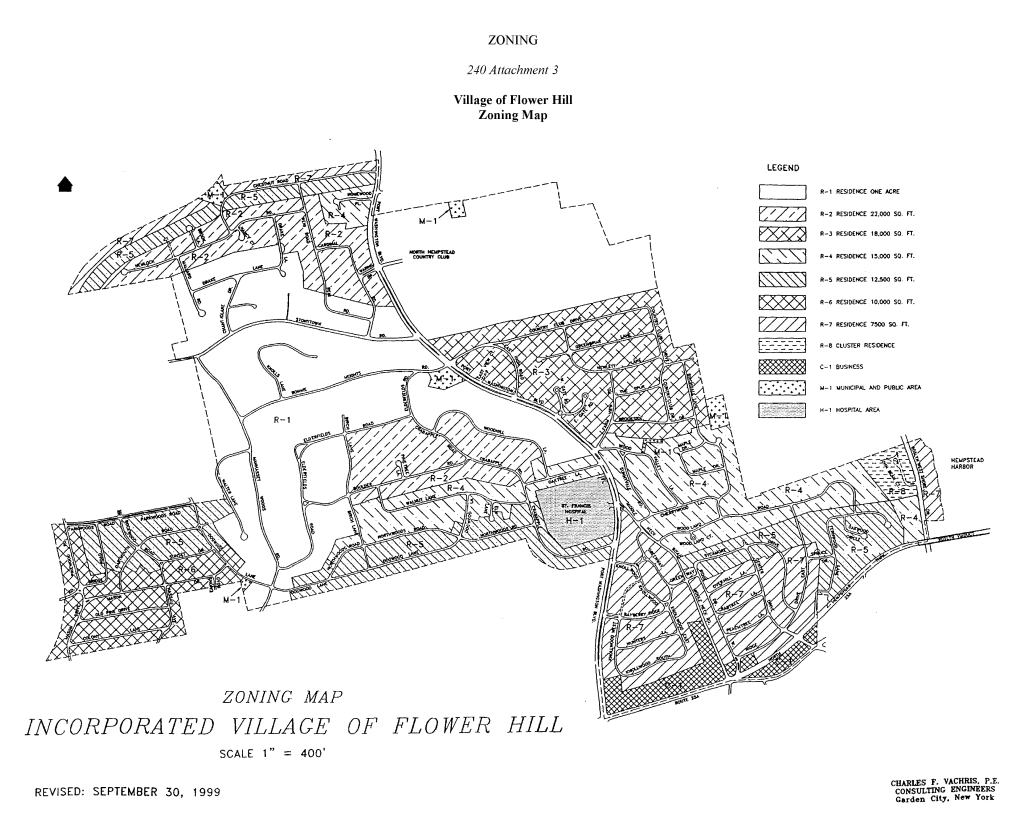
In Flower Hill, as Vicki Been notes in Appendix 2, multifamily housing is essentially banned, and as a result, “its housing stock is all single family homes.” In Flower Hill, 74.8 percent of the lot area in 2021 was occupied by existing structures classified as single-family, year-round residences, and most of the rest of the land was occupied by a country club and a hospital. (See Figure 3.) Multifamily housing is banned throughout, unless the Village Board of Trustees makes an exception. A paltry 0.4 percent of the lot area consisted of two- or three-family housing or apartment buildings in 2021.
FIGURE 3
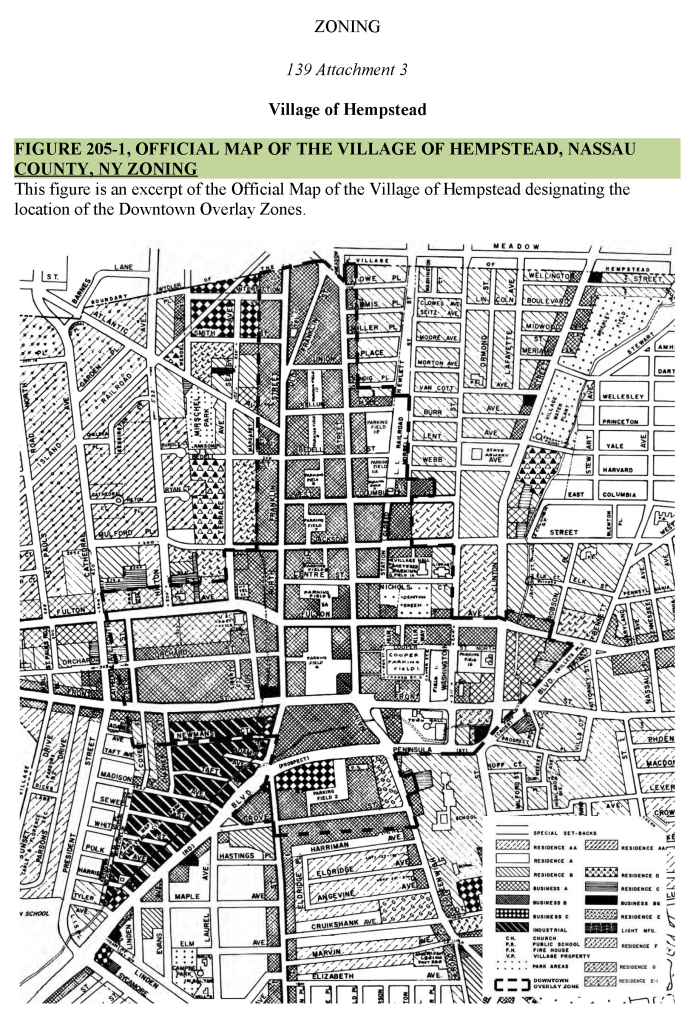
The Village of Hempstead, by contrast, Been notes, has “a fairly dense, mixed-use land use system” that allows multifamily homes in much of the village’s land. A little more than half (55.1 percent) of lot area in 2021 was occupied by single family year round residences. Been concludes, “Hempstead’s system has produced a higher-density community with a variety of housing choices for both renters and homeowners and different levels of income.”
FIGURE 4: THE VILLAGE OF HEMPSTEAD ZONING MAP
The different zoning regimes have yielded different types of growth in recent years. In Hempstead, 33 percent of units (16 of 49) authorized to be built between 2014 and 2021 were for multifamily housing. In Flower Hill, the comparable figure was 0 percent (0 of 85 units). Every single unit authorized in Flower Hill was for a single-family home. Real estate developers can often make more money on multifamily homes, because they can divide the cost of the land between several units. In places like Long Island, where demand for housing is high, it would be profitable for developers to build multifamily housing.38 But Flower Hill didn’t authorize any.
TABLE 3
| FLOWER HILL AND HEMPSTEAD HOUSING POLICIES AND OUTCOMES | ||
| Flower Hill | Village of Hempstead | |
| Share of lot area, existing structures classified as single-family year-round residences, 2021 | 74.8% | 55.1% |
| Share of new units authorized that are single-family housing, 2014 to 2021 | 100% (85 of 85) | 67% (33 of 49) |
| Median single-family housing price, 2020 | $1,623,469 | $415,608 |
| Share of occupied housing, occupied by renters, 2021 | 11.1% | 55.7% |
| Population density per square mile, 2020 | 3,000 | 16,000 |
| Growth of population, 2010 to 2020 | 2.8% | 9.8% |
| Source: NYU Furman Center. For more details, see Appendix 1. | ||
Moreover, Flower Hill doubles down on exclusion by requiring that single-family homes be built on large lots of land, driving up the prices of those homes. Been notes that “the vast majority” of Flower Hill is zoned to require one-third of an acre (14,520 square feet), and often much more. In contrast, Been says, Hempstead allows lots for single family homes as small as 4,000 square feet (less than one tenth of an acre) and its largest minimum lot size is 7,500 square feet (0.17 of an acre).39
To its credit, Flower Hill approves units with less delay than Hempstead (three months on average, compared with about ten for Hempstead). And Flower Hill has other attributes that in some ways are considered as less restrictive by the Wharton Land Use Index.40 (See Appendix 1.)
The speed of approval is of little value, however, to working-class families, who cannot afford a single-family home, especially in Flower Hill. In 2020, the median single-family housing price in Flower Hill was an extraordinary $1.62 million, almost four times the $415,000 median price in Hempstead. And renting is rarely an option. In Flower Hill, just 11 percent of occupied housing units were occupied by renters in 2021, compared with 56 percent of such units in Hempstead.
The overall result is that Flower Hill is both enormously expensive, and lightly populated. Flower Hill had only one-fifth the density of Hempstead in 2020, with just 3,000 people per square mile, compared with 16,000 people per square mile in Hempstead. And overall growth of the population was just 2.8 percent in Flower Hill between 2010 and 2020, compared with a 9.8 percent growth rate in Hempstead.
A Setback for Governor Hochul’s Housing Compact
In the spring of 2023, New York State policymakers were embroiled in a major fight over housing as part of the state budget negotiations. In the end, the Democratically controlled New York State Senate and Assembly both rejected Hochul’s proposal to include in the state budget a New York Housing Compact to build 800,000 new homes over the next decade.41 The plan was shelved in budget negotiations.
Under the Compact, downstate municipalities would have been given the goal of increasing their housing supply by 3 percent every three years. (Upstate communities would have been asked to seek to increase housing supply by 1 percent every three years.) Under the proposal, if communities failed to reach those goals, the state would require municipalities to provide applicants for housing permits with a fast track approval process. In addition, downstate areas would need to rezone for greater housing within a half mile of commuter railway and subway stations.42
Opposition from the suburbs, including Nassau and Suffolk Counties on Long Island and Westchester County in the lower Hudson Valley, was fierce. Significantly, a key figure, Westchester County’s Andrea Stewart-Cousins, the Democratic leader of the State Senate, rejected Hochul’s plan and called instead for financial incentives to encourage communities to voluntarily permit more housing.43
Long Island proved a bastion of opposition. Nassau County executive Bruce Blakeman told Politico: “You will see a suburban uprising, the likes of which you’ve never seen before, if the state tried to impose land-use regulation on communities that had had local control for over 100 years.”44 Long Island State Assemblyman Edward Flood (erroneously) claimed, “Governor Hochul’s housing proposals would be a disaster for our community. Her goal is to turn Brookhaven into the Bronx.”45 Suffolk County officials also voiced opposition.46
Hochul’s plan would have heavily impacted Long Island. Because it is a downstate municipality, Long Island communities would have been subject to the more ambitious 3 percent growth goal every three years. In the previous three years, Long Island housing stock increased just 0.6 percent.47 Long Island would also have been heavily affected by Hochul’s proposal that downstate areas would need to rezone for greater housing within a half mile of commuter railway and subway stations. The tentacles of the Long Island Railroad reach out to dozens of Long Island’s communities.48 The railroad is known nationally because it “carries more commuters than any other railroad in the country.”49
Notably, some Long Island voices strongly supported reform. A regional civil rights group, ERASE Racism, which supports school and housing integration, has been a vocal supporter of Hochul’s Housing Compact. The group, which has done pioneering work lifting the voices of students in school integration debates, sees the Housing Compact as a civil rights issue that will make housing and schools more equitable.50 Likewise, Assemblyman Phil Ramos from Suffolk County supported Hochul’s plan and rejected the voluntary approach to reform offered by others. He bluntly told people at one housing rally, “It doesn’t matter what kind of incentive you give them—a wealthy community, before they allow Black and brown people in, they’ll walk away from any amount of money.”51
But Ramos’s argument did not win the day, as a bipartisan coalition of suburban Democratic and Republican voices blocked reform in the state budget. Because Democrats have unified control over both houses of the state legislature and the governor’s mansion, they could have enacted reform over Republican opposition. But that did not happen.
The political dynamics were fascinating, as the housing debate upended the traditional political alignments in New York State. The New York State Senate and Assembly are often considered to be to the political left of the moderate Democratic Governor. On issues such as how to combat crime and whether to raise taxes on the wealthy, both houses of the legislature are considered more progressive than Hochul. But when it came to housing, enough liberal suburban Democratic voices in the legislature allied with conservative Republicans to kill a moderate Democratic governor’s reforms. It appeared to be a story of class interests trumping professed ideology, as upper-middle-class white people who vote reliably Democratic drew the line at policies that would moderate housing price increases and open up their communities to more economic and racial integration.52
Governor Hochul was pushing housing reform in the state budget as a tactic, because the budget is a must-pass item, but there is still a possibility of reform in the general legislative session, which runs through June.
Why the Housing Compact Matters
The defeat of housing reform in the budget in New York State was not inevitable, and the experience in other states gives reason for cautious optimism around reform during the legislatures’ general session. In other progressive states—such as California and Washington —bipartisan coalitions have come together to enact reform over the opposition of wealthy suburban interests in the last few years.53 More recently, in 2023, Arlington, Virginia, an affluent suburb of Washington, D.C., enacted important housing reforms that legalized multifamily housing of up to four or six units in what had been exclusively single-family housing.54
New York needs to enact robust housing reform—rather than just providing financial lures—as Governor Hochul argued, because “merely providing incentives will not make the meaningful change that New Yorkers deserve.” Currently, zoning laws that artificially constrain the supply of housing have been driving up prices to intolerable levels. In New York State, more than half of residents spend at least 30 percent of their income on housing.55 Between 2010 and 2018, New York City suburbs issued less than half of the number of building permits of Boston suburbs, and one-third of Washington, D.C. suburbs, even though the populations in Boston and D.C. suburbs are considerably smaller.56 Moreover, closer to home, more housing was built in suburban Northern New Jersey—which has a relatively small but dense geographic footprint—than on Long Island and the Hudson Valley put together.57
Moreover, as the evidence in this report suggests, housing reform is a critical strategy for improving educational opportunity. Failing to act means that New York will not be able to tap into the full potential of all of its students.
Imagining a Better Future
The inequities documented in this report between Flower Hill and Hempstead are part of a larger challenge on Long Island (and the nation). The civil rights group ERASE Racism finds that throughout Long Island, housing policies create residential segregation, which in turns feeds school segregation, and inequitable school resources. In a 2022 report, for example, ERASE Racism compared eleven intensely segregated school districts on Long Island (those with 90–100 percent non-white populations) with forty predominantly white Long Island school districts (those with more than 70 percent white populations). They found that “intensely segregated districts have, on average, nearly $10,000 less in annual revenue per student than predominantly White districts.”58
There are many policy options for addressing these inequities. Public school districts should use public school choice programs that are consciously designed to promote school integration. School finance reform would help level the playing field. In the housing arena, more funding should be allocated to hiring testers to ferret out racial discrimination on the part of landlords and real estate agents. In addition to those important initiatives, the best near-term vehicle for reform in New York State is Governor Hochul’s Housing Compact. It would begin to address the root problem—that exclusive communities won’t tear down the walls they have erected to keep low-wage families from living in those neighborhoods and attending their high-opportunity public schools.
As ERASE Racism notes, about 16 percent of new housing statewide under the Housing Compact would be built on Long Island. In supporting the compact, the group noted, “Far too often, affordable housing has been placed in already overburdened Black and Latino communities. It is time for localities everywhere to provide the range of housing, including affordable housing, needed.”59
A wide body of research suggests students of modest means would benefit enormously from having the chance to attend high-opportunity schools, and that students in places like Flower Hill would benefit as well, because they would be enriched by interacting with students who have a different set of life experiences.60 Cities and towns on Long Island—and across the nation—have pursued the separate-and-unequal approach to housing and schooling for far too long. It is time to try something better.
Appendixes
Notes
- Richard D. Kahlenberg, “How Housing Policies Create Unequal Educational Opportunities: The Case of Queens, New York,” The Century Foundation, April 3, 2023, https://tcf.org/content/report/how-housing-policies-create-unequal-educational-opportunities-the-case-of-queens-new-york/.
- Michael C. Lens and Paavo Monkkonen, “Do Strict Land Use Regulations Make Metropolitan Areas More Segregated by Income?” Journal of the American Planning Association 82, no. 1 (2016): 6–21, https://www.ncbi.nlm.nih.gov/pmc/articles/PMC5800413/ .
- Richard D. Kahlenberg, All Together Now: Creating Middle Class Schools through Public School Choice (Washington, D.C.: Brookings Press, 2001); Richard D. Kahlenberg (ed)., The Future of School Integration: Socioeconomic Diversity as an Education Reform Strategy (New York: The Century Foundation Press, 2012); and Richard D. Kahlenberg, “How Housing Policies Create Unequal Educational Opportunities: The Case of Queens, New York,” The Century Foundation, April 3, 2023, https://tcf.org/content/report/how-housing-policies-create-unequal-educational-opportunities-the-case-of-queens-new-york/.
- Gabrielle Lipton, “Where Is Jay Gatsby’s Mansion? And can I visit it?” Slate, May 6, 2013, https://www.slate.com/articles/arts/culturebox/2013/05/where_is_the_real_jay_gatsby_mansion_from_f_scott_fitzgerald_s_the_great.html.
- National Park Service, “Sagamore Hill,” https://www.nps.gov/sahi/index.htm.
- U.S. Census Bureau, “Quick Facts: Nassau County, New York,” https://www.census.gov/quickfacts/nassaucountynewyork.
- U.S. Census Bureau, “Quick Facts: Inwood CDP, New York,” https://www.census.gov/quickfacts/fact/table/inwoodcdpnewyork/LND110210; and Suburbs 101, “Top 10 Wealthiest Towns on Long Island (2023), https://suburbs101.com/wealthiest-towns-long-island/.
- U.S. Census Bureau, “Quick Facts: Suffolk County, New York,” https://www.census.gov/quickfacts/fact/table/suffolkcountynewyork/HCN010217.
- Ben Axelson, “The poorest places in each of New York’s 62 counties,” New York Upstate, August 14, 3017, https://www.newyorkupstate.com/news/2017/08/the_poorest_places_in_each_of_new_yorks_62_counties.html; and Suburbs 101, “Top 10 Wealthiest Towns on Long Island,” 2023, https://suburbs101.com/wealthiest-towns-long-island/.
- This report uses racial and income segregation to mean that white residents are unlikely to live in the same communities as Black and Hispanic residents, and that high income residents are unlikely to live in the same communities as low-income residents.
- “ERASE Racism Supports Governor Hochul’s Proposed New York Housing Compact,” ERASE Racism, March 14, 2023, https://www.eraseracismny.org/component/content/article/28-press-releases/1037-erase-racism-supports-governor-hochuls-proposed-new-york-housing-compact.
- ERASE Racism, “ ERASE Racism Issues Research Report on Inequity in New York’s Public Schools: Analyzing a Decade of Data, the Report Busts Longstanding Myths About School Segregation,” April 24, 2023. https://www.eraseracismny.org/component/content/article/28/1057
- Olivia Winslow, “Dividing Lines, Visible and Invisible,” Newsday, November 17, 2019, https://projects.newsday.com/long-island/segregation-real-estate-history/.
- Niche, “2023 Best School Districts in Flower Hill,” https://www.niche.com/k12/search/best-school-districts/t/flower-hill-nassau-ny/.
- Hempstead Public Schools, “Hempstead High School: 2022-2023 Course Catalog,” 97, https://www.hempsteadschools.org/cms/lib/NY01920790/Centricity/Domain/206/Final%20Final%20HHS%20COURSE%20CATALOG%2022-23.pdf.
- See, e.g., Richard Rothstein, Class and Schools: Using Social, Economic and Educational Reform to Close the Black-White Achievement Gap (Washington, D.C.: Economic Policy Institute, 2004).
- See Maria Kryson, Kyle Crowder, and Michael Bader, “Pathways to Residential Segregation,” in Choosing Homes, Choosing Schools, ed. Annette Lareau and Kimberly Goyette (New York: Russell Sage Foundation, 2014), 36–39 (describing three theories).
- Olivia Winslow, “Poll: LI Blacks Prefer Integrated Housing,” Newsday, February 29, 2012, http://eraseracismny.org/storage/documents/Olivia _Winslows_article_about_Housing_Survey_Report.pdf (citing Erase Racism, “Housing and Neighborhood Preferences of African Americans on Long Island, 2012 survey research report; integrated neighborhoods were defined at 50 percent Black and 50 percent white).
- Richard Rothstein, The Color of Law: A Forgotten History of How Our Government Segregated America (New York: Liveright Publishing Corp/W.W. Norton, 2017), 68.
- Rothstein, The Color of Law, 79–80.
- Rothstein, The Color of Law, 69, 182.
- Rothstein, The Color of Law, 70-71, 85, 266.
- Rothstein, The Color of Law, 140.
- U.S. Census Bureau, Quick Facts: Levittown CDP, New York, https://www.census.gov/quickfacts/levittowncdpnewyork. See also Rothstein, The Color of Law, 284.
- Shelley v. Kraemer, 334 U.S. 1 (1948).
- Rothstein, The Color of Law, 182.
- Ana Hernandez Kent and Lowell R. Ricketts, “Has Wealth Inequality in America Changed Over Time? Here are Key Statistics,” Federal Reserve Bank of St. Louis, December 2, 2020 (in 2019, median Black family wealth was $23,000 compared with $184,000 for non-Hispanic white families), https://www.stlouisfed.org/open-vault/2020/december/has-wealth-inequality-changed-over-time-key-statistics.
- Ann Choi, Bill Dedman, Keith Herbert, and Olivia Winslow, “Long Island Divided,” Newsday, November 17, 2019, https://projects.newsday.com/long-island/real-estate-agents-investigation/#open-paywall-message.
- “Long Island Divided,” Part 4.
- “Long Island Divided,” Part 4.
- “Long Island Divided,” Part 4.
- See Fair Housing Justice Center, https://fairhousingjustice.org/about-fhjc/our-history/.
- “Governor Hochul Announces Expanded Efforts to Combat Housing Discrimination Across New York,” New York State Homes and Community Renewal, February 24, 2023, https://hcr.ny.gov/news/governor-hochul-announces-expanded-efforts-combat-housing-discrimination-across-new-york.
- Douglas S. Massey, Len Albright, Rebecca Casciano, Elizabeth Derickson, and David N. Kinsey, Climbing Mount Laurel: The Struggle for Affordable Housing and Social Mobility in an American Suburb (Princeton, N.J.: Princeton University Press, 2013), 19.
- Buchanan v. Warley, 245 U.S. 60 (1917).
- Huntington Branch, NAACP v. Huntington, 844 F.2d 926, 928 (2d. Cir. 1988). See also Jerusalem Demsas, “America’s Racist Housing Rules Really Can Be Fixed: More Than 50 Years After Passage of the Fair Housing Act, It’s Time to Sue the Suburbs,” Vox, February 17, 2021, https://www.vox.com/22252625. /america-racist-housing-rules-how-to-fix. This type of income discrimination is illegal if it has a disparate impact on racial minorities and the defendant cannot provide a sufficient non-racial justification for the policy.
- U.S. Census Bureau, “Quick Facts: Huntington town, Suffolk County, New York,” https://www.census.gov/quickfacts/huntingtontownsuffolkcountynewyork
- Michael Andersen, “We Ran the Rent Numbers on Portland’s 7 Newly Legal Home Options,” Sightline, August 1, 2021, https://www.sightline.org/2021/08/01/we-ran-the-rent-numbers-on-portlands-7-newly-legal-home-options/.
- There are 43,560 square feet in an acre.
- Surprisingly, the Wharton Land Use Index Composite metric defines Flower Hill as less restrictive overall than Hempstead. See Appendix 1. But as Been explains in detail in Appendix 2, a closer examination “reveals significant limitations on the score’s usefulness” in this particular set of communities. The score relies on survey data that were much less complete in the case of Flower Hill than Hempstead. In addition, Flower Hill was designated as less restrictive in part because it does not have open space requirements on multifamily housing. Of course, this is true because Flower Hill allows virtually no multifamily housing. Finally, as noted in the text, the speed of approval that wins Flower Hill points as less restrictive ignores the context that the only type of housing that is (rapidly) approved is single-family.
- See Luis Ferre-Sadurni and Mihir Zaveri, “A Plan to Force More Housing Development in New York Has Failed,” New York Times, April 21, 2023, https://www.nytimes.com/article/nyc-housing-hochul-long-island-westchester.html.
- Governor Kathy Hochul, “Governor Hochul Announces Statewide Strategy to Address New York’s Housing Crisis and Build 800,000 New Homes,” January 10, 2023, https://www.governor.ny.gov/news/governor-hochul-announces-statewide-strategy-address-new-yorks-housing-crisis-and-build-800000; and Governor Kathy Hochul, “Remarks as Prepared: Governor Hochul Delivers 2023 State of the State,” January 10, 2023, https://www.governor.ny.gov/news/remarks-prepared-governor-hochul-delivers-2023-state-state.
- Luis Ferre-Sadurni and Mihir Zaveri, “A Plan to Force More Housing Development in New York Has Failed,” New York Times, April 21, 2023, https://www.nytimes.com/article/nyc-housing-hochul-long-island-westchester.html.
- Janaki Chadha, “Hochul faces an ‘uprising’ over her plan to build new housing in NYC suburbs,” Politico, February 11, 2023, https://www.politico.com/news/2023/02/11/hochul-faces-uprising-housing-plan-00080949.
- Henry Grabar, “New York Has a YIMBY Governor,” Slate, January 11, 2023, https://slate.com/business/2023/01/kathy-hochul-housing-new-york-zoning.html.
- David Brand and Jon Campbell, “Gov. Hochul’s ambitious housing plan meets suburban blockade,” Gothamist, January 30, 2023, https://gothamist.com/news/gov-hochuls-ambitious-housing-plan-meets-suburban-blockade.
- Janaki Chadha, “Hochul faces an ‘uprising’ over her plan to build new housing in NYC suburbs,” Politico, February 11, 2023, https://www.politico.com/news/2023/02/11/hochul-faces-uprising-housing-plan-00080949.
- MTA Railroads, https://new.mta.info/map/22461.
- “Long Island,” Encyclopedia Britannica, https://www.britannica.com/place/Long-Island-New-York.
- “ERASE Racism Supports Governor Hochul’s Proposed New York Housing Compact,” ERASE Racism, March 14, 2023, https://www.eraseracismny.org/component/content/article/28-press-releases/1037-erase-racism-supports-governor-hochuls-proposed-new-york-housing-compact.
- Phil Ramos, quoted in Luis Ferre-Sadurni and Mihir Zaveri, “A Plan to Force More Housing Development in New York Has Failed,” New York Times, April 21, 2023, https://www.nytimes.com/article/nyc-housing-hochul-long-island-westchester.html.
- In the 2020 presidential election, Joe Biden defeated Donald Trump by 68 percent-31 percent in Westchester County, by 54 percent to 45 percent in Nassau County. The two tied in Suffolk, 49 percent to 49 percent. “New York Presidential Results,” Politico, January 6, 2021. https://www.politico.com/2020-election/results/new-york/
- See Richard D. Kahlenberg, Excluded: How Snob Zoning, NIMBYism, and Class Bias Build the Walls We Don’t See (New York: PublicAffairs Books, 2023), 173–81.
- Teo Armus, “Arlington ends single-family-only zoning: The Northern Virginia county’s ‘missing middle’ plan will allow buildings with four—and in most cases six—units in any neighborhood,” Washington Post, March 22, 2023, https://www.washingtonpost.com/dc-md-va/2023/03/22/arlington-missing-middle-vote-zoning/.
- Luis Ferre-Sadurni and Mihir Zaveri, “A Plan to Force More Housing Development in New York Has Failed,” New York Times, April 21, 2023, https://www.nytimes.com/article/nyc-housing-hochul-long-island-westchester.html.
- Mara Gay, “The Era of Shutting Others Out of New York’s Suburbs Is Ending,” New York Times, February 21, 2023, https://www.nytimes.com/2023/02/21/opinion/housing-new-york-city.html (citing data from the Citizens Budget Commission).
- Luis Ferre-Sadurni and Mihir Zaveri, “A Plan to Force More Housing Development in New York Has Failed,” New York Times, April 21, 2023, https://www.nytimes.com/article/nyc-housing-hochul-long-island-westchester.html.
- “Unequal Resources for Long Island Students Based on Race,” ERASE Racism, May 2022, 1, https://www.eraseracismny.org/storage/documents/Unequal_Resources_for_Long_Island_Students_Based_on_Race_ERASE_Racism_2022_Report.pdf.
- “ERASE Racism Supports Governor Hochul’s Proposed New York Housing Compact,” ERASE Racism, March 14, 2023, https://www.eraseracismny.org/component/content/article/28-press-releases/1037-erase-racism-supports-governor-hochuls-proposed-new-york-housing-compact.
- Amy Stuart Wells, Lauren Fox, and Diana Cordova-Cobo, “How Racially Diverse Schools and Classrooms Can Benefit All Students,” The Century Foundation, February 9, 2016, https://tcf.org/content/report/how-racially-diverse-schools-and-classrooms-can-benefit-all-students/.