
Community colleges are uniquely situated to address a paramount national challenge: reducing economic inequality. Students who complete an associate’s degree have higher rates of employment and significant earnings gains over those with only a high school degree or a general equivalency diploma (GED).1 With 86 percent of high school graduates going on to further postsecondary education and training,2 experts are increasingly emphasizing the central importance of high-quality programs that provide ample support to ensure that a high percentage of entrants graduate and enhance their lives and careers. As institutions that serve all students regardless of background and preparation and are located close to where students live and work, community colleges are pivotal in efforts to reduce economic inequality and restore the American Dream—but can only succeed if they are adequately funded.
“Adequate funding” may not have bumper sticker appeal. But the idea is simple and compelling: To help restore social mobility in America, policymakers must provide community colleges the resources necessary to successfully educate the country’s aspiring middle class.
This report proceeds in four parts. First, it discusses the need to reform funding of community colleges in order to help students succeed. Second, it outlines the current barriers to reform—the lack of research on how much funding community colleges need; the overreliance on tuition dollars and local funding; the haphazard ways in which money is allocated; and the political forces that shape funding decisions. Third, it suggests some reason for optimism: emerging political trends and the existence of alternative models of funding for equity, including K–12 funding formulas in certain states, and higher education funding in countries such as England and Ireland. Fourth, it makes recommendations for a better model of funding community colleges that includes state-level and federal-level reforms. In particular, the report discusses the ways in which proposals for adequately funding community colleges could dovetail with three ongoing trends in higher education: the adoption of state higher education goals, the desire for greater accountability, and the free college movement.
The Need for Reform
Currently, the performance at resource-strapped community colleges is often disappointing.3 As discussed further below, community colleges frequently do a good job of enrolling disadvantaged students—something elite four year colleges often fail to do. “We serve the top 100 percent of students,” notes one community college leader.4 But there is enormous room for growth in the outcomes that colleges are able to help these students achieve. While more than four out of five first-time beginning community college students say they wish to earn at least a bachelor’s degree,5 only about one out of thirteen students transfer and complete this goal within six years;6 moreover, only about a third of students earn even just a certificate or associate’s degree from the community college.7
Among students who go to community college with the eventual goal of getting a bachelor’s degree, studies that carefully control for academic and demographic factors find a substantial “community college penalty”—a reduced chance of earning a bachelor’s degree—if a student begins at a two-year rather than a four-year institution.8 For instance, C. Lockwood Reynolds, an economist now at Kent State University, estimated, after applying appropriate controls, that beginning at a two-year college reduces one’s ultimate chances of receiving a bachelor’s degree by 30 percentage points.9
These results are not surprising, given the resource differentials and the complications of transfer, but they are disappointing. Individuals who are trying to better their lives and move out of poverty into the middle class rely on community colleges, yet these schools frequently are not able to provide students with the support they need and deserve. What is holding back students entering community colleges?
Community Colleges Enroll the Most Disadvantaged Students, Yet Receive the Fewest Resources
The prevailing impulse by policymakers in response to poor results is to impose accountability mechanisms on them. For instance, a number of states have shifted toward systems that fund institutions based in part on student progress. But these approaches are unlikely to be effective unless colleges have the resources necessary to provide quality instruction and support, given the needs of the students who typically enroll. We often hear the mantra that community colleges need to do more with less; but if we truly care about improving the promise and performance of two-year schools, we need to investigate, empirically, the importance of resources rather accepting the current level of funding as optimal.
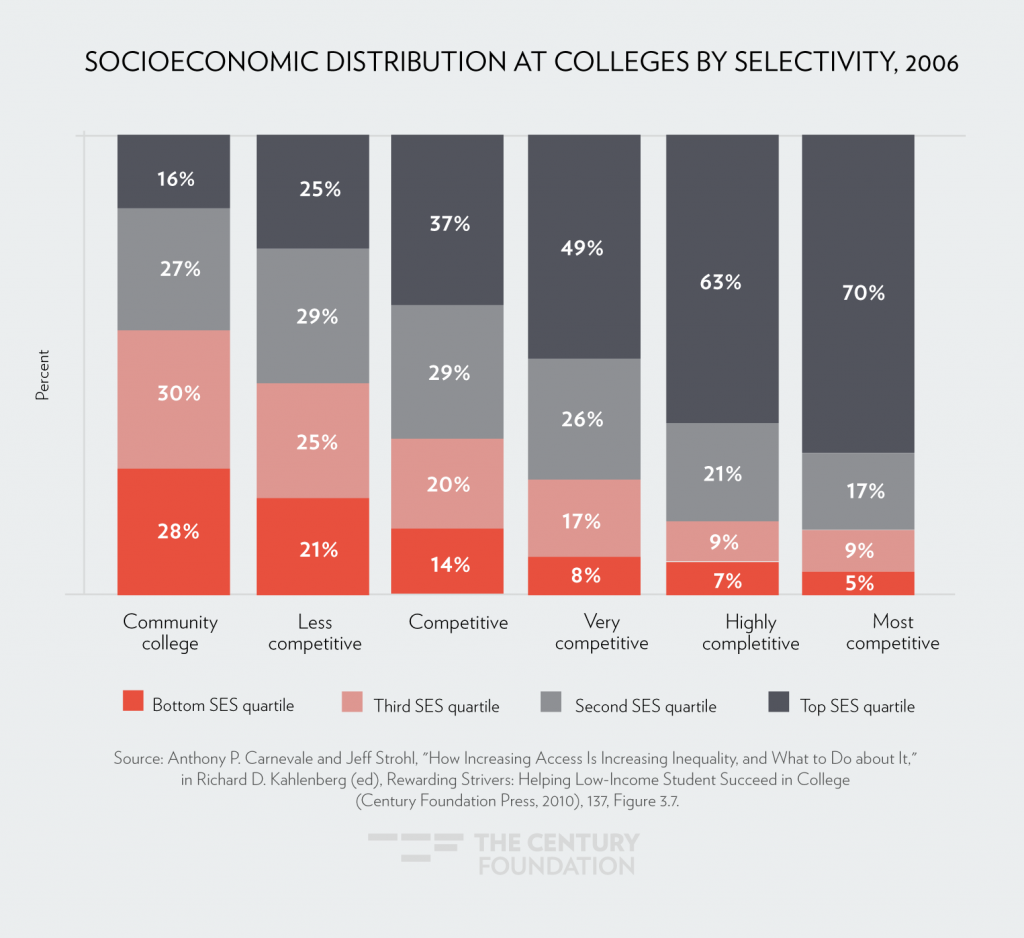
Today, higher education tends to shower the greatest resources on wealthy and high-achieving students with the fewest educational needs, and devotes the fewest resources to economically disadvantaged students with the greatest educational needs.10 At the most selective four-year colleges, students from the wealthiest socioeconomic quartile outnumber those from the poorest quartile by 14 to 1, yet at community colleges disadvantaged students outnumber those from the richest quarter by 2 to 1 (see Figure 1).11
Figure 1
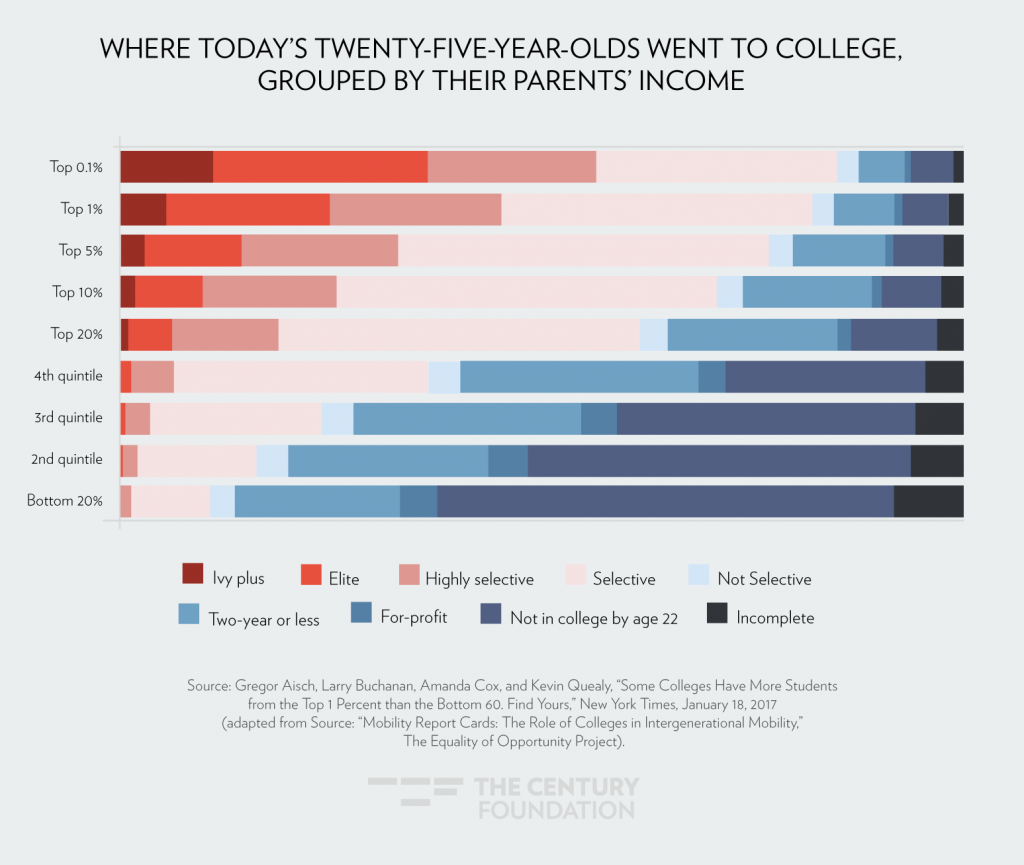
Stanford University professor Raj Chetty and his colleagues found a similar pattern using a more granular set of data that examined where students from various slices of the income distribution attended college. Students from low-income and moderate-income families were much more likely to attend community colleges than students from higher income families (see Figure 2).
Figure 2
Researchers generally agree that disadvantaged students have the greatest challenges attending college—less access to preparation from high-quality K–12 schooling, greater likelihood of food insecurity during college, and the like. Indeed, researchers estimate that wealthy parents invest about $6,600 per year on enrichment activities for their children, nine times the amount ($750) that low-income parents spend.12 Multiplied over eighteen years, that $5,850 annual difference amounts to $105,300. Differential access to K–12 schooling opportunities compound those inequalities.
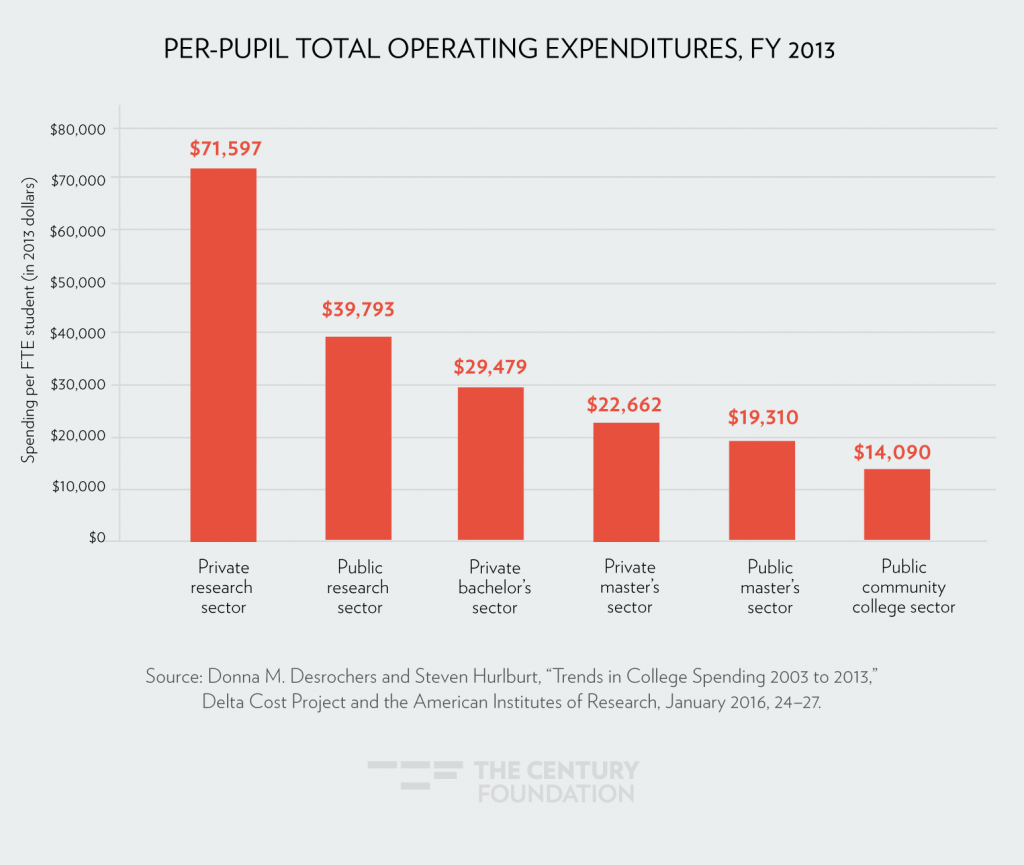
Students who suffer through the inequities of the K–12 education system find that these challenges are exacerbated even further in higher education. As shown in Figure 3, private research universities spend five times as much per student per year ($71,597) as community colleges do ($14,090), and public research universities almost three times as much ($39,783).13
Figure 3
Much of the difference in aggregate spending, of course, is connected to different functions associated with different types of universities and colleges. Research universities are charged not only with educating students, but also with conducting basic research that advances human understanding of the world. But inequalities in per student expenditures persist even when one separates out the research function of universities and focuses exclusively on educational instruction.14 These differences remain substantial after excluding spending on sponsored research and auxiliary enterprises, with private research sectors spending up to three times more than the amount spent by public community colleges in education and related spending.15
Moreover, research by George Washington University’s Sandy Baum and her coauthor Charles Kurose finds that inequalities in spending remain even when one accounts for the common assumption that the first two years of college are less costly than the third and fourth.16
Even more troubling, these disparities in resources are growing. Educational spending per public four-year college student increased by 16 percent between the 2003–04 academic year and 2013–14; by contrast, during this same time period, per student community college funding increased just 4 percent.17
Sometimes, the inequity in public spending is generated by explicit policy. In Maryland, for example, state law imposes unequal funding by requiring that full-time equivalent community college students should be funded at 25 percent the level of students at four-year colleges.18 Moreover, the bottom-line inequality in spending has grown over time. In the period from 2003 to 2013, funding in real terms increased by $5,413 per FTE student at public research universities, while public community colleges saw an increase of just $1,044 in real funding.19
It is important also to note that there is substantial inequality in funding within the two-year sector, in part because community colleges typically receive some local funding, which tends to reflect the wealth of neighborhoods. In a 2006 paper, scholars Alicia C. Dowd and John L. Grant found that the intrastate variation in state and local community college appropriations (as measured by the ratio of the community college appropriation at the ninetieth and tenth percentiles of funding in each state) in half the states studied ranged from 2.0 to 2.8. These levels “are considered high in comparison to K–12 finance inequities,” the authors concluded.20 A 2018 analysis of spending on community colleges by Tammy Kolbe and Bruce Baker, likewise, found “substantial differences in per-FTE spending within states. The extent of variation was on par with levels that have raised alarm bells when evaluating fiscal equity among K–12 school districts.”21
Money—Well Spent—Can Make a Difference in Higher Education and Have Big Payoffs in Economic Growth
To meet the goals of providing equal educational opportunity to students and improving efficiency, we need to examine resource inequities. “Supporting the success of community college students requires much more than adequate funding for the students and their institutions,” as Sandy Baum and Charles Kurose noted in a paper for The Century Foundation. “But without adequate funding, significant progress is unlikely.”22
At the most basic level, evidence suggests that higher state per-pupil appropriations to community colleges do generally correlate with higher completion rates; high-spending states such as Wyoming, Alaska, and North Dakota all have above-average completion rates.23 More importantly, careful research by leading economists suggests that community college funding increases cause improved outcomes. David Deming and Christopher Walters, for example, found in an August 2017 study for the National Bureau of Economic Research examining the impact of postsecondary spending between 1990 and 2013 “positive and statistically significant causal impacts of spending on degree completion.”24 The authors found larger impacts of spending in two-year institutions than four-year institutions.25 An increase in spending in year t resulted in increased awards of certificates and degrees of 14.5 percent in year t + 1 and 14.6 percent in year t + 2.26 It is possible, the authors suggest, that increased spending means increased course offerings, shorter waiting lists, better student guidance, and smaller class sizes.27 So powerful were the results, Deming and Walters suggested that the federal government place more emphasis on providing financial support for higher education institutions rather than efforts to reduce tuition costs through financial aid, because access without support is insufficient to raise attainment.28
In addition, there is evidence that certain investments are particularly likely to pay off:
- Full-time faculty. Much—though not all—relevant research finds that having more full-time faculty on staff leads to improved outcomes for students.29 Yet today, as a way of saving money, community colleges are much more likely to rely on inexpensive adjuncts and other part-time instructors. Only 31 percent of faculty members at public community colleges are full-time, compared with 42 percent at public research universities and 50 percent at private research universities. (Graduate assistants are counted as part-time in this analysis.) 30 Investing in more full-time community college faculty could result in improved outcomes for students.
- Extra tutoring, small class size, intensive advising, and generous financial aid. There is strong evidence that investing in extra tutoring, small class sizes, intensive advising, and generous financial aid at community colleges can have big payoffs. At a typical community college, classes are crowded and student–adviser ratios can be as high as 1,500 to 1. But at the City University of New York’s Accelerated Study in Associate Programs (ASAP), students are provided with the tutoring, class size, advising, and effective financial aid more typical of wealthy four-year colleges. These benefits, provided within a highly structured environment in which students must attend classes full time, have been found by the nonprofit research institute MDRC in a randomized trial to nearly double the three-year graduation rates of students (to 40 percent compared with a control group’s 22 percent).31 The program costs 60 percent more per student—about $16,300 more per pupil over three years—yet by boosting results, it actually reduced the amount spent for each college degree awarded by more than 10 percent.32 More generally, research also finds that investments in smaller class sizes and more counselors in community colleges can improve student outcomes.33
- High-impact practices. The Center for Community College Student Engagement has found a positive relationship between thirteen “high-impact” practices—orientation, accelerated developmental education, first year experiences, student success courses, learning communities, academic goal setting and planning, experiential learning beyond the classroom, tutoring, supplemental instruction, proper assessment and placement, registration before classes start, alerts and interventions, and structured group learning experiences—and positive student outcomes.34 Numerous other studies find positive results from redesigned developmental education, academic support services, and other interventions.35 We mention these examples of productive spending not to suggest that a straightjacket be imposed on community college presidents to spend resources in a particular way, but rather to illustrate that these practice often require increased investments.
Rigorous research on the four-year college sector has also found that resources can have a powerful influence on outcomes for students. John Bound of the University of Michigan, Michael Lovenheim of Cornell, and Sarah Turner of the University of Virginia, for example, found in an important 2010 study that declining completion rates over time were due primarily to declines in resources per student.36
Research evaluating the importance of resources in the K–12 level is also particularly relevant to the community college arena given the similar demographic populations served by the two sectors. In a 2017 analysis, Bruce Baker, after analyzing national and state-specific studies, concluded: “The preponderance of the evidence shows that resources do matter.”37 Likewise, in a February 2018 study of California’s K–12 funding increases, Rucker Johnson of the University of California, Berkeley, and Sean Tanner of WestEd, looking at the effects of the Local Control Funding Formula, “found strongly significant impacts of LCFF-induced increases in district revenue on average high school graduation rates for all children.” In particular, they found that “a $1,000 increase in district per-pupil revenue from the state experienced in grades 10–12 leads to a 5.3 percentage-point increase in high school graduation rates, on average, among all children.”38
A better-funded system of community colleges could have a big payoff for society at large. In 2012, annual average earnings for associate’s degree holders were $12,000 (51 percent) more than for high-school graduates with no college. The present value of those net additional lifetime earnings is $246,000.39 While some believe that it is appropriate to put the cost burden of education primarily on students, because they will reap private gains from education, in fact there is a long line of research suggesting that there are enormous spillover benefits to expanding higher education opportunities for society as a whole. The higher earnings of community college graduates can fuel more economic growth and more tax revenue for states. The present value of lifetime taxes paid by an individual with an associate’s degree is estimated to be $201,341 compared with $136,654 for a high school graduate.40 And people with associate’s degrees reduce state expenditures on public assistance. The poverty rate of an associate’s degree holder (7.7 percent) is half the rate of high school graduates with no college (15.3 percent).41 Associate’s degree holders receive about $22,000 less in lifetime public assistance as high school graduates, in present value terms.42 A 2014 study found that, overall, the benefit to taxpayers of investing in community colleges exceeded the costs by a factor of 2.5 to 1.43
The Current System of Funding Makes All of Higher Education Less Cost Effective
The current approach—inequitable investments in low-income and low-achieving students—creates powerful inefficiencies, in that it leads far too many students to drop out before completion. It simply is inefficient to enroll students in programs that are not adequately supported with institutional resources.44
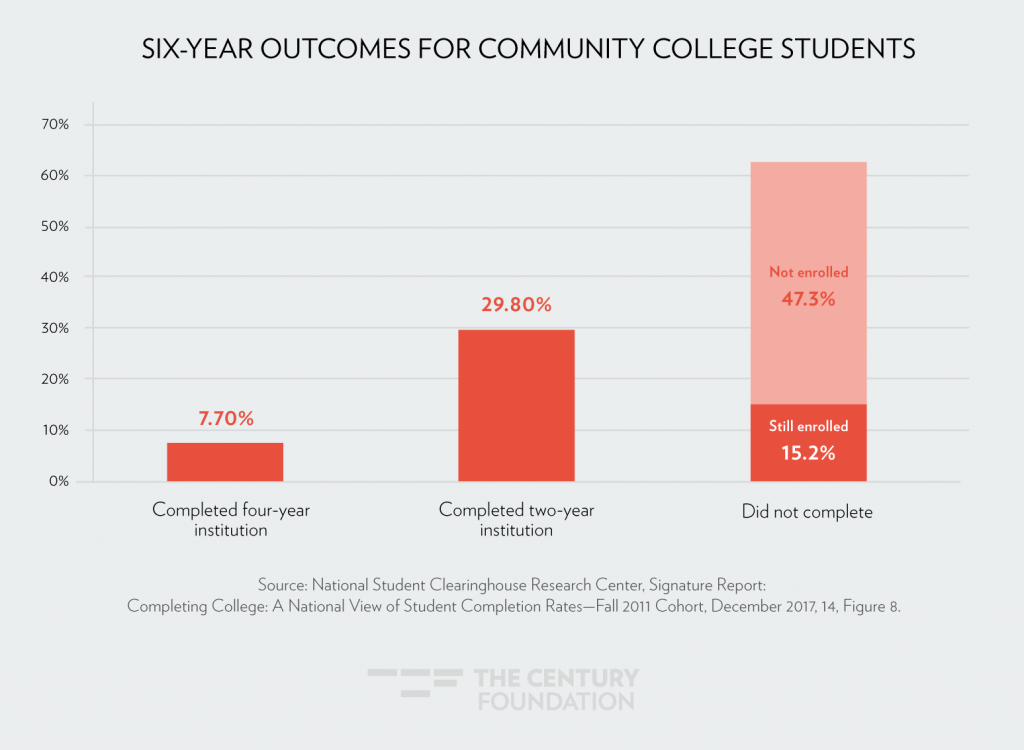
According to research from the National Student Clearinghouse Research Center, the outcomes of students entering community college show that, six years later, only 29.8 percent have completed a two-year degree, and 7.7 percent have completed a four-year degree. In other words, as Figure 4 shows, six years after beginning college, 62.5 percent have not received a degree of any type (15.2 percent are still enrolled, but 47.3 percent are no longer enrolled).45
Figure 4
Granted, there can be valuable learning gained from taking courses without receiving a credential. However, to the extent that enrolling students hope for a benefit in terms of their earning potential, the evidence of wage gains from attending some college without receiving a certificate or degree is mixed.46
The underfunding of the community college sector may also be cost inefficient to the extent that it pushes students toward for-profit colleges and online learning—neither of which has a particularly good track record for students. After a two-year investigation of thirty for-profit companies, the U.S. Senate Committee on Health, Education, Labor, and Pensions reported in 2012 that while community colleges and for-profit two-year programs have similar retention rates, “the cost of the for-profit programs makes those programs riskier for students and Federal taxpayers.” The committee noted: “While 96 percent of those attending a for-profit college borrow to attend, just 13 percent of community college students do so.”47
Furthermore, students who are swayed to enroll at a for-profit rather than a community college may be incurring debt with little to show for it. On average, students attending for-profit programs earn no more than if they had not attended college at all, according to one recent study.48
Likewise, low-income and less prepared students show worse outcomes when enrolling online.49 When community colleges push their students into online classes to save money, retention rates fall.50
Barriers to Reform
Given the considerable evidence suggesting that increased resources could improve outcomes in community colleges, why do inadequate levels of funding persist? Four explanations stand out: (1) scholars have failed to generate sufficient research on the true cost of a high quality community college education; (2) an overreliance on local funding and tuition dollars undercuts resources at open access institutions; (3) state funding is often allocated in a haphazard or poorly designed fashion; and (4) unfortunate political structures support inequitable funding schemes. This section explores each barrier to reform in turn.
Inadequate Research on the True Cost of a High Quality Community College Education
Although there is evidence that additional investment in community colleges could improve completion, equity, and quality, there is inadequate research on the appropriate level of spending necessary to meet those goals. Relatedly, how much more do low-income and ill-prepared students need, compared with other students, to produce acceptable outcomes? The K–12 system—which has greater experience educating disadvantaged students and has higher completion rates than higher education—has a much stronger research basis for answering those questions than does higher education.51
A Century Foundation working group on community college financial resources is thinking through how K–12 costing out analysis might be applied to community colleges. A twenty-one-member group, supported with generous funding from the William T. Grant Foundation, consists of some the nation’s leading researchers in K–12 and higher education funding, as well as experts in higher education policy.52
The working group is wrestling with several key questions: Where do K–12 costing out principles apply to community colleges, and how might they need to be modified? What is the best way to define performance for community colleges? What are the critical ingredients necessary for success? How do we best define which students need more financial support in order to succeed? What are the extra costs associated with institutions that have concentrations of such students? What are the costs associated with different disciplines, different geographic locations, and different college sizes?
To guide the group’s work, The Century Foundation (TCF) commissioned a few reports. In the first, Bruce Baker of Rutgers University and Jesse Levin of the American Institutes of Research tackle the question of how K–12 costing out analysis might apply to community colleges. The report notes the absence of rigorous analyses of what it costs to provide an adequate community college education. It observes that models are widely employed at the K–12 level to conduct such cost analyses. While acknowledging critical differences between higher education and K–12 schooling, it makes recommendations on how K–12 costing methodologies could be adapted to community colleges.53
In the second report, Anthony Carnevale, Jeff Strohl, and Artem Gulish of Georgetown University analyze the appropriate metrics by which to judge community college performance. In order to determine the costs of an adequate community college program, one must first identify clearly defined goals for the program. The authors propose that, in order to be “adequate,” a community college education should not only provide a reasonable likelihood of completion, but also produce skills for gainful employment that allow for the full flourishing of individuals. Specifically, the authors propose a two-part test for economic self-sufficiency: (1) “a program must leave its graduates earning more than $35,000 per year ten years after they have completed it”; and (2) “over that ten-year period, that program also must provide its graduates with a sufficient earnings premium, compared to the earnings of workers with only a high-school diploma, to cover the program’s total cost to the student.”54 These background reports will help inform a set of working group recommendations that outline a framework for conducting a rigorous costing-out study at the community college level.
Barriers to Equity Baked Into the Current Systems Funding Community Colleges
Even if researchers are able to articulate a defensible number for what it costs to provide an adequate education—and for the premium needed to educate disadvantaged students well—three other barriers to equitable funding exist, related to where money comes from, how it is allocated, and the political structures that control the system.
Where the Money Comes From: The Overreliance on Local Funds and Tuition
The funding of community colleges is based on a hybrid model that draws a piece from four-year colleges (with some reliance on tuition dollars) and another piece from K–12 education (with some reliance on local appropriations). In some ways, however, this in-between position results in the worst of all worlds. The reliance on local funds is regressive, since wealthier districts supply more funds to community colleges in rich areas; and the reliance on tuition dollars means the burden of funding education can be shifted from the state to the individual—which is precisely what legislators have done in recent years, as the student population has grown more diverse.
Originally, tuition was not a major source of community college funding. Many of the early community colleges—at the time usually referred to as “junior” colleges—began as extensions of K–12 education systems and followed the K–12 model that is 100 percent funded by state or local appropriations. Under this system, the enrollment of each additional student creates a need for coverage of 100 percent of the marginal institutional costs, either by spreading existing resources over a larger number of students, or by adding more funding. This relationship has shifted over time as the proportion of state and local funding of two-year colleges declined from 64 percent to 52 percent and funding through tuition revenue increased from 22 percent to 33 percent (see Figure 5).
Figure 5
![]()
The shift was facilitated by federal financial aid. Tuition support that was available first from the GI Bill after World War II, and then from federal student aid programs in the 1960s and 1970s, encouraged public institutions to join private colleges in the use of tuition revenue as a way to pay to costs of greater student enrollment. From an institutional standpoint, increasing enrollment without charging tuition would place the added financial burden squarely on the state or local government, while switching to charging tuition would bring in per-student funds from the federal government, at least for some students. The problem with this model is that not all students can afford to pay, as they face not only tuition expenses, but also the costs of housing, food, transportation, books and, frequently, supporting families.
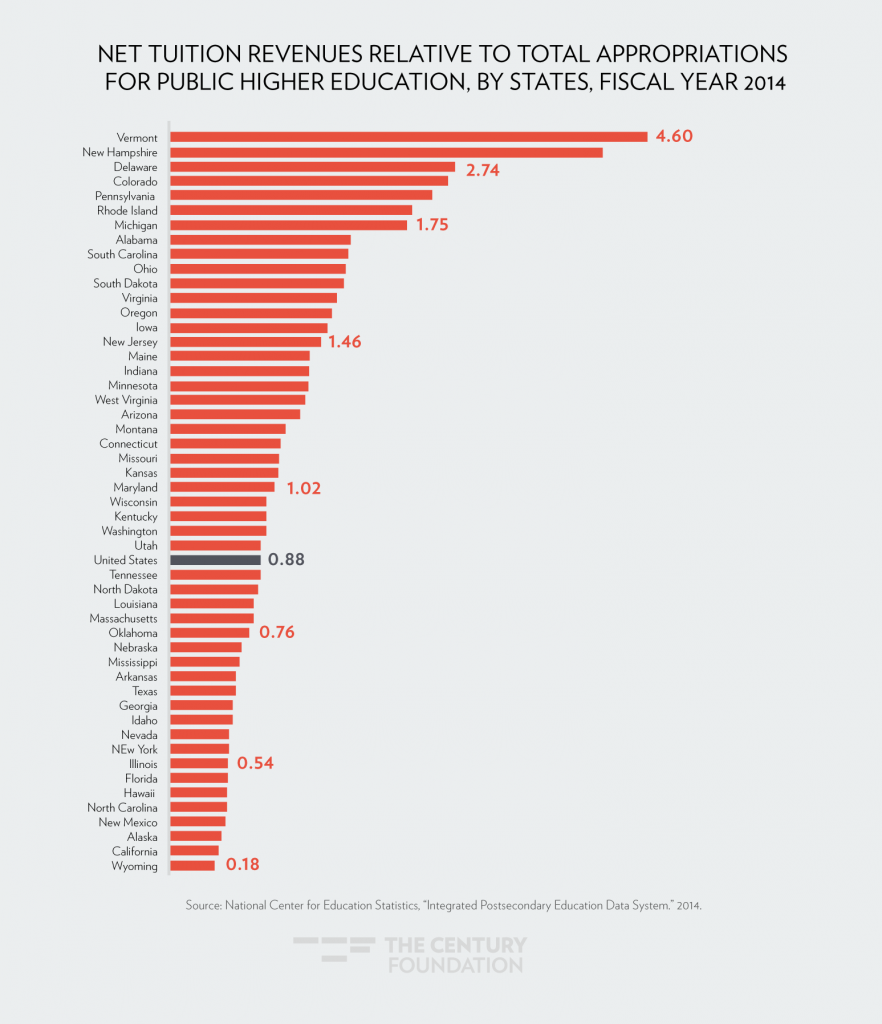
The burden on students to provide tuition dollars for public higher education creates greater hardships in some states than others. The use of tuition charges as a revenue source varies enormously across the states. Some states appropriate four or five times as much as their public institutions receive in net tuition, while in other states it is the opposite: tuition support is two, three, or four times the appropriations.55 (See Figure 6).
Figure 6
On the other hand, there is logic to the idea that charging tuition allows institutions to serve more students. After all, if every student must be fully financed by tax revenue, then a given amount of tax revenue can only finance a certain number of students. A student who pays tuition that at least equals the marginal institutional cost is increasing the capacity of the institution by one. If every student paid half of the cost of running the institution, on average, then twice as many students could be served compared to if there was no tuition.
But the increased reliance on tuition dollars, especially at open access community colleges, is also deeply problematic. Since state lawmakers see tuition as a viable alternative source of revenue for their colleges, when state tax revenues are tight, higher education may appear to be among the least problematic places to reduce state spending. As a result, higher education is frequently among the first areas to suffer cuts when states face budget shortfalls.56
More troubling still, there is evidence that recent disinvestment in public higher education may be related to the growing demographic diversity of the student population. Although conservative complaints about higher education focus on liberalism, Ronald Brownstein of The Atlantic makes the case that the changing demographics of the student body seems a more likely explanation for conservative enthusiasm to cut higher education budgets. There has been a “clear determination . . . to shift the burden from the community collectively to families individually precisely as the student body is reaching historic levels of diversity.”57 As the nation’s population becomes blacker and browner, this challenge may become even more acute.
How Funding Is Allocated: Too Often Haphazardly or Poorly
In theory, state funding of community colleges could compensate for inequities in local funding, but few states fully do so. State funding is often haphazard, sometimes not even based on a formula at all. And, to the extent that states have adopted formulas in recent years, the predominant trend is toward poorly designed performance metrics.
As recently as 2012, there were seventeen states that did not have any set formula that drives funding to the state’s community colleges, according to a study by SRI International.58 Since that study was conducted, a subset of those states have adopted performance-based formulas. The bulk of states that do not have funding formulas typically base the next year’s funding on the prior year’s funding, adjusting it by a percentage across the board. Other non-formula states adjust funding based on legislative priorities.
In the states that do use formulas, most use various measures of enrollment of state residents or so-called performance funding (which has not generally been found to produce better results for students.).59 SRI International did not find any state that allocated formula funds to community colleges specifically for financial aid, though California now has such a program.60
Even in states where there is a formula based on enrollment—so that college can establish a budget and ensure that there is an adequate number of instructors and classroom space—it is usually based on a prior year’s enrollment. In other words, in any particular year, the colleges are not necessarily able to get more money for the school year by enrolling more students; nor are they faced with a budget cut if their enrollment drops from the previous year. The increased or decreased allocation comes in a later year.
When a state decides to make funding available for additional enrollment, it frequently does so as a percentage increase to all of its colleges. While an “equal percentage” may seem like an equitable approach, consider what would happen if it was applied in the K–12 context: budget growth would be unrelated to need, such that shrinking communities would have stable funding for their emptying schools, while communities with population growth would soon have five-year olds without a school nearby to attend. Such a lack of kindergarten access would be obvious and would be addressed, but in higher education, the lack of adequate access spurs little response.
The strong presumption in favor of funding community colleges according to their historical enrollment levels can mean that geographic areas end up being under-served by their community colleges because those colleges are not able to grow commensurate with local needs. A study of California colleges used counts of adults without a college degree as an indicator of need, and found that access was higher by a factor of three or four in some areas of the state compared to others.61 To address inadequate access in particular geographic areas, California revised its formula for allocating “growth” funds so that the formula includes consideration of the number of adults who lack a college degree, are unemployed, or are in poverty, compared to the community college enrollment of the population in the area. Those districts with larger gaps between need and current enrollment are allocated more growth.62
Unfortunate Political Structures that Support Current Inequitable Funding Mechanisms
Current funding levels for community colleges are the result of important political realities that must be recognized. Scaling investments to meet adequate levels of funding for community colleges faces three critical political challenges associated with political power realities, state budget constraints, and declining support for higher education as registered in public opinion research.
First, current institutional funding disparities—both those between four-year universities and community colleges and those between community colleges themselves—result in part from inequitable access to political power.63 State representatives—who are more likely to have attended or sent their children to four-year institutions—may also be more likely to respond to the interests of wealthy donors, who support investments in these schools rather than community colleges.64 While higher education funding should not be a zero-sum game, where two- and four-year institutions compete against one another for limited resources, community colleges must receive the necessary resources to deliver high-quality opportunities to all students.
Second, state policymakers determining community college funding face budget constraints. States slashed their higher education budgets during the Great Recession, but even today, slow revenue growth—which economists attribute to a number of factors, including falling agricultural commodity and energy prices, but also state decisions to enact costly tax cuts and reticence to raise additional revenue streams—poses challenges to meeting adequacy funding goals. A December 2017 report from National Association of State Budget Offices indicates that state budget expenditures saw the lowest year-over-year increase in the post-recession era, with twenty-six states enacting budgets with general spending increases under 2 percent, and fifteen states enacting budget reductions. Even when considering investments that fuel economic growth in the long run, state legislators are often reticent to raise taxes needed to pay for them;65 combined with the fact that most states have balanced budget requirements, it is difficult for states to increase education spending absent a bond initiative or a revenue windfall. Indeed, according to American Association of State Colleges and Universities analysis of state higher education policy issues in 2018, political uncertainty, stagnant state revenue growth, competing state priorities, and upcoming election cycles will be the primary determinants of state higher education policy priorities.66
Finally, public support of and confidence in institutions of higher education have increasingly fallen amongst Republicans and conservatives. According to a 2017 survey by Pew Research Center, 58 percent of Republicans and Republican-leaning independents believe that colleges and universities have a negative effect on the way things are going in the country, while just 36 percent say their effect is positive. Strikingly, Republicans’ attitudes towards college were positive as recently as 2014, when a 54 percent majority of Republicans and Republican-leaners said that colleges were having a positive effect.67 This suggests views may be fluid. Some of this hostility may stem from a belief that, due to rising prices, quality higher education has become an increasingly inaccessible and elitist project.
In some ways, this critique is fair. As noted above, whereas high-socioeconomic-status students outnumber low-socioeconomic-status students at the most competitive four year institutions, the reverse is true in community colleges; that is, society’s resources increasingly are being dedicated to quality higher education for the wealthy only.68 Research also demonstrates that the income gap in degree attainment has widened. According to research by University of Michigan economists Martha J. Bailey and Susan Dynarski, children of wealthy families are six times as likely to graduate from college as those from poor families.69
However, disinvestment in higher education is the wrong reaction to these trends, as it tends to reinforce this inaccessibility rather than alleviate it. Community colleges are often the campuses doing the most to offer diverse options to underserved populations and the working class.
Reasons for Optimism for a Path Forward
Although the current funding system—and the political dynamics underlying it—is deeply troubling, some reasons for optimism exist. This section outlines five areas where political trends give reason for hope that community college funding can be reformed. It also looks to K–12 funding in certain states, and to higher education funding in places such as Ireland and England, as sources of inspiration.
New Positive Political Trends Offer Levers for Change
Several political opportunities are available to elevate the need for adequate funding for community colleges related to workforce development, populism, local control, the free college movement, and even performance funding.
- Workforce development. As noted above, several states—particularly conservative states—that have increased their commitment to higher education have done so (in part) by tying higher education investments to workforce development. Tennessee’s Reconnect program allows adults to access last-dollar scholarships to community colleges. Kentucky used a $100 million bond initiative to distribute funding for targeted workforce development grants, and Arkansas approved limited free community college based on workforce needs. Lifting up community colleges as gateways to workforce opportunities continues to resonate.70
- Populism. Investment in community colleges counters the growing conservative narrative that higher education is elitist by supporting lower-tuition, open access institutions that more likely serve predominantly disadvantaged populations. Community colleges completely bypass the anger directed at elite four-year schools, which are often portrayed as gated communities with very high entrance fees. A 2018 Demos poll found that 85 percent of Americans have a favorable view of community colleges compared with 66 percent who have such a view of private four-year colleges.71 Likewise, a 2018 poll from New America found that 83 percent of Republicans and 81 percent of Democrats say community college is worth the cost. Adam Harris, writing about the poll in The Atlantic, noted “Despite lukewarm feelings about higher education generally, 80 percent of Americans have a positive view of the institution near them—that often means community colleges.”72
- Local control. Unlike four-year institutions, community colleges are geographically dispersed and rooted in myriad communities throughout states. These realities give them political breadth, and also appeal among conservatives, who like the idea of institutions that serve the particular needs of local communities. Likewise, community college graduates are more likely to stay and work near their alma mater than graduates of four-year colleges, who frequently decamp to far flung regions of the country.73
- Connecting to free college. The free community college movement has also gained traction nationally—including in “red” states like Tennessee. Designing those proposals in a way that makes clear that adequacy-level funding is an important pillar presents a viable possibility in some states.74 Similarly and relatedly, even as state budgets have not rebounded with the strength needed to reinvest in education funding at pre-Recession levels, states have started to reverse their per FTE cuts and are putting some (though limited) money back into higher education. In those states, reinvestment conversations could be benchmarked to adequacy funding metrics.
- Performance funding. Finally, there may be a chance to insert the need for adequacy funding into the ongoing, often bipartisan conversations around so-called performance-based funding. There is little evidence that performance-based funding improves performance, and considerable evidence that it can work against needy students and incentivize inefficient gaming of measures.75 But the instinctual political appeal of the concept creates the opportunity for discussions in which the issue of funding adequacy can be a core element. Providing policymakers with evidence about practices that would improve student success, and what those practices cost, opens a door to increased funding whether or not performance becomes part of a funding formula.
Alternative Funding Models that Give Hope for More Equitable Funding of Higher Education
While inadequate funding of community colleges is a longstanding problem, other models—including parts of the U.S. K–12 system of funding, and the funding of higher education in foreign countries such as Ireland and England—offer alternative visions for how U.S. higher education could be financially supported.
U.S. K–12 Education
In thinking through alternative funding systems, the K–12 system is a reasonable model to consider (even acknowledging key differences between the community college and K–12 systems). This suggestion might seem odd at first blush. Top American colleges and universities rank among the best in the world, and higher education is routinely cited as a model for our elementary and secondary schools. But completion rates in higher education are poor: only about half of all full-time students graduate, compared with nine of ten in our K–12 system. Moreover, our K–12 system has much more experience and success educating a broad cross-section of students. In learning how to educate growing numbers of low-income and minority students, higher education could learn much from what has worked to address funding inequalities in our K–12 schools.
To be sure, there are important differences between K–12 and higher education that need to be acknowledged. (See text box.) Having said that, certain funding principles at the K–12 level may apply to the community college sector.
The Differences between K–12 and Higher Education: Who Is Served
The factors that go into a spending-per-student figure in public K–12 education are far simpler than the factors that affect public higher education. In a K–12 system, the number of students who need a seat in a classroom is a given: it is the number of youth in the geographic area covered by the school district. There may be complications over which school a student is assigned to, and some spillage into private schools, but the school district or state is ultimately responsible for finding a seat for, essentially, every person between the ages of about five and about eighteen.
The K–12 education system has an obligation to serve everyone. Postsecondary education is completely different. There is no fixed set of people who must be enrolled, nor a common understanding of what they should be studying or how long they should persist. For community colleges, there is no naturally defined who or what; those are politically determined, and a considerable amount of choice is left to individual students.
How many people enroll in a community college, and who they are, depends on the kinds of courses and programs that are offered, when and where the classes are held, the admissions requirements and procedures, the type of outreach that is done, the pricing and aid models, transportation and parking, and numerous other design factors. Those factors are generally not at play in K–12 enrollment, except in how some of them might affect dropout rates.
Translating the analyses of adequacy in K–12 education into a similar analysis of community college funding is complicated by the lack of an exogenous denominator (who is to be served). Without a consideration of who is and is not enrolling, an analysis could determine that the enrolled students in a particular community are being served phenomenally well, even though the education is available to very few of the people who need it.
Roughly speaking, K–12 public schools receive their funding from three sources: local revenues (45 percent), state revenues (45 percent), and federal revenues (10 percent).76 Local sources tend to reflect the wealth of communities and give rise to large inequalities; but, over time, federal and state sources have sought to ameliorate those inequalities.
Beginning in 1965, Title I of the Elementary and Secondary Education Act began providing “compensatory” funding on the premise that schools with concentrations of poverty deserve greater resources. To discourage local school districts from using federal funds for disadvantaged children to displace what the district might have otherwise spent on such students, the federal government requires that federal funds must supplement rather than supplant local efforts.77
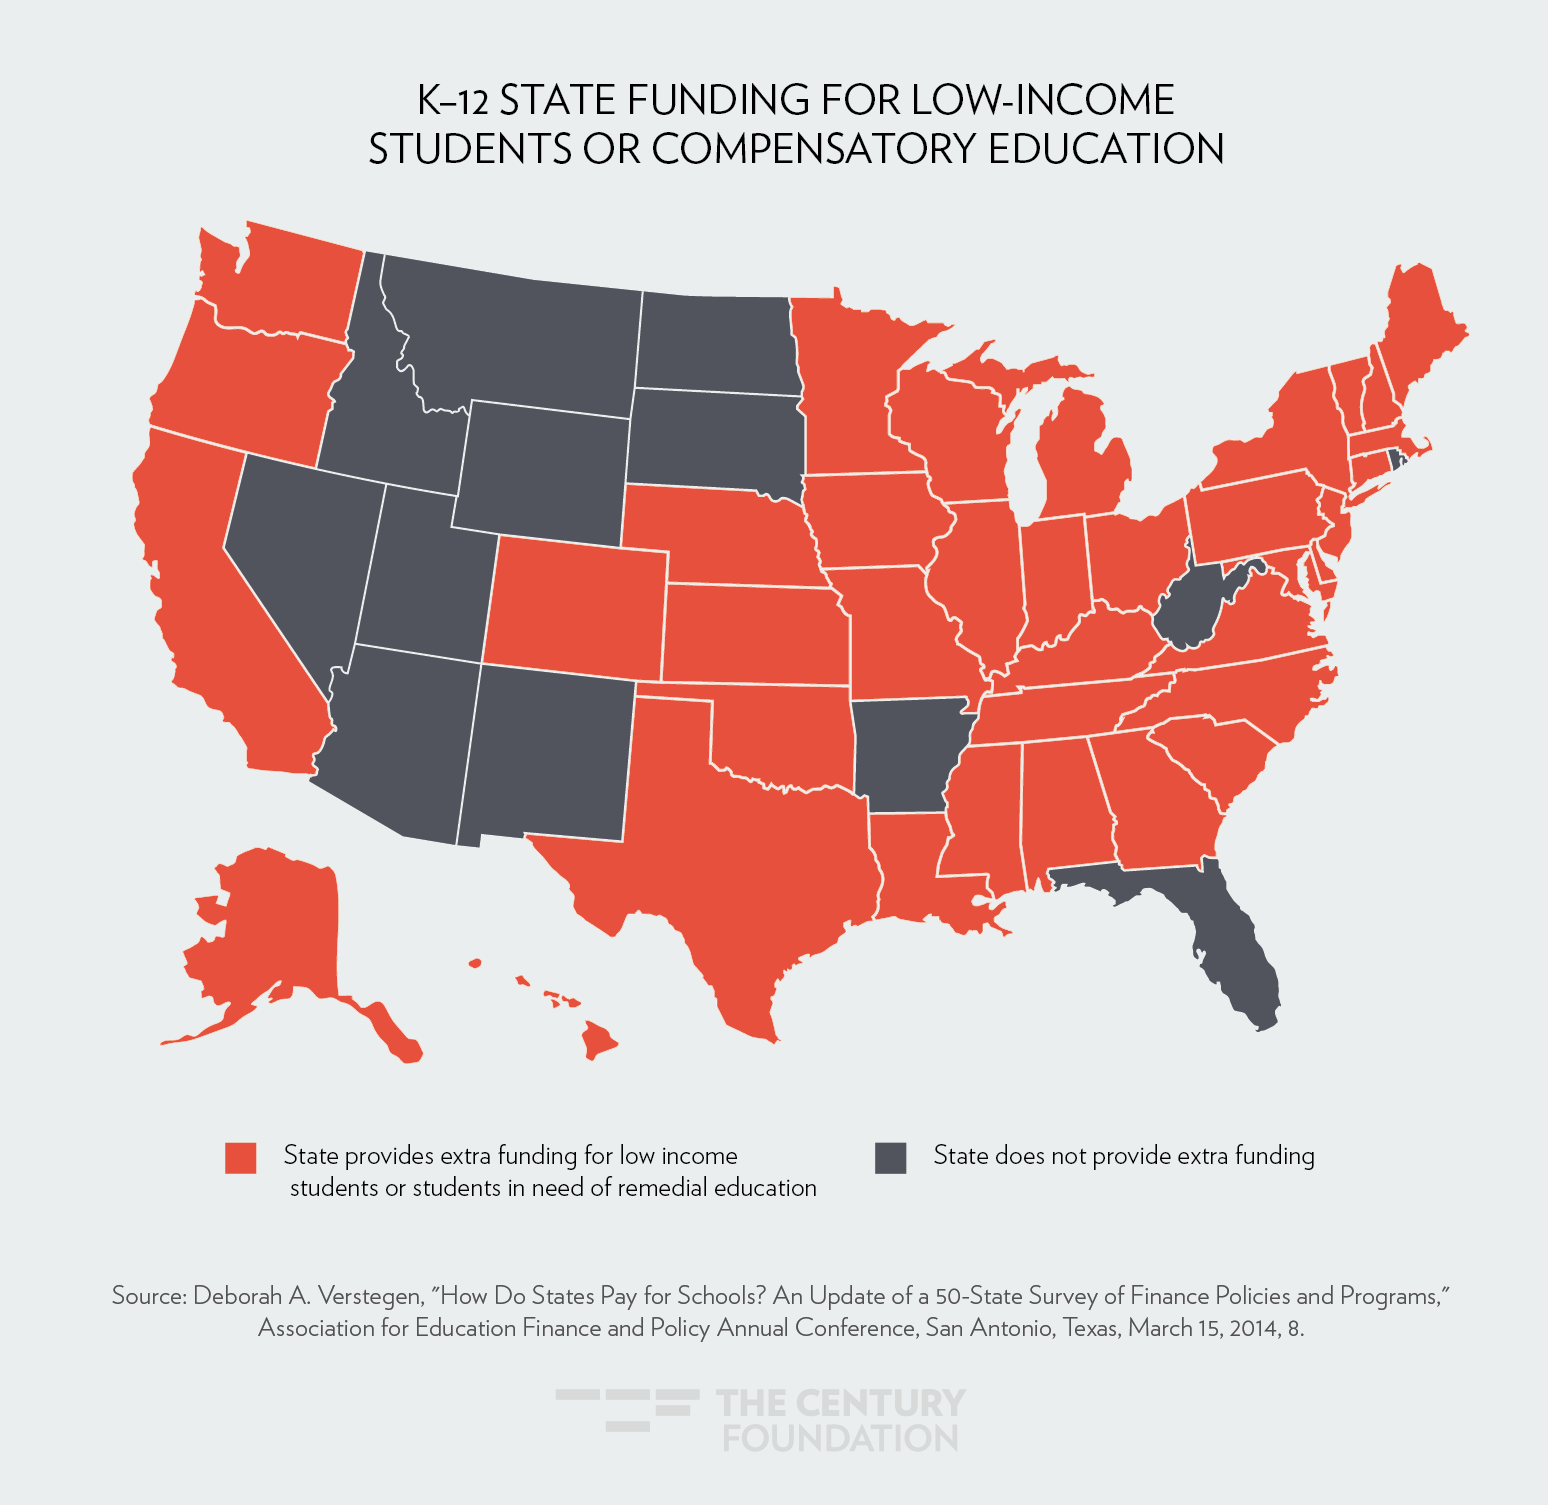
Historically, state K–12 funding has not been particularly progressive, and it remains highly inequitable in many states. But over time, a series of state lawsuits has brought greater progressive change in some states. In the first phase, progressive litigators brought lawsuits to ensure that an equal amount of money be spent on low-income and high-income students. But these cases were soon replaced by a desire for “adequate” funding to reach a particular substantive outcome. These adequacy lawsuits were more far reaching in two respects: (1) they sought not just equal inputs in spending, but a substantive level of educational results for all students (such as numeracy and literacy in order to be good citizens); and (2) they recognized that to reach those results, more money must be devoted to disadvantaged students than to advantaged students.78 Today, at the state level, thirty-seven K–12 funding formulas recognize that students with greater needs deserve greater resources.79 (See Figure 7.)
Figure 7
To establish the appropriate funding premium for low-income students in K–12 education, adequacy studies have been commissioned in several states to cost out the funding necessary to achieve a given result.80 A 2008 review of thirteen studies found that the extra cost of educating socioeconomically disadvantaged students ranged from 22.5 percent to 167.5 percent more than other students with no needs that would require additional educational supports, such as being designated as an English learner, identified as eligible for special education services, and the like.81 In a 2015 analysis, the Education Trust said a 40 percent premium should be considered “conservative,” given some research finding that it costs twice as much to educate low-income students to the same standards as more-affluent students.82 Although many inequities remain in our K–12 system of funding, when federal and state and local resources are considered, high-poverty districts spent an equal or greater amount on students than wealthier districts in forty-five states in 2012.83
None of this is to suggest we should celebrate “mission accomplished” on K–12 funding equity. But a few states—such as New Jersey and Massachusetts—can be considered models.84
To be sure, there are myriad differences between K–12 and higher education, which Baker and Levin’s paper acknowledge. To begin with, in higher education, the costing-out process is more complicated than in K–12 because the goalposts vary by institution. Whereas public primary and secondary education institutions within a state have similarly defined expectations and goals for all students, often measured by standardized test scores and graduation requirements, higher education goals are more varied, and measures of success are less firmly established. At certain community colleges, the main goal is to educate students to master a technical skill in order to become certified in a trade. Other community colleges focus on associate’s degrees and transfer to four-year institutions. Similarly, four-year liberal arts colleges have different goals than research universities. To complicate matters further, different degree programs within institutions that generate different types of degrees have different cost structures—science instruction with expensive labs and lower class sizes, for example, may be more costly than instruction in history.
Nevertheless, as Baker and Levin’s paper demonstrates, it is possible to derive reasonable estimates of costs associated with the instructional goals at a given type of institution (in our case, community colleges). States have already been grappling with these questions as they employ so-called outcome-based higher education funding, meaning they provide some portion of funding based on student outcomes.85 As part of this process, states have necessarily devised standards of success that offer benchmarks to which higher education “adequacy” funding can be tied. Better research is needed to inform these policies.
International Models of Funding for Higher Education
Some international models attempt to incentivize matriculation of nontraditional and low-income students through funding counsels. The countries that employ these models typically have more centralized funding than U.S.-based higher education institutions, and place the responsibility of higher education funding more on the public than on the individual (though they have been shifting toward the latter recently). In particular, the categories of need identified in Ireland’s and England’s funding schemes can provide valuable insights into potential U.S. funding models, as well as both systems’ acknowledgement that serving higher levels of need necessitates greater resources.
Ireland: Funding Using “Access Weighting”
In Ireland, national policy priorities include widening access to institutions of higher education, enhancing performance outcomes, and providing greater flexibility in provision. One method to achieve these objectives—particularly the goal of increased access—is weighting public investments in higher education toward institutions that serve those from lower socioeconomic backgrounds and underrepresented minorities.86
Ireland frames this funding policy as necessary to achieve its clearly stated goals. The nation is seeking a 72 percent higher education participation target by 2020, which will require significant increases in participation of underrepresented groups. (According to national benchmarks, all socioeconomic groups should have entry rates of at least 54 percent by this date as well.)87
The Higher Education Authority (HEA) identifies “access students”—those populations targeted by the National Access Plan’s funding scheme—as learners falling into three categories: (1) mature students, defined as those aged twenty-three and older prior to first undergraduate entry; (2) students with disabilities; and (3) students from working-class backgrounds. In addition, Ireland is tracking data on students from specific minority ethnic and cultural backgrounds, though specific targets do not apply to these groups.
In September 2004, the OECD National Review of Higher Education in Ireland highlighted the need for the HEA to acknowledge within its funding formula “the additional costs of recruiting and retaining students from disadvantaged backgrounds.” The HEA responded with a funding model that included a 33 percent bump in the weighting provided to institutions per “access” student from a target population. However, institutions receiving those additional resources have the flexibility to use them for activities beyond the access office, including but not limited to teaching and research.
Ireland is currently evaluating the effectiveness of its access weighting model, but early determinations have been generally positive. The already high tertiary education attainment rate among individuals ages thirty through thirty-four grew from an initial 27.5 percent in 2000 to 52.3 percent in 2015. All groups in Irish society have experienced increased levels of higher education participation and attainment, including students considered socioeconomically disadvantaged, students with disabilities, and nontraditionally aged students.
Having said that, when providing feedback, some universities and institutes of technology suggested that the scheme failed to sufficiently focus on pre-entry access support for schools and communities, and some schools questioned whether the 33 premium given to an access student is an adequate reflection of the additional costs to support that student. Some respondents also called for better application of access weightings to part-time students.88
England: Funding Premium for Students in Low-Income Postal Codes
England maintains a similar commitment to bolstering access and retention through institutional funding schemes.89 In 2016–17, England allocated participation access funding to recognize the additional costs of supporting students in three areas: (1) students from disadvantaged backgrounds, (2) students with disabilities, and (3) those students for whom retention might be a concern. These funds are allocated to institutions rather than to students, categorized within funds for teaching.90 As in Ireland, schools in England maintain a great deal of autonomy regarding how they choose to spend any additional funds received.
To inform teaching grant allocations, the Higher Education Funding Council for England (HEFCE) uses the Higher Education Statistics Agency (HESA) individualized student record in concert with the Higher Education Students Early Statistics survey (HESES). Together, along with supplemental but equivalent data returns on full economic costs (FECs), these sources provide data on the number of students per institution, their aggregated academic activity (full-time or part-time and program choice), and student characteristics that could be used to determine targeted allocations.
One such target program is the National Collaborative Outreach Programme (NCOP), a new geographically focused, national scheme distributed to twenty-nine local consortia. NCOP targets locales where students have the qualifications and potential to succeed in higher education, but where entry rates remain very low. This program aligns with national goals to double the proportion of disadvantaged young people entering higher education between 2009 and 2020, and raise the number of students from black and minority ethnic communities studying in higher education by 20 percent by that same date.91 The HEFCE recognizes that “some students need more support than others to see their courses through to completion, because of factors to do with their background or circumstances.”
The HEFCE was dismantled in March 2018; however, evaluators continue to study many of its initiatives. Overall, young student participation rates in England have risen since the 1990s, with most of the increase—six percentage points—occurring since the mid-2000s. Large differences in participation rates of advantaged and disadvantaged young people remain, with the gap suspended at around forty percentage points. However, both advantaged and disadvantaged areas saw sizable participation increases of +16 percent and +52 percent, respectively. While not all of this growth can be directly attributed to postal code weighting, HEFCE believes that it was a factor in this progress.92
Proposal for a Better Model
What is to be done? Building on lessons learned from the adoption of equitable K–12 funding mechanisms in certain states and from higher education funding models used in some other countries, we recommend changes at both the state and federal levels. In short, this section recommends that:
- states use research to tie funding directly to the accomplishment of specific state education goals;
- states adopt a bargain by which increased funding is connected to smart accountability schemes;
- states couple new free college initiatives with commitments to ensure that the community college education being provided is adequately funded to provide high-quality opportunities; and
- the federal government forge a new partnership with states in which states that commit to providing adequate community college funding will receive matching federal grants.
State-Based Strategies
In states, we advocate a strategy for investing appropriate funds into community college educations to benefit all students, and especially those who are disadvantaged. Our key aim is to provide the resources that these students need and deserve to succeed. We begin with the premise that we want to achieve two objectives:
- Improve college access. Community colleges should provide opportunities for entry to students from all backgrounds to the types of programs they would like to pursue in the geographic areas in which students are located; and
- Improve college quality to support success. Community colleges should provide opportunities for success in these programs and regions, with a recognition that vulnerable students will need more, not fewer, resources in order to be successful.
We believe a funding formula that recognizes student needs is critical. In some respects, California’s new Student Focused Funding Formula, adopted in 2018, represents an important model. For the 2018–19 school year, 70 percent of funding is based on overall enrollment, 20 percent is based on how many low-income and first-generation students are enrolled, and 10 percent is for rewarding student success. By 2020–21, the ratios evolve to 60–20–20. The student success portion of the formula (which looks at course completion, degrees and certificates awarded, and attaining a regional living wage) includes an equity component which provides a bonus for community colleges which succeed with low-income and first-generation students.93
In order to reach the objectives of college access and quality to support success, we think it may be possible to harness three existing trends in higher education if—and only if—policies are implemented with a focus on equity:
- Setting state goals. Many scholars have noted that K–12 reform—and investment of resources—accelerated when states began to articulate clearly defined goals and standards. State litigation for “adequate” spending, for example, faced a dilemma because courts would be reluctant to establish by themselves standards of what students should know and be able to do. But once states began defining the standards, litigants could point to those state-established standards as a benchmark against which spending could be judged to be adequate or inadequate.94Ireland’s system of higher education, which is weighted in favor of institutions serving disadvantaged students and sets clear goals as part of its National Plan for Equity of Access, provides a model for this.95 Forty-one states have created goals to increase educational attainment, according to the Lumina Foundation.96 How can the existence of state goals, or the setting of further state goals, be shaped to promote adequate resources for community colleges?
- Pursuing accountability. Many states have tied funding to accountability schemes. One of the most popular strategies is to fund colleges by “performance” or “outcomes,” a policy that we believe has a mixed and as yet unproven track record.97 The question becomes: Is there way to design an accountability system that could actually result in greater equity?
- Providing free college. According to Century Foundation senior fellow Jen Mishory, nineteen states have adopted statewide College Promise programs that provide free or debt-free tuition to at least a substantial subset of students. Ten of these programs have been enacted and funded since 2014.98 As Mishory and others have noted, there are pros and cons to such programs.99 How can this movement be harnessed to also ensure adequate funding for community colleges?
Setting State Goals—and Supporting Them with Resources
The vast majority of states have set state goals. Adopting goals is an important first step, but simply setting them does not, in and of itself, guarantee adequate and equitable funding will follow. Some states have adopted goals around increased attainment, only to face budget shortfalls that led directly to cuts in higher education funding.100 Without committing the resources necessary to reach the goals set, we see problems with meeting those goals.101 Strong leadership must accompany any goals to ensure that colleges are provided the resources necessary to attain the goals articulated.
It is also important that these goals be constructed in the right way to serve as a catalyst for productive and equitable reforms. In particular, we recommend three ways that state goals can promote the goal of equity and adequate resources:
- The strongest types of goals are those that set objectives for the entire state population—for example, 60 percent of state residents should have a postsecondary degree or credential—as opposed to ones that seek to have a certain completion rate for colleges (which might encourage institutions of higher education simply to cherry-pick the most advantaged students whose chances of completion, on average, are higher than those from economically disadvantaged families).
- State goals that aim for a certain number of credentials need some form of check to ensure that credentials are meaningful. To guard against grade and credential inflation, states might consider labor market outcomes as one measure of whether credentials earned are worthwhile.102
- To reduce the chances that racial, ethnic, or economic subgroups of students are left behind, state goals (and accountability schemes) should disaggregate data by race, ethnicity, and economic status. This type of approach has been employed at the K–12 level, and there is broad agreement among liberals and conservatives alike that disaggregated data is an important first step for reducing inequity. So too, in higher education, the Lumina Foundation has emphasized that in order to reach larger attainment goals, “we must close gaps by race, ethnicity, income, and immigration status.”103
If done right, we think setting concrete goals for what community colleges can do for a state has the potential to help explain to the public and public officials why they need to invest, and invest equitably. If voters and policymakers only hear that community colleges want more funding, they won’t have a clear idea of the benefits to be gained. The goals should articulate an animating vision for the state that might include projections around the standard of living that residents could achieve under a vibrant system of well-funded community colleges. If, for example, a plan to fund community colleges adequately is expected to increase the total number of students completing by 40,000 individuals, researchers can project the concrete economic benefits to the state.
The goals should also make plain to state voters why equity in funding is paramount. Every state should want to improve performance across the economic distribution of students, but the reality in most states is that the biggest gains are possible among disadvantaged students, for two reasons. First, because of opportunity gaps, disadvantaged students have the most potential to dramatically increase success rates. Second, in many states, disadvantaged students and students of color represent a growing share of the population.
Pursuing Accountability—in Return for a Greater Investment in Equity
Accountability and investment are two sides of the same coin. Accountability schemes are unlikely to produce results when institutions are starved for funds. Conversely, a stronger case can be made for a major investment in education if skepticism about “throwing more money” at schools can be addressed with some type of accountability provisions.104 Even deep-blue California policymakers, who recently decided to provide extra funding for community colleges with concentrations of disadvantaged students, included accountability measures in its new law.105
On one level, accountability is meant to be inherent in the process of defining adequate funding. Costing-out research determining a minimally adequate funding level already has accountability baked into its formula because the model is designed to produce a financial level at which a given result can be achieved through the most efficient means. Still this does not obviate the need for policy mechanisms to hold institutions accountable.
But there are good ways to promote accountability, and there are bad ways. As outlined above, we are largely skeptical of the use of performance-based funding and prefer models that are enrollment-based, equity-focused, and use authentic forms of accountability that are driven by human judgement, not mechanical formulas. The biggest critique we have of performance-based funding is that, without first providing community colleges with a base level of adequate funding, it makes little sense to punish “poorly performing” institutions by further starving them (and their students) of resources. It is students who are ultimately hurt when funding to an institution is cut. As long as community colleges are located in specific locations serving nearby populations, their future funding—which determines the number of people they can serve based on any assumption of class sizes—needs to be based largely on enrollment and on the needs of the area. Even community college funding formulas such as Tennessee’s that do not use enrollment per se are using multiple factors that are all correlated with enrollment.
We recognize, however, that enrollment-based funding by itself does nothing to ensure that the people who are most in need are being enrolled. Further, enrollment-based funding, in light of low graduation or transfer rates, invites suspicions, valid or not, that faculty or institutions are not adequately focused on helping students succeed in earning a credential, transferring, or getting a job.
For a state considering its method of funding colleges, the right approach would focus, first, on access—meaning creating programs that successfully attract enrollment by the populations most in need, equitably distributed throughout the state. Second, the state would need to fund each of its schools for performance, meaning that each school needs to be able to spend enough to provide the instruction and support—including financial aid for living expenses, if needed—given its students’ academic needs and financial position, and given local costs. Accountability should be assured with dashboards of quantitative measures, but also allow for flexibility to consider the context in which each college operates. We believe accountability mechanisms should include a critical role for human judgement rather than mechanical formulas.
We recognize that in many states, the rhetoric of performance-based funding is deeply entrenched. One way to satisfy that is for states to require system leaders to use outcome measures in the management of institutions: for funding, in reviewing the contracts of college presidents, in reporting requirements. The creation of performance review boards of outside experts could be used to work against fears of self-protection and insularity. We also think that schemes where institutions compete against their own past performance—rather than against other institutions—are more reasonable. Finally, to the extent that “performance based” provisions are included in funding formulas, guardrails should be included to ensure that they actually result in more disadvantaged students being provided greater support. The Center for American Progress, for example, has suggested that any benchmarks for performance that look at graduation rates and labor market outcomes should be “tailored to [an institution’s] resources and student demographics.”106
Providing Free College—but Ensuring Quality Is Central to the Movement
Alongside the creation of state goals for higher education and the implementation of accountability mechanism, a third major trend in state higher education policy involves the provision of “free” community college.
Whatever one’s position on free college, from a political and policy perspective, there are two important points in implementing such programs: more resources are needed to cover the influx of students just to maintain current levels of support; and even greater resources are needed to improve quality, thereby rendering the investment in free college a wise one.
First, by providing free tuition, demand for enrollment is likely to grow, so if the intent is to enroll more students, resources must be provided not only to cover tuition, but also to cover the total cost of educating a growing number of students. Without additional funding, the quality of education provided will deteriorate.
Second, given evidence that current levels of funding are inadequate, the new investment in community colleges not only will have to prevent backsliding, but also should enhance per-pupil funding to make the most of the new public investment in making college free. To get the most bang for the buck, policymakers should ensure that these program are not only free but have the resources necessary to enable students to succeed.
High quality education is something that many of the early proponents of free college insisted upon.107 In this sense, the free college movement could create an important opportunity. If free college gets more students in the door, it becomes important to policymakers and the public to ensure that this growing population of students is well served, so that the new investment by the state reaps rewards. Providing free tuition to a community college that is inadequately funded and provides few returns for students would be a poor investment.
As many proponents of free college have suggested, the goal must be not only that tuition is free to students, but that funding is provided for supports to increase the likelihood of student success.108 For example, a student who is homeless, or hungry, or has no child care support for offspring he or she has, is much less likely to succeed in college.109 (30 percent of community college students have dependent children.)110 Just as policymakers have long recognized that certain K–12 pupils need publicly supported transportation to get to school and free breakfast and lunch while on campus, policymakers need to acknowledge that community colleges, as an extension of elementary and secondary public education, need to grapple with providing critical supports to particularly needy individuals. Americans understand this reality. A 2018 Demos poll found that six in ten Americans agree that full-time public college students who work part-time should not have to go into debt to pay for “books, groceries, transportation, and rent.”111
In a joint statement, Complete College America, the College Promise Campaign, and Achieving the Dream suggested college and states deliver a “Promise with a Purpose.” College promise programs are “empty” if “newly accepted students don’t go on to complete their chosen credential,” the groups suggested. In order to be built for completion, students need, among other things, “proactive advising” and “financial affordability supports.”112
A Federal-State Partnership
A new federal-state partnership should be created to provide community colleges the resources they need. The federal government has a long history of supporting federal–state partnerships in higher education, going back to the 1862 Morrill Act establishing land grant colleges. Under the subsequent 1890 Morrill Act, which established eighteen land-grant institutions for African Americans, the federal government committed to funding as long as states matched the federal contribution dollar for dollar.113 Federal–state partnerships are common in a variety of fields, such as unemployment insurance, health care, and K–12 education.114
In recent years, a number of think tanks and public policy research organizations have suggested creating federal–state partnerships in higher education.115 In 2015, the Obama administration offered an intriguing proposal in which the federal government would cover three-quarters of the cost of a community college education, with states required to provide the remaining quarter in order for its residents to qualify. The program did not move forward in the Republican-controlled Congress.116
A new federal–state partnership for community colleges deserves another look, for two reasons. First, the federal government can be an important source of new funding for community colleges. As long as states are constrained to what is seen as a zero-sum game within the realm of education (with four-year colleges, community colleges and K–12 schools competing for their share of a small pie of state resources), the politics of boosting community college funding are challenging. A new influx of federal funds could create a very different political environment.
Second, a matching funds program in which the federal government provides new dollars only if states agree to increase their own investments can provide a strong incentive for states to commit new resources necessary to support community colleges. In the K–12 arena, federal funding under the Elementary and Secondary Education Act has provided a modest amount of revenue but has given federal policy makers considerable leverage in encouraging states to enact a variety of forward-looking policies.
Federal–state partnerships in the health care sphere are also instructive. Medicaid is a voluntary program that all states eventually adopted because of the federal matching funds made available. Likewise, the expansion of Medicaid funding, most recently under the Affordable Care Act (ACA), is encouraging in some (though not all) respects. While it is true that many conservative governors turned down federal dollars under the ACA, it is notable that a number of moderate and conservative governors agreed to take federal money, even though doing so required a modest expansion of state investments. Among the “red” and “purple” states that have adopted Medicaid expansion are Alaska, Arizona, Arkansas, Indiana, Kentucky, Louisiana, Montana, North Dakota, Ohio, and West Virginia. All told, thirty-three states (including Washington, D.C.) have adopted Medicaid expansion programs even though twenty-six states have Republican control of the executive and legislative branches.117
In some ways, a matching funding program for community colleges could be even more attractive to state legislators and governors than Medicaid funding. One key difference, of course, is that because Medicaid is an entitlement program whose budgetary commitments are open-ended, community college funding can be more easily circumscribed and involves a more predictable set of financial commitments. In addition, community college educations are not means-tested in the way that Medicaid is, so states may experience relatively greater political pressure from middle-class constituencies to sign onto a federal–state partnership that supports two-year institutions than to those supporting Medicaid. Finally, states have comparatively stronger reasons to invest in higher education to keep talented students in-state and avoid a “brain drain,” whereas the same pressure to retain low-income families using Medicaid within state boarders does not exist.118
We think that, in the right political environment, a federal–state partnership could be attractive to federal policymakers. Many have grown frustrated that in years past, the federal government has substantially increased funding for the Pell Grant program, only to see state public institutions increase tuition as state governments withdraw resources. Federal financial aid expenditures tripled from $50 billion to over $150 between 1995 and 2015 in constant 2015 dollars, while state appropriations per full time equivalent student fell in inflation-adjusted dollars by 28 percent.119 A matching funds program would assure federal policymakers that states would do their part as well.
Conclusion
Any effort to devise a new and fairer system to provide adequate funding for community colleges faces an uphill battle, since the existing allocation of resources is to some degree the result of longstanding political power dynamics. Many state legislators direct public resources toward four-year institutions, similar to the ones they themselves attended, or their children or grandchildren attend. So long as higher education funding is seen as a zero sum game, four-year and two-year institutions will fight over the crumbs and community colleges will struggle.
But against those daunting odds are some reasons for optimism. To begin with, if researchers are able to ultimately apply K–12 costing out strategies to higher education, community colleges will have, for the first time, a strong research base upon which to build the case for adequate resources. This new research will supplement a wide body of scholarship suggesting that certain types of investments in community colleges pay off, and that the economic benefits of success for the broader society are powerful.120
In addition, many observers have begun to acknowledge that underinvesting in community colleges is foolish, and that a greater investment, well spent, can lead to significant economic growth. There is also growing recognition across the political aisle that, in today’s economy, much of our workforce needs the thirteenth and fourteenth years of schooling for labor market success.
The populist mood in the country, on both left and right, could also play to the benefit of community colleges. The push for free community college makes no sense, for example, unless the quality of community college is high. And many conservatives are increasingly alienated from four-year institutions, which they regard as out of touch, and could rally around community colleges, which focus on technical, workplace-oriented education that recognizes that all work has dignity.
These populist movements can take advantage of political strengths that two-year institutions have always enjoyed but have not fully tapped into. Community colleges are located in many more state legislative districts than four-year institutions, and could build strong alliances between businesses that employ community college graduates, civil rights groups, and unions.
Moreover, if some progress can be made on community college funding, a virtuous cycle could ensue. If community colleges can be better funded, they will become academically stronger, thereby attracting more middle-class students. This development, in turn, will strengthen the political capital of these institutions.121
Likewise, success at the state and local level could give rise to a new federal matching program to encourage states to invest in adequate community college funding. An infusion of new federal funds, in turn, could help reduce the fighting between four-year and two-year institutions over scarce state resources.
Armed with new information on what level of funding is required to meet our goals, state and federal legislators may finally realize that the old ways of doing business will no longer suffice.
Notes
- Tom Hilliard, “Mobility Makers,” Center for an Urban Future, November, 2011, 4, https://nycfuture.org/pdf/Mobility_Makers.pdf.
- James Rosenbaum, Caitlin Ahearn, Kelly Becker and Janet Rosenbaum, The New Forgotten Half and Research Directions to Support Them (New York: William T. Grant Foundation, 2015).
- We use the term “performance” rather than “outcomes” because overall performance includes how well a community college recruits students as well as how well students are served once enrolled. Performance better captures the fact that community colleges do not have a captive clientele in the same way that K–12 schools do. For an adult to decide to enroll at a community college requires the college to cater to the interests and needs of that adult, a task that can be particularly challenging with disadvantaged populations. Performance also includes students making progress toward their goals and society’s goals, marked by earned credentials.
- Nick Anderson, “‘We serve the top 100 percent’: California community college chief responds to Trump,” Washington Post, February 16, 2018 (quoting Eloy Ortiz Oakley, chancellor of the California community college system), https://www.washingtonpost.com/news/grade-point/wp/2018/02/16/we-serve-the-top-100-percent-california-community-college-chief-responds-to-trump/?noredirect=on&utm_term=.12854ad991a9.
- 81.4 percent, to be precise. Laura Horn and Paul Skomsvold, Community College Student Outcomes 1994–2009 (Washington, D.C.: U.S. Department of Education, Institute of Education Sciences and National Center for Education Statistics, November 2011), Table 1 (2003–04 cohort).
- 13.4 percent. D. Shapiro, A. Dundar , F. Huie, P.K. Wakhungu, X. Yuan, A. Nathan, and Y. Hwang, Tracking Transfer: Measures of Effectiveness in Helping Community College Students to Complete Bachelor’s Degrees, Signature Report No. 13 (Herndon, VA: National Student Clearinghouse Research Center, September 2017), Figure 4.
- National Student Clearinghouse Research Center, “Signature Report: Completing College: A National View of Student Completion Rates—Fall 2011 Cohort,” December, 2017. Some estimates are more optimistic. See Kevin Carey, “Revised Data Shows Community Colleges Have Been Underappreciated,” New York Times, October 31, 2017, https://www.nytimes.com/2017/10/31/upshot/revised-data-shows-community-colleges-have-been-underappreciated.html.
- Century Foundation Task Force on Preventing Community Colleges from Becoming Separate and Unequal, Bridging the Higher Education Divide: Strengthening Community Colleges and Restoring the American Dream (New York: Century Foundation Press, 2013), 31–32.
- C. Lockwood Reynolds, “Where to Attend? Estimating the Effects of Beginning at a Two-Year College,” University of Michigan, Ann Arbor, October 25, 2006, cited in William G. Bowen, Matthew M. Chingos, and Michael S. McPherson, Crossing the Finish Line: Completing College and America’s Public Universities (Princeton, New Jersey: Princeton University Press, 2009), 134.
- See, e.g., Richard D. Kahlenberg, “How Higher Education Funding Shortchanges Community Colleges,” The Century Foundation, May 28, 2015, https://tcf.org/content/report/how-higher-education-funding-shortchanges-community-colleges/.
- Century Foundation Task Force on Preventing Community Colleges from Becoming Separate and Unequal, Bridging the Higher Education Divide: Strengthening Community Colleges and Restoring the American Dream (New York: Century Foundation Press, 2013), 17.
- Robert Putnam, Our Kids: The American Dream in Crisis (New York: Simon & Schuster, 2015), 125–126.
- Donna M. Desrochers and Steven Hurlburt, Trends in College Spending 2003–2013 (Washington D.C.: American Institutes for Research, 2016), 24–27.
- Richard D. Kahlenberg, “How Higher Education Funding Shortchanges Community Colleges,” The Century Foundation, May 28, 2015, Figure 2, p. 3, https://tcf.org/content/report/how-higher-education-funding-shortchanges-community-colleges/, citing Donna M. Desrochers and Steven Hurlburt, Trends in College Spending 2003–2013 (Washington D.C.: American Institutes for Research, 2016), Figure S2, 19–21.
- Donna M. Desrochers and Steven Hurlburt, Trends in College Spending 2001–2011 (Washington, D.C.: American Institutes for Research, 2014), Figure S2, 19–21.
- Sandy Baum and Charles Kurose, “Community Colleges in Context: Exploring Financing of Two and Four-Year Institutions,” in Century Foundation Task Force on Preventing Community Colleges from Becoming Separate and Unequal, Bridging the Higher Education Divide: Strengthening Community Colleges and Restoring the American Dream (New York: Century Foundation Press, 2013), 97 and 102.
- Harry J. Holzer and Sandy Baum, Making College Work: Pathways for Success for Disadvantaged Students (Washington, D.C.: Brookings Institution Press, 2017), 178.
- Christopher M. Mullin and David S. Honeyman, “The Funding of Community Colleges: A Typology of State Funding Formulas,” Community College Review 35, no. 2 (October 2007): 113–27, at 117. See also Christopher M. Mullin, Doing More with Less: The Inequitable Funding of Community Colleges (Washington, D.C.: American Association of Community Colleges, September 2010), 6.
- Donna M. Desrochers and Steven Hurlburt, “Trends in College Spending: 2003-2013,” Delta Project on Postsecondary Education Costs, Productivity, and Accountability, American Institutes for Research, 2016, figure A3, 24–27, http://www.air.org/system/files/downloads/report/Delta-Cost-Trends-in-College%20Spending-January-2016.pdf. Some may argue that the current system—which allocates many more resources to four-year institutions—is efficient because the most funds are spent developing the talents of those students (of whatever race and class) who succeeded at the K–12 level, won slots at four-year colleges, and supposedly will contribute the most to society in the future. Students who have been less successful in society’s meritocratic race, the argument runs, should be educated more cheaply in the community college system. In fact, educational opportunities in primary and secondary schooling are vastly unequal, so we can have little confidence that the “meritocratic” winners by the end of high school are indeed society’s most able. Moreover, many highly able low-income students “undermatch,” attending community colleges even though they have the academic credentials to attend selective four-year colleges. See Caroline Hoxby and Christopher Avery, “The Missing ‘One-Offs’: The Hidden Supply of High-Achieving, Low-Income Students,” Brookings Papers on Economic Activity, Brookings Institution, Spring, 2013, 1–50, http://www.brookings.edu/~/media/projects/bpea/spring-2013/2013a_hoxby.pdf.
- Alicia C. Dowd and John Grant, Equity and Efficiency of Community College Appropriations: The Role of Local Financing (Ithaca, NY: Cornell Higher Education Research Institute, January 2006), 2, 15.
- Tammy Kolbe and Bruce D. Baker, “Fiscal Equity and America’s Community Colleges,” The Journal of Higher Education, May 18, 2018, 24.
- Sandy Baum and Charles Kurose, “Community Colleges in Context: Exploring Financing of Two and Four-Year Institutions,” in Century Foundation Task Force on Preventing Community Colleges from Becoming Separate and Unequal, Bridging the Higher Education Divide: Strengthening Community Colleges and Restoring the American Dream (New York: Century Foundation Press, 2013), 74.
- Richard D. Kahlenberg, “Community of Equals?” Democracy Journal, Spring, 2014, https://democracyjournal.org/magazine/32/community-of-equals/.
- David J. Deming and Christopher R. Walters, “The Impact of Price Caps and Spending Cuts on U.S. Postsecondary Attainment,” National Bureau of Economic Research, Working Paper 23736, August, 2017, 3.
- David J. Deming and Christopher R. Walters, “The Impact of Price Caps and Spending Cuts on U.S. Postsecondary Attainment,” National Bureau of Economic Research, Working Paper 23736, August, 2017, Table 4.
- David J. Deming and Christopher R. Walters, “The Impact of Price Caps and Spending Cuts on U.S. Postsecondary Attainment,” National Bureau of Economic Research, Working Paper 23736, August, 2017, 16.
- David J. Deming and Christopher R. Walters, “The Impact of Price Caps and Spending Cuts on U.S. Postsecondary Attainment,” National Bureau of Economic Research, Working Paper 23736, August, 2017, 21. See also David J. Deming, “Increasing College Completion with a Federal Higher Education Matching Grant,” The Hamilton Project, April, 2017, 2. See also Tammy Kolbe and Bruce D. Baker, “Fiscal Equity and America’s Community Colleges,” The Journal of Higher Education, May 18, 2018, 4 (re: Deming’s findings having particular power at the community college level.)
- David J. Deming and Christopher R. Walters, “The Impact of Price Caps and Spending Cuts on U.S. Postsecondary Attainment,” National Bureau of Economic Research, Working Paper 23736, August, 2017, 22.
- Juan Carlos Calcagno, Thomas Bailey, Davis Jenkins, Gregory Kienzl, and Timothy Leinbach, “Community College Student Success: What Institutional Characteristics Make a Difference?” Economics of Education Review 27, 2008, 632–45 and 644. See also Jane Wellman, “Financial Characteristics of broad access public institutions,” Background paper prepared for the Stanford Conference on Mapping Broad Access Higher Education, December 1–2, 2011, 21–22 (citing three research studies).
- Donna M. Desrochers and Jane V. Wellman, “Trends in College Spending 1999–2009,” Delta Project on Postsecondary Education Costs, Productivity, and Accountability, 2011, 30, https://www.deltacostproject.org/sites/default/files/products/Trends2011_Final_090711.pdf.
- Richard D. Kahlenberg, “Community of Equals? Few elites give much thought to community colleges. But they educate 44 percent of our undergraduates—and they need help,” Democracy Journal, Spring, 2014.
- Susan Dynarski, “How to Improve Graduation Rates at Community Colleges,” New York Times, March 11, 2015; and Katherine Mangan, “Program’s Extra Support for Community-College Students Is Paying Off,” Chronicle of Higher Education, February 26, 2015.
- Century Foundation Task Force on Preventing Community Colleges from Becoming Separate and Unequal, Bridging the Higher Education Divide: Strengthening Community Colleges and Restoring the American Dream (New York: Century Foundation Press, 2013), 35–40. See also David J. Deming, “Increasing College Completion with a Federal Higher Education Matching Grant,” The Hamilton Project, April, 2017, 6, suggesting “A number of recent high-quality studies find large impacts of student supports and mentoring on persistence and degree completion.”
- “A Matter of Degrees: Practices to Pathways,” Center for Community College Student Engagement, 2014.
- See Anthony P. Carnevale, Artem Gulish, and Jeff Strohl, “Educational Adequacy in the Twenty-First Century,” The Century Foundation, May 2, 2018, 24-25, https://tcf.org/content/report/educational-adequacy-twenty-first-century/.
- See John Bound, Michael F. Lovenheim, and Sarah Turner, “Why Have College Completion Rates Declined? An Analysis of Changing Student Preparation and Collegiate Resources,” American Economic Journal: Applied Economics, volume 2, issue 3, 2010, 129-57. See also David J. Deming, “Increasing College Completion with a Federal Higher Education Matching Grant,” The Hamilton Project, April, 2017, 12.
- See Bruce D. Baker, “How Money Matters for Schools,” Learning Policy Institute, December, 2017, p. 14. See also Bruce D. Baker, “Does Money Matter in Education?” Albert Shanker Institute, 2nd edition, 2016, i.
- Rucker C. Johnson and Sean Tanner, “Money and Freedom: The Impact of California’s School Finance Reform,” Learning Policy Institute, Research Brief, February, 2018, p. 9.
- Philip Trostel, “It’s Not Just the Money: The Benefits of College Education to Individuals and Society,” Lumina Foundation, Issue Papers, October 14, 2015, 9 and 14, https://www.luminafoundation.org/files/resources/its-not-just-the-money.pdf.
- Philip Trostel, “It’s Not Just the Money: The Benefits of College Education to Individuals and Society,” Lumina Foundation, Issue Papers, October 14, 2015, 41.
- Philip Trostel, “It’s Not Just the Money: The Benefits of College Education to Individuals and Society,” Lumina Foundation, Issue Papers, October 14, 2015, 14–15.
- Philip Trostel, “It’s Not Just the Money: The Benefits of College Education to Individuals and Society,” Lumina Foundation, Issue Papers, October 14, 2015, 45–46. See also Walter W. McMahon, “The External Benefits of Education,” MS No. 1226, available at https://www.researchgate.net/publication/286620724_The_External_Benefits_of_Education.
- See Richard D. Kahlenberg, “Community of Equals?” Democracy Journal, Spring, 2014, https://democracyjournal.org/magazine/32/community-of-equals/.
- See Tatiana Melguizo and Keith Witham, “Funding Community Colleges for Equity, Efficiency, and Student Success: An Examination of Evidence in California,” The Century Foundation, June 14, 2018, https://tcf.org/content/report/funding-community-colleges-equity-efficiency-student-success-examination-evidence-california/.
- “Completing College: A National View of Student Completion Rates—Fall 2011 Cohort,” National Student Clearinghouse Research Center, December 2017, 14, Figure 8. This research is consistent with the 2004/2009 Beginning Postsecondary Student Longitudinal Study (BPS), which found that only 34.5 percent of students who started in a two-year college earned a degree or certificate (from their starting institution or another school) within six years (8.5 percent earned certificates, 14.4 percent earned associate’s degrees, and 11.6 percent earned bachelor’s degrees.) See Century Foundation Task Force on Preventing Community Colleges from Becoming Separate and Unequal, Bridging the Higher Education Divide: Strengthening Community Colleges and Restoring the American Dream (New York: Century Foundation Press, 2013), 30.
- Compare James Rosenbaum, Caitlin Ahearn, Kelly Becker and Janet Rosenbaum, The New Forgotten Half and Research Directions to Support Them (New York: William T. Grant Foundation, 2015), 5 (which says there is “no earnings payoff” from having “some college,” absent a credential) with P. R. Bahr, “The labor market returns in earnings to community college credits and credentials in California,” Center for the Study of Higher and Postsecondary Education, School of Education, University of Michigan, 2015, https://umich.app.box.com/v/Bahr-2014-earnings1 (which finds “the return to students who are not awarded credentials can be as large as, or larger than, the return to students who are awarded credentials, depending upon the coursework that students complete”).
- Bridging the Higher Education Divide: Strengthening Community Colleges and Restoring the American Dream (New York: Century Foundation Press, 2013), 38.
- Stephanie Riegg Cellini and Nicholas Turner, “Gainfully Employed? Assessing the Employment and Earnings of For-Profit College Students Using Administrative Data,” Journal of Human Resources, January 30, 2018, http://jhr.uwpress.org/content/early/2018/01/31/jhr.54.2.1016.8302R1.abstract. See also Stephanie Riegg Cellini, “Gainfully Employed? New evidence on the earnings, employment, and debt of for-profit certificate students,” Brookings Institution, February 9, 2018, available at https://www.brookings.edu/blog/brown-center-chalkboard/2018/02/09/gainfully-employed-new-evidence-on-the-earnings-employment-and-debt-of-for-profit-certificate-students/.
- Susan Dynarski, “Online Courses Are Harming the Students Who Need the Most Help,” New York Times, January 19, 2018, https://www.nytimes.com/2018/01/19/business/online-courses-are-harming-the-students-who-need-the-most-help.html/.
- Ashley A. Smith, “Survey shows participation in online courses growing,” Inside Higher Ed, April 21, 2015.
- Century Foundation Task Force on Preventing Community Colleges from Becoming Separate and Unequal, Bridging the Higher Education Divide: Strengthening Community Colleges and Restoring the American Dream (New York: Century Foundation Press, 2013), 11.
- The group’s membership includes: Thomas Bailey (Columbia University); Bruce Baker (Rutgers University); Brooks Bowden (North Carolina State University); Anthony Carnevale (Georgetown University); Debbie Cochrane (The Institute for College Access and Success); Michelle Cooper (Institute for Higher Education Policy); Russ Deaton (Tennessee Department of Education); Wil Del Pilar (formerly with Pennsylvania Department of Education); David Deming (Harvard University); Sara Goldrick-Rab (Temple University); Harry Holzer (Georgetown University); Tammy Kolbe (University of Vermont); Jesse Levin (American Institutes for Research); Bridget Long (Harvard University); Tatiana Melguizo (University of Southern California); Gail Mellow (LaGuardia Community College); Andrew Nichols (Education Trust); George Pernsteiner (State Higher Education Executive Officers); Ken Redd (National Association of College and University Business Officers); Jennifer Rice (University of Maryland); and
Robert Toutkoushian (University of Georgia). Richard D. Kahlenberg (Century Foundation) serves as executive director. - Bruce Baker and Jesse Levin, “Estimating the Real Cost of Community College,” The Century Foundation, October 23, 2017, https://tcf.org/content/report/estimating-real-cost-community-college.
- Anthony P. Carnevale, Artem Gulish, and Jeff Strohl, “Educational Adequacy in the Twenty-First Century,” The Century Foundation, May 2, 2018, 2, https://tcf.org/content/report/educational-adequacy-twenty-first-century/.
- These data refer to state public higher education as a whole and are not limited to community colleges. David Baime and Sandy Baum, “Community Colleges: Multiple Missions, Diverse Student Bodies, and a Range of Policy Solutions,” Urban Institute, August 18, 2016, https://www.urban.org/research/publication/community-colleges-multiple-missions-diverse-student-bodies-and-range-policy-solutions/view/full_report.
- Jennifer A. Delaney and William R. Doyle. “State Spending on Higher Education: Testing the Balance Wheel over Time.” Journal of Education Finance 36, no. 4, 2011, 343–368.
- Ronald Brownstein, Reply to “Letters: Why Have States Cut University Funds?” The Atlantic, May 15, 2018. https://www.theatlantic.com/letters/archive/2018/05/letters-american-higher-education-hits-a-dangerous-milestone/560081/.
- “States’ Methods of Funding Higher Education,” SRI International, August 2012 (Revised), 50, https://www.sri.com/sites/default/files/brochures/revised-sri_report_states_methods_of_funding_higher_education.pdf (Finding twenty-seven states.) Today, the number is nine (author’s cross referencing SRI report with National Conference of State Legislature’s report on performance funding, available at http://www.ncsl.org/research/education/performance-funding.aspx). The nine states are: Alaska, Delaware, Maine, Nebraska, New Hampshire, Rhode Island, Vermont, West Virginia and New Jersey.
- See e.g. Nicholas Hillman, “Why Performance-Based College Funding Doesn’t Work
College Completion Series: Part Four,” The Century Foundation, May 25, 2016, https://tcf.org/content/report/why-performance-based-college-funding-doesnt-work/. - The legislature allocated funds designed to encourage students to enroll full-time and to complete. Laura Szabo-Kubitz, “Financial Aid Gains in the 2017-18 Budget,” The Institute for College Access & Success, June 2017, https://ticas.org/blog/financial-aid-gains-2017-18-california-state-budget-agreement.
- Need was assessed based on Census counts of adults with associates or bachelor’s degrees, with access based on community college enrollment by the students’ zip code. California Competes, “Educating Julio: Identifying and Addressing Community Colleges’ ‘Unmet Need’,” April 2014, http://californiacompetes.org/assets/general-files/Educating-Julio.pdf.
- A case could have been made for a major redistribution, but no such case was made. In fact, after the legislature adopted the outlines of the new formula, the negotiations inside the system led to a formula that still provided a growth substantial boost based on historical enrollment. The details of the formula for 2016–17 can be found here: http://extranet.cccco.edu/Portals/1/CFFP/Fiscal_Services/Budget_Workshop/2016/5b%20Explanations%20for%20Growth%20Formula%20(2016%20Budget%20Workshop).pdf.
- Nicholas Carnes, White-Collar Government: The Hidden Role of Class in Economic Policy Making (Chicago: University of Chicago Press, 2013).
- “State Legislators 2015 Highest Degree Attained,” National Conference of State Legislatures Legislator Demographics Survey, available at http://www.ncsl.org/Portals/1/Documents/About_State_Legislatures/Education.pdf: Nationally, the survey found that at least 73 percent of state legislators held a bachelor’s or advanced degree, with only 4 percent possessing less than a bachelor’s, and 23 percent missing data. Pew, who helped conduct the survey, also points out that lawmakers with business backgrounds hold the biggest share of seats.
- “Summary: Fall 2017 Fiscal Survey of the States,” The National Association of State Budget Officers, December 14, 2017, available via https://www.nasbo.org/mainsite/reports-data/fiscal-survey-of-states/fiscal-survey-archives.
- Thomas L. Harnisch and Dylan Opalich, “Higher Education State Policy Issues for 2018,” AASCU Government Relations and Policy Analysis Division, January 2018, www.aascu.org/policy/publications/policy-matters/Top10Issues2018.pdf.
- Hannah Fingerhut, “Republicans skeptical of colleges’ impact on U.S., but most see benefits for workforce participation,” Pew Research Center, July 20, 2017, http://www.pewresearch.org/fact-tank/2017/07/20/republicans-skeptical-of-colleges-impact-on-u-s-but-most-see-benefits-for-workforce-preparation/.
- Century Foundation Task Force on Preventing Community Colleges from Becoming Separate and Unequal, Bridging the Higher Education Divide: Strengthening Community Colleges and Restoring the American Dream (New York: Century Foundation Press, 2013), 5.
- Martha J. Bailey and Susan M. Dynarski, “Inequality in Postsecondary Education,” in Whither Opportunity? Rising Inequality, Schools, and Children’s Life Chances, ed. Greg J. Duncan and Richard J. Murnane (New York: Russell Sage Foundation, 2011).
- In some states, reference to a numerical goal—such as adequate funding necessary to ensure that most community college students receive a salary of at least $35,000—may prove a catalyst for political support. See Anthony P. Carnevale, Artem Gulish, and Jeff Strohl, “Educational Adequacy in the Twenty-First Century,” The Century Foundation, May 2, 2018, 24-25, https://tcf.org/content/report/educational-adequacy-twenty-first-century/.
- Jonathan Voss, Vice President, Lake Research, Presentation at “Higher Ed 2020: College Affordability Ideas for the Next Congress and Beyond,” The Century Foundation, September 26, 2018. https://tcf.org/content/event/higher-ed-2020-college-affordability-ideas-next-congress-beyond/.
- Adam Harris, “The Higher Education Nearly All Americans Love,” The Atlantic, May 21, 2018.
- Richard Florida, “The U.S. Cities Winning the Battle Against Brain Drain,” City Lab, March 15, 2016.
- See e.g. Sara Goldrick-Rab and Nancy Kendall, “F2CO: Redefining College Affordability—Securing America’s Future with a Free Two Year College Option,” The Education Optimists, April 2014, 18; and Jen Mishory, “The Future of Statewide College Promise Programs,” The Century Foundation, March 6, 2018, https://tcf.org/content/report/future-statewide-college-promise-programs/.
- Robert Kelchen, “Do Performance-Based Funding Policies Affect Underrepresented Student Enrollment?” The Journal of Higher Education, Volume 89, Issue 5, 2018, 702-727; Paul Fain, “Negative Findings on Performance-Based Funding,” Inside Higher Ed, December 18, 2017 (referencing studies by Amy Li and Nick Hillman); Tiffany Jones and Sosanya Jones, “Can Equity Be Bought? A Look at Outcomes-Based Funding in Higher Education,” Ed Trust, November 6, 2017, https://edtrust.org/the-equity-line/can-equity-bought-outcomes-based-funding/.
- Lauren Musu-Gillette and Stephen Cornman, “Financing education: National, state, and local funding and spending for public schools in 2013,” National Center for Education Statistics, January 25, 2016.
https://nces.ed.gov/blogs/nces/post/financing-education-national-state-and-local-funding-and-spending-for-public-schools-in-2013. - See e.g. “Fact Sheet: Supplement-not-Supplant under Title I of the Every Student Succeeds Act,” U.S. Department of Education, https://www.ed.gov/news/press-releases/fact-sheet-supplement-not-supplant-under-title-i-every-student-succeeds-act.
- See Richard D. Kahlenberg, All Together Now: Creating Middle-Class Schools through Public School Choice (Washington, D.C.: Brookings Institution Press, 2001), 177-178.
- Deborah A. Verstegen, “How Do States Pay for Schools? An Update of a 50-State Survey of Finance Policies and Programs,” Association for Education Finance and Policy Annual Conference, San Antonio, Texas, March 15, 2014, 8, https://schoolfinancesdav.files.wordpress.com/2014/04/aefp-50-stateaidsystems.pdf.
- Century Foundation Task Force on Preventing Community Colleges from Becoming Separate and Unequal, Bridging the Higher Education Divide: Strengthening Community Colleges and Restoring the American Dream (New York: Century Foundation Press, 2013), 17.
- Century Foundation Task Force on Preventing Community Colleges from Becoming Separate and Unequal, Bridging the Higher Education Divide: Strengthening Community Colleges and Restoring the American Dream (New York: Century Foundation Press, 2013), 17.
- Natasha Ushomirsky and David Williams, “Funding Gaps 2015: Too Many States Still Spend Less on Education Students Who Need the Most,” The Education Trust, March 2015, 5.
- Emma Brown, “In 23 states, richer school districts get more state and local funding than poorer districts,” Washington Post, March 13, 2015, A18.
- See e.g. Andrea Gabor, After the Education Wars: How Smart Schools Upend the Business of Reform (New York: The New Press, 2018), 129.
- “Performance-Based Funding for Higher Education,” National Conference of State Legislators, January 13, 2015.
- The Irish Higher Education Authority allocates extra public funds—called “access weighting”—for institutions that succeed in educating larger proportions of low-income students. “National Plan for Equity of Access to Higher Education, 2008–2013,” Irish Higher Education Authority, July 2008, 48. See also “National Strategy for Higher Education to 2030,” Irish Department of Education and Skills, January 2011, 114–15, 122. The funding has been part of a plan to increase the proportion of economically disadvantaged students who attend college from 20 percent in 2007 to 54 percent by 2020. “External Audit of Equal Access Survey,” Irish Higher Education Authority, June 2010, 7–8 and 16.
- “External Audit of Equal Access Survey,” Irish Higher Education Authority, June, 2010, 7–8 and 16.
- “Review of the Allocation Model for Funding Higher Education Institutions,” Irish Higher Education Authority, May, 2017, http://hea.ie/assets/uploads/2017/06/HEA-RFAM-Final-Interim-Report-062017.pdf.
- England has had a similar plan in place for some time. Higher education researcher Arthur Hauptman noted in 2003: “The English funding council for a number of years has paid institutions a premium of 5 percent for students who come from postal codes with the lowest income profiles.” Arthur M. Hauptman, “Using Institutional Incentives to Improve Student Performance,” in Double the Numbers: Increasing Postsecondary Credentials for Underrepresented Youth, ed. Richard Kazis, Joel Vargas, and Nancy Hoffman (Cambridge, Massachusetts: Harvard Education Press, 2004).
- “Guide to funding 2016–17: How HEFCE allocates its funds,” Higher Education Funding Council for England, May, May 2016, http://www.hefce.ac.uk/media/HEFCE,2014/Content/Pubs/2016/201607/HEFCE2016_07.pdf.
- “Guide to funding 2016–17: How HEFCE allocates its funds,” Higher Education Funding Council for England, May, May 2016, http://www.hefce.ac.uk/media/HEFCE,2014/Content/Pubs/2016/201607/HEFCE2016_07.pdf.
- “Trends in young participation in higher education,” Higher Education Funding Council for England, October, 2013, http://www.hefce.ac.uk/media/hefce/content/pubs/2013/201328/HEFCE_2013_28.pdf.
- Andrew J. Campa, “Glendale Community College prepares for new funding formula based on student success,” Los Angeles Times, August 28, 2018, http://www.latimes.com/socal/glendale-news-press/news/tn-gnp-me-student-success-formula-20180828-story.html.
- See e.g. Michael A. Rebell, “Educational Adequacy, Democracy, and the Courts,” in Christopher Edley, Timothy Ready and Catherine Snow (eds), Achieving High Educational Standards for All (Washington, D.C.: National Academies Press, 2002) (noting the “link between the standards-based reform movement, which is now being implemented in virtually all of the states, and the courts’ recent emphasis on adequacy…[S]tandards-based reforms have provided the courts with “judicially manageable” tools that allow them to devise effective remedial orders in these cases.”). It is possible the litigation could be employed to provide adequate funding for community college developmental education because the substance of that education was supposed to be provided to students at the K–12 level, but the focus of this paper is on policy rather than legal strategies.
- “National Plan for Equity of Access to Higher Education, 2008–2013,” Irish Higher Education Authority, July 2008.
- “Tracking America’s progress toward 2025,” Lumina Foundation, available at http://strongernation.luminafoundation.org/report/2018/#nation. For more details on twenty-nine of those state goals, see “States with Higher Education Attainment Goals,” Lumina Foundation, September 16, 2018, http://strategylabs.luminafoundation.org/wp-content/uploads/2013/10/State-Attainment-Goals.pdf. As Lumina points out, “An attainment goal refers to the educational level of a state’s population; a completion goal speaks to the credential completion of students enrolled at an institution or group of institutions.” See “Statewide Educational Attainment Goals: A Case Study,” Lumina Foundation, 2, https://www.luminafoundation.org/files/resources/01-statewide-attainment-goals.pdf.
- Nicholas Hillman, “Why Performance-Based College Funding Doesn’t Work College Completion Series: Part Four,” The Century Foundation, May 25, 2016, https://tcf.org/content/report/why-performance-based-college-funding-doesnt-work/.
- Jen Mishory, “The Future of Statewide College Promise Programs,” The Century Foundation, March 6, 2018, https://tcf.org/content/report/future-statewide-college-promise-programs/.
- Jen Mishory, “The Future of Statewide College Promise Programs,” The Century Foundation, March 6, 2018, https://tcf.org/content/report/future-statewide-college-promise-programs/.
- Jason Rosenbaum, “As State Budget Revenues Fall Short, Higher Education Faces a Squeeze, NPR, March 3, 2017, https://www.npr.org/2017/03/03/517073825/as-state-budget-revenues-fall-short-higher-education-faces-a-squeeze.
- “Tracking America’s progress toward 2025,” Lumina Foundation, available at http://strongernation.luminafoundation.org/report/2018/#nation.
- Anthony P. Carnevale, Artem Gulish, and Jeff Strohl, “Educational Adequacy in the Twenty-First Century,” The Century Foundation, May 2, 2018, 24-25, https://tcf.org/content/report/educational-adequacy-twenty-first-century/. Louisiana and Florida put weight on graduate earnings in their outcome based funding models. See Harry J. Holzer and Sandy Baum, Making College Work: Pathways for Success for Disadvantaged Students (Washington, D.C.: Brookings Institution Press, 2017), 175.
- “Tracking America’s progress toward 2025,” Lumina Foundation, available at http://strongernation.luminafoundation.org/report/2018/#nation.
- See e.g. David Leonhardt, “The Two Biggest Problems with College,” New York Times, June 20, 2018 (describing lack of funding and lack of accountability as the twin challenges for higher education).
- See Tatiana Melguizo and Keith Witham, “Funding Community Colleges for Equity, Efficiency, and Student Success: An Examination of Evidence in California,” The Century Foundation, June 14, 2018, https://tcf.org/content/report/funding-community-colleges-equity-efficiency-student-success-examination-evidence-california/; David L. Kirp, “If community colleges want more funding, they have to graduate more students,” Los Angeles Times, June 22, 2018, http://www.latimes.com/opinion/op-ed/la-oe-kirp-community-college-funding-20180622-story.html.
- See “Beyond Tuition: Promises for Affordability, Quality, and Accountability in Higher Education,” Postsecondary Education Team, Center for American Progress, June, 2018, 1, https://cdn.americanprogress.org/content/uploads/2018/06/19130155/BeyondTuition-factsheet2.pdf. State formulas will have to adjust funding not only on the basis of need (such as family income) but on a variety of other factors as well. These include: accounting for student needs for housing, food, and child care not traditionally thought of as “educational” expenses; accounting for costs associated with concentrated need; accounting for differential costs associated with different programs and academic disciplines; accounting for different costs associated with geographic location; accounting for different costs associated with scale; and accounting for different costs associated with form of education (online vs. brick-and-mortar).
- See e.g. Sara Goldrick-Rab and Nancy Kendall, “F2CO: Redefining College Affordability—Securing America’s Future with a Free Two Year College Option,” The Education Optimists, April 2014, 18 (“The current means-tested system demands nothing from colleges and universities in terms of program quality beyond the limited demands of accreditors. By investing in a universal system, the federal government can engage states and institutions in a conversation about what is required to ensure that students being and complete a quality education.”).
- For example, the Obama Administration’s 2015 America’s College Promise Proposal called not only for free community college tuition but suggested “community colleges must strengthen their programs and increase the number of students who graduate [and] states must invest more in higher education and training….” See “Fact Sheet—White House Unveils America’s College Promise Proposal,” Obama White House, January 9, 2015, https://obamawhitehouse.archives.gov/the-press-office/2015/01/09/fact-sheet-white-house-unveils-america-s-college-promise-proposal-tuitio.
- See e.g. Sara Goldrick-Rab, “It’s Hard to Study if You’re Hungry,” New York Times, January 14, 2018, https://www.nytimes.com/2018/01/14/opinion/hunger-college-food-insecurity.html.
- Harry J. Holzer and Sandy Baum, Making College Work: Pathways for Success for Disadvantaged Students (Washington, D.C.: Brookings Institution Press, 2017), 146.
- Jonathan Voss, Vice President, Lake Research, Presentation at “Higher Ed 2020: College Affordability Ideas for the Next Congress and Beyond,” The Century Foundation, September 26, 2018, https://tcf.org/content/event/higher-ed-2020-college-affordability-ideas-next-congress-beyond/.
- “Promise with a Purpose: College Promise Programs ‘Built for Completion,’” Complete College America, College Promise Campaign, and Achieving the Dream, April 30, 2018, https://completecollege.org/wp-content/uploads/2018/04/CCA015_PromisewithaPurpose_4.30.2018.pdf.
- John Michael Lee Jr., and Samaad Wes Keys, “Land-Grant But Unequal: State One-to-One Funding for 1890 Land-Grant Universities,” Association of Public and Land Grant Universities, September 2013, 1–2.
- Jennifer Mishory, “Path to Debt-Free College: A Blueprint for Building a Successful Federal-State Partnership,” The Century Foundation, September 26, 2018, 3, https://tcf.org/content/report/path-debt-free-college/.
- See e.g. David Tandberg, Sophia Laderman, and Andy Carlson, “A Federal-State Partnership for True College Affordability,” State Higher Education Executive Officers Association, June, 2017; David J. Deming, “Increasing College Completion with a Federal Higher Education Match,” The Hamilton Project, April, 2017, 2.
- “Fact Sheet: White House Unveils America’s College Promise Proposal,” Obama White House, January 9, 2015, https://obamawhitehouse.archives.gov/the-press-office/2015/01/09/fact-sheet-white-house-unveils-america-s-college-promise-proposal-tuitio.
- “Status of State Action on the Medicaid Expansion Decision,” Henry J Kaiser Family Foundation, April 27, 2018, https://www.kff.org/health-reform/state-indicator/state-activity-around-expanding-medicaid-under-the-affordable-care-act/?activeTab=map¤tTimeframe=0&selectedDistributions=current-status-of-medicaid-expansion-decision&sortModel=%7B%22colId%22:%22Location%22,%22sort%22:%22asc%22%7D. See also David J. Deming, “Increasing College Completion with a Federal Higher Education Matching Grant,” The Hamilton Project, April, 2017, 6 (citing the matching program structure as having been “used successfully to boost state Medicaid spending” as discussed by Baicker and Staiger and Kane, Orzag and Apostolov).
- For discussion of state pressure to avoid “brain drain,” see Colleen Campbell, Center for American Progress, remarks at “Higher Ed 2020: College Affordability Ideas for the Next Congress and Beyond,” The Century Foundation, September 26, 2018, https://tcf.org/content/event/higher-ed-2020-college-affordability-ideas-next-congress-beyond/.
- See David J. Deming and Christopher R. Walters, “The Impact of Price Caps and Spending Cuts on U.S. Postsecondary Attainment,” National Bureau of Economic Research, Working Paper 23736, August, 2017, 2.
- Even in cases where legislators reject new research costing out the adequate spending levels required to reach a given result, an appeal can be made to equity. For example, for community college students who are required to take remedial education courses, a powerful argument can be made that they should receive funding support at the same level the state provides to high school students until those community college students reach levels of proficiency that enable them to take credit-bearing college courses. The share of students taking remedial courses in community college is large: 68 percent of community college students who entered in 2003–04 took at least one remedial class by 2009. See Harry J. Holzer and Sandy Baum, Making College Work: Pathways for Success for Disadvantaged Students (Washington, D.C.: Brookings Institution Press, 2017), 20.
- See Century Foundation Task Force on Preventing Community Colleges from Becoming Separate and Unequal, Bridging the Higher Education Divide: Strengthening Community Colleges and Restoring the American Dream (New York: Century Foundation Press, 2013), 21-28.