
In the United States, where social mobility has been considered a birthright, community colleges are essential to that promise. Located in hundreds of communities throughout the country, near where people live and work, two-year colleges are meant to be America’s quintessential institutions for the aspiring middle class. While elite four-year colleges boast of the proportion of students they reject, community colleges take pride, as one leader suggested, in taking the “top 100 percent of students.”
But America’s 1,000 community colleges, which educate 9 million students, are routinely under-resourced and often fall short of their promise. Only 38 percent of students entering community college complete a degree or certificate within six years. While 81 percent of students entering community college say they aspire to eventually transfer and receive a four-year degree, only 15 percent do so after six years.
Part of the responsibility lies with K–12 institutions, which do not adequately prepare students for college, and part of the fault lies with the two-year sector, which often fails to provide enough structure and guidance to undergraduates. And part of the fault must be laid at the feet of four-year colleges and universities, which make transferring from community colleges difficult to understand and challenging to achieve. But the lion’s share of the blame lies with policymakers who systematically shortchange community colleges financially, giving two-year institutions the fewest resources to educate those students who tend to have the greatest needs.
New data in this report show that, while just one in five students at the most competitive and highly competitive four-year colleges came from the bottom half of the socioeconomic distribution in 2013, the majority of community college students did. Researchers have long recognized that disadvantaged students need more resources to succeed than those who have enjoyed many advantages, and yet state budgets have starved community colleges of the funds they need to succeed.
In fiscal year 2013, private four-year research institutions spent five times as much per full time equivalent student annually ($72,000) as did community colleges ($14,000). Some of that difference is explained by the differing research functions of institutions, but when one excludes research expenses and focuses on education and related expenses, private research universities still spend three times as much as community colleges. Public research universities spend 60 percent more than community colleges.
Inadequate funding of community colleges is deeply troubling given that careful research has found “significant causal impacts” of spending on degree completion. Scholars looking at community colleges between 1990 and 2013 found that a 10 percent spending increase boosted awards and certificates by 15 percent. When students complete an associate’s degree, they will see their lifetime earnings increase on average by more than $300,000.
What can be done? In this report, we recommend that states immediately begin to increase community college funding in order to boost opportunities for students. We also call for the creation of a new federal–state partnership for community colleges in which states must agree to do their part in order to qualify for new federal investments in two-year institutions.
Our mid-term recommendation is that federal and state policymakers—and foundation officials—support a new body of research that will establish, for the first time, what it costs to provide a strong community college education. Such studies are commonplace in public K–12 education, where for forty years, researchers have sought to establish what level of funding is required to achieve adequate outcomes and how much additional funding should be targeted to achieve good results for disadvantaged students in particular. These studies also seek to provide guidance on where money should be invested to achieve the greatest bang for the buck.
Part of the reason researchers have not conducted comparable studies at the community college level is that there are special challenges to doing so not found at the K–12 level. For example, the first step in estimating costs is to identify with some precision the desired outcome. In K–12 schooling, researchers often calculate the cost of achieving a certain level of proficiency on standardized tests or higher education completion. But in higher education, such tests of learning outcomes are not widely available, and the ultimate goal students typically have is not only to graduate, but also to acquire skills that significantly and cost-effectively raise earnings and, wherever possible, allow a worker to earn a decent living. Likewise, community colleges offer a widely variety of programs—from nursing to welding—that are not offered at a typical high school. The costs of providing those different types of programs may vary more widely than the cost of providing a traditional high school education.
As a working group, we analyzed and debated these types of thorny questions, and in this report now offer a set of eight recommendations that, taken together, constitute a framework for how researchers can best estimate the cost of a community college education. (See Appendix for the list of working group members). While acknowledging the complexities, we ultimately believe such a study can and should be undertaken.
Today, policymakers are making decisions about where, and how much, to invest in community colleges without information about what really is needed to achieve the outcomes they seek. Much better research could greatly improve those decisions, substantially boost the life chances of community college students, and jumpstart social mobility in America.
The Report of the Working Group
In the United States, parents have expected their children to grow up to be better off as a matter of course. Social mobility allows a society to tap into the talents of disadvantaged populations in a way that benefits everyone. Vertical mobility permits individuals of all backgrounds the opportunity for an enriching and financially stable life. And forward economic momentum greases the wheels of a smoothly functioning multiracial democracy.
Research finds, however, that social mobility in the United States is on the decline, and polls find that fewer and fewer Americans believe their children will see improved life prospects.1 When social mobility breaks down, some Americans look for scapegoats, and society’s most vulnerable members—immigrants, African Americans, the poor, and religious minorities—suffer. When America loses its optimism, it becomes an uglier place. When fewer Americans have the chance to advance economically, human potential is wasted and society is poorer.
For generations, public education in America has been a driving force for social mobility, beginning with creation of elementary schools, then secondary schools. Now, at a time when the economy demands higher levels of skills among workers, community colleges have become especially critical institutions of social mobility. Whereas a high school diploma and a union card used to provide access to the middle class, today, researchers find, “80 percent of good jobs that support middle-class lifestyles” require some postsecondary education.2 Two-year colleges, located in hundreds of communities throughout the country, near where people live and work, and open to the “top 100 percent of students,” are meant to be America’s quintessential institutions for the aspiring middle class and those seeking to avoid downward mobility.3
The country’s 1,000 public two-year institutions serving 9 million undergraduates are routinely under-resourced, and overburdened.
Yet too many of America’s community colleges are underfunded and have failed to deliver on their promise. The country’s 1,000 public two-year institutions serving 9 million undergraduates are routinely under-resourced, and overburdened.4 While individual community college leaders are doing extraordinary work, the sector as a whole is not producing the results the country needs. Only 38 percent of students entering community college complete a degree or certificate within six years. While 81 percent of students entering community college say they aspire to eventually transfer and receive a four-year degree, only 15 percent do so after six years.5
Research outlined in this report suggests that one central impediment to success is a lack of resources. Society asks community colleges to educate those students who are most likely to face significant disadvantages, and to do so with relatively few dollars. This much we know.
But precisely how much funding do community colleges need to succeed? Astonishingly, researchers have conducted almost no empirical research on this question. At the K–12 level, scholars have engaged in dozens of studies to establish the level of funding required to provide an “adequate” level of education. These studies have spurred K–12 finance reforms that have generally led to improved outcomes for students.6
The Century Foundation, with the support of the William T. Grant Foundation, created this Working Group on Community College Financial Resources to think about ways to apply K–12 costing-out methodologies to community colleges. The purpose of this report is to establish—for the first time—a framework for how a study could be conducted to estimate the true costs of a strong community college education. (For a list of working group members, see the Appendix.)
This report proceeds in three parts. The first lays out the stakes—why it is important to establish the true cost of a community college education and provide two-year institutions with the resources they need. The second part examines the four key steps that K–12 costing-out studies take; outlines four critical differences between pre-collegiate and community college education; and delineates eight concrete recommendations that provide a framework for how this research should be conducted in the future. The third part of the report articulates a plan for how policy leaders could use new empirical evidence provided by a community college costing-out study to inform policymaking.
The Stakes: Why It Is Important to Establish the True Cost of an Adequate Community College Education
The Declining American Dream
Americans are increasingly pessimistic about the prospects of the next generation.7 According to a 2017 Pew Research Center survey, 58 percent of Americans said today’s children will grow up to be financially worse off than their parents, compared with just 37 percent who predicted those children will be better off.8
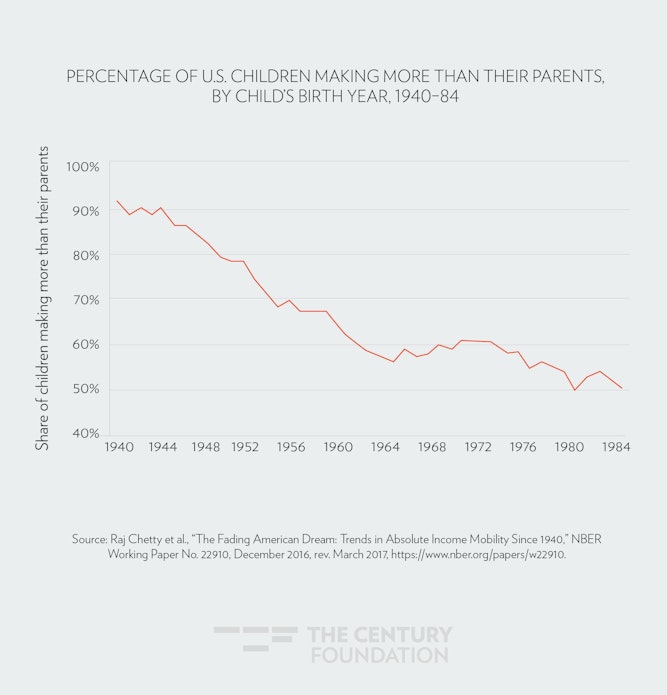
Americans are right to be concerned. According to research by Harvard University’s Raj Chetty, the proportion of American children making more than their parents (in inflation-adjusted dollars) has declined, from more than 90 percent of those who were born in 1940 to about 50 percent of those born in 1984.9 (See Figure 1.)
Figure 1
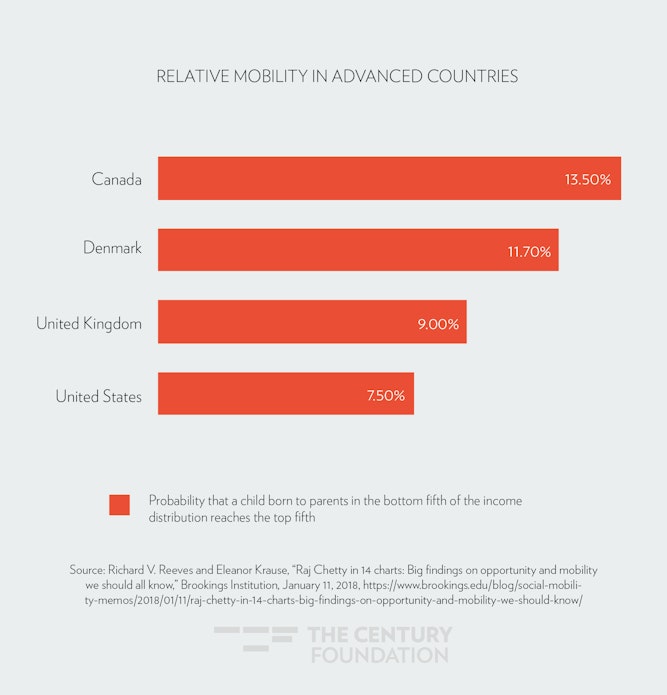
Research also finds that relative mobility—the probability that a child born into the bottom fifth of the income distribution will at some point reach the top fifth—is much less likely in the United States than in many other nations. In fact, such social mobility is almost twice as likely to occur in Canada as the United States, according to Chetty’s research.10 (See Figure 2.)
Figure 2
Community Colleges Can Help Remedy Low Levels of Mobility if Two-Year Institutions Are Properly Resourced
For seventy years, policymakers have viewed public community colleges as a critical driver of upward mobility in the United States. The 1947 Truman Commission on Higher Education envisioned community colleges as key institutions in reaching the goal of equal opportunity for all Americans. The commission renamed “junior colleges,” which had been around since 1901, as “community colleges” to emphasize their vast geographic reach and their special mission in supporting individual communities.11 Perhaps because of their community focus—and their accessibility to a broad cross-section of students—community colleges command greater support in public opinion surveys than do four-year institutions.12
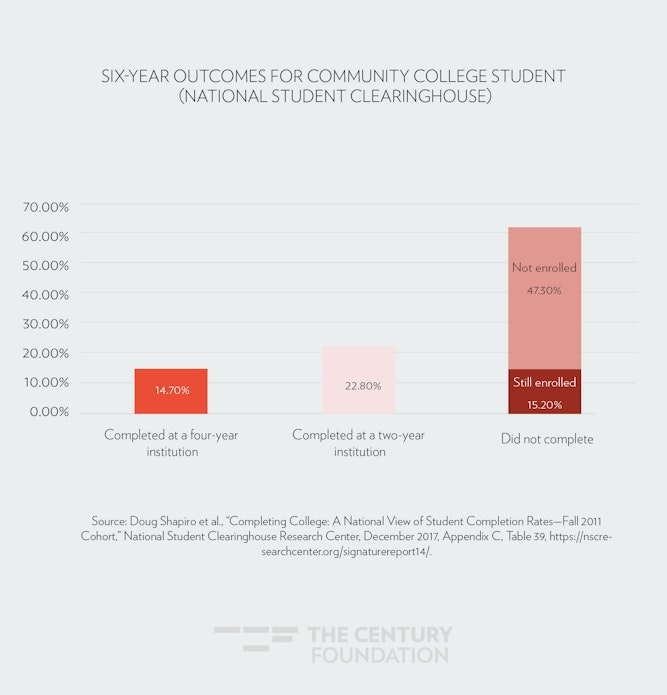
Six years after entering community college, only 22.8 percent of students have completed a two-year degree or certificate (and no more), and another 14.7 percent have completed a four-year degree.
The public is right to believe that community colleges can contribute to upward mobility in the nation. At the same time, too many students at community colleges are not finding their way to a degree or certificate. According the National Student Clearinghouse Research Center, six years after entering community college, only 22.8 percent of students have completed a two-year degree or certificate (and no more), and another 14.7 percent have completed a four-year degree. The vast majority—62.5 percent—have not received a degree of any type after six years (15.2 percent are still enrolled, but 47.3 percent are no longer enrolled).13
Figure 3
Low levels of completion surely reflect in part the academic preparation levels found, on average, among community college students.14 But careful research that controls for incoming academic preparation and demographic factors finds that students intending to pursue a four-year degree face substantially reduced chances of earning such a degree when they begin at a two-year rather than a four-year institution. Kent State economist C. Lockwood Reynolds, for example, estimated, after applying appropriate controls, that beginning at a two-year college reduces one’s ultimate chances of receiving a bachelor’s degree by 30 percentage points.15 This differential may reflect the difficulties that can arise when students transfer from a community college to a four-year institution; but the reduced chances of attaining a bachelor’s degree may well be a product of the issue to which we now turn: the relatively low levels of funding found, on average, in the two-year sector.
Community College Resources Do Not Equal the Challenge
Researchers have identified three broad paths for improving outcomes for community college students: (1) providing better academic support to students at the K–12 level so that fewer students are in need of remedial classes; (2) improving efficiency at the community college level through adoption of best practices, such as guided pathways that add greater structure and guidance to the student experience;16 and (3) providing adequate financial resources. We support all three approaches, but in this report, we focus particularly on the third path, which is too often ignored.
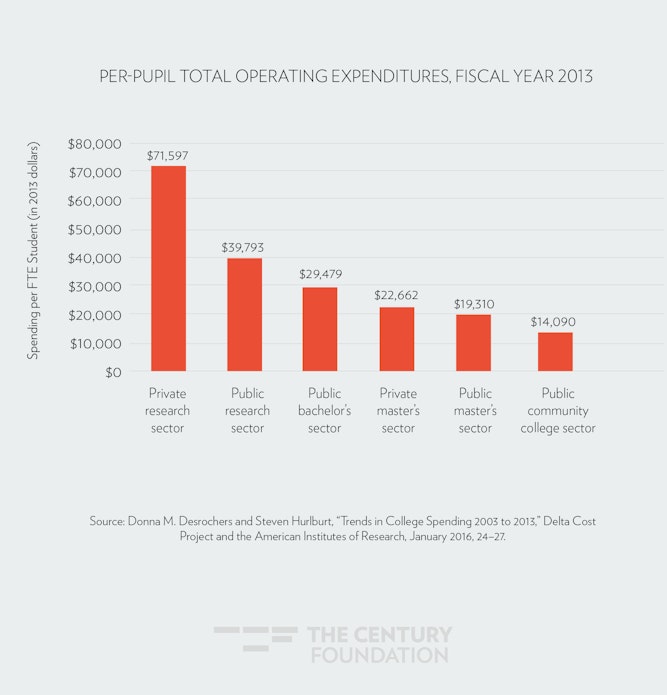
The absolute differences in spending levels between two-year and four-year institutions is remarkable, even accounting for the different functions of research universities and two-year institutions devoted primarily to instruction. According to a 2016 report from the American Institutes of Research (AIR), private research universities spend five times as much per student per year ($71,597) as community colleges do ($14,090), and public research universities almost three times as much ($39,783).17 (See Figure 4.)
Figure 4
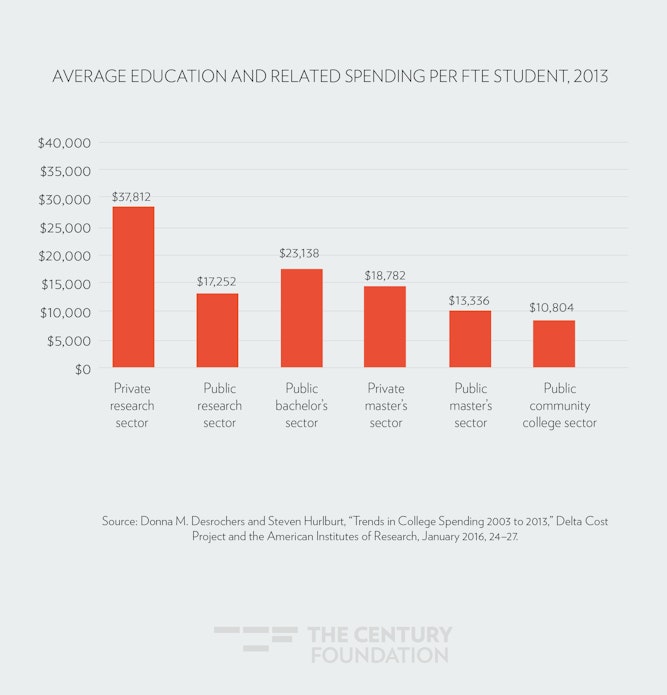
Of course, some of the spending differentials are related to the fact that research universities are tasked with conducting research as well as educating students, but AIR’s data show that when one excludes research expenses and focuses on educational instruction, spending inequalities remain.18 For example, private research universities still spend more than three times as much as public community colleges on “education and related” spending, and public research universities spend 60 percent more ($17,252 at public research universities versus $10,804 at public community colleges).19 (See Figure 5.)
Figure 5
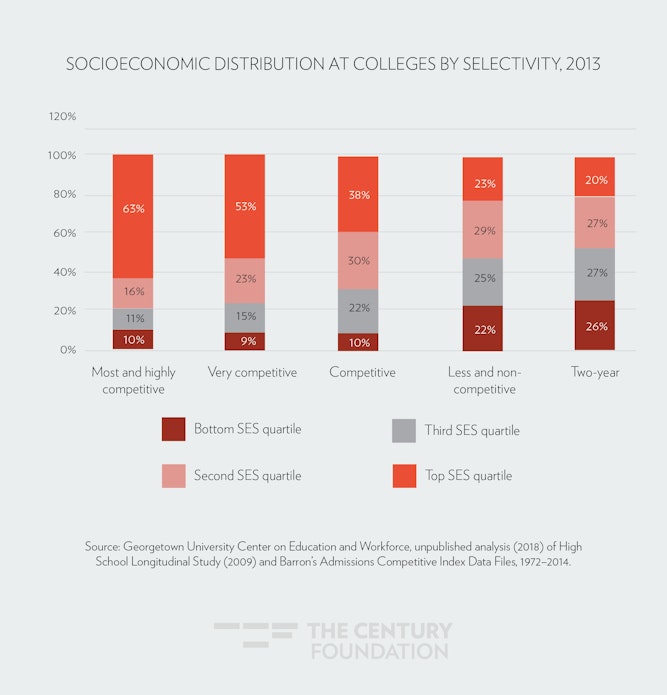
To make matters worse, these inequalities in spending occur despite the fact that community colleges tend to educate students with greater educational needs than students at four-year institutions. According to new research from Georgetown University’s Center for Education and the Workforce, community college students are far more likely to be socioeconomically disadvantaged than students in four-year colleges, especially the most selective four-year institutions. While just one in five students in the most and highly competitive four-year colleges came from the bottom half of the socioeconomic distribution of the population in 2013, for example, the majority of students in community colleges did. (See Figure 6.) As discussed further below, researchers have long recognized that to achieve comparable outcomes, students with greater needs require greater resources, not fewer.
Figure 6
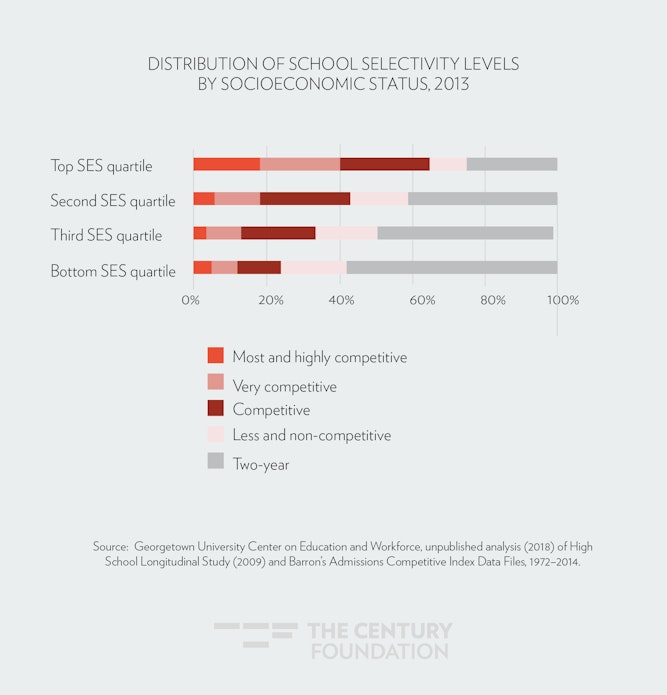
Another way to consider the socioeconomic distribution is to examine the destinations of college-going students within each socioeconomic quartile. As Figure 7 indicates, the majority (58 percent) of students in the bottom socioeconomic quartile in 2013 enrolled at community colleges, compared with just 25 percent of students from the top socioeconomic quartile.
Figure 7
Funding Matters in Outcomes at Community Colleges
The lower levels of spending in community colleges—coupled with the greater needs, on average, in community college student bodies—is important because research suggests that greater resources are connected to better outcomes for students in higher education.20 In the four-year college sector, for example, John Bound of the University of Michigan, Michael Lovenheim of Cornell, and Sarah Turner of the University of Virginia found in an important 2010 study that declining completion rates over time were due primarily to declines in resources per student.21 The research on the importance of resources in four-year colleges dovetails with a wide body of research suggesting resources matter at the K–12 level.22 In a February 2018 study of California’s K–12 funding increases, for example, Rucker Johnson of the University of California–Berkeley, and Sean Tanner of WestEd, looking at the effects of the Local Control Funding Formula (LCFF), “found strongly significant impacts of LCFF-induced increases in district revenue on average high school graduation rates for all children.” In particular, they found that “a $1,000 increase in district per-pupil revenue from the state experienced in grades 10–12 leads to a 5.3 percentage-point increase in high school graduation rates, on average, among all children.”23
Similar results have been found in the community college sector. Among the most important recent studies on this topic is one conducted by David Deming of Harvard University and Christopher Walters of University of California–Berkeley for the National Bureau of Economic Research in August 2017. The researchers examined the impact of postsecondary spending between 1990 and 2013 and found “positive and statistically significant causal impacts of spending on degree completion.”24 The authors concluded that spending had even larger impacts in two-year institutions than four-year institutions.25 Specifically, Deming and Walters found that a 10 percent increase in spending in a given year resulted in increased awards of certificates and degrees in the following two years of 14.5 and 14.6 percent, respectively.26 The authors did not explore the precise reasons that spending had positive outcomes but suggested it was possible that increased course offerings, shorter waiting lists, better student guidance, and smaller class sizes produced the improved results.27
In addition, there is evidence that certain investments are particularly likely to be worthwhile:28
- Full-time faculty. Much—though not all—relevant research finds that having more full-time faculty on staff leads to improved outcomes for students.29 Yet today, community colleges frequently rely on inexpensive adjuncts and other part-time instructors. Only 31 percent of faculty members at public community colleges are full-time, compared with 42 percent at public research universities and 50 percent at private research universities. (Graduate assistants are counted as part-time in this analysis.)30 Investing in more full-time community college faculty could result in improved outcomes for students.
- Extra tutoring, small class size, intensive advising, and generous financial aid. There is strong evidence that investing in extra tutoring, small class sizes, intensive advising, and generous financial aid at community colleges can have big payoffs. At a typical community college, classes are crowded and student–adviser ratios can be as high as 1,500 to 1.31 But at the City University of New York’s Accelerated Study in Associate Programs (ASAP), students are provided with the tutoring, class size, advising, and effective financial aid more typical of wealthy four-year colleges. These supports, provided within a highly structured environment in which students must attend classes full time, have been found in a randomized trial conducted by the nonprofit research institute MDRC to nearly double the three-year graduation rates of students (to 40 percent, compared with a control group’s 22 percent). The program cost 60 percent more per student—about $16,300 more per pupil over three years—yet by boosting results, it actually reduced the amount spent for each college degree awarded by more than 10 percent.32 More generally, research also finds that investments in smaller class sizes in community colleges, more counselors, and more full-time faculty can improve student outcomes.33
- A variety of high-impact practices that require resources. The Center for Community College Student Engagement has found a positive relationship between thirteen “high-impact” practices and positive student outcomes: orientation; accelerated developmental education; first year experiences; student success courses; learning communities; academic goal setting and planning; experiential learning beyond the classroom; tutoring; supplemental instruction; proper assessment and placement; registration before classes start; alerts and interventions; and structured group learning experiences.34 Numerous other studies find positive results from redesigned developmental education, academic support services, and other interventions.35
The long-term benefits to society of increased community college completion are substantial. Setting aside the considerable benefits to individuals who can see their chances of flourishing increase by completing a community college degree, the returns to the general taxpayer are very large.
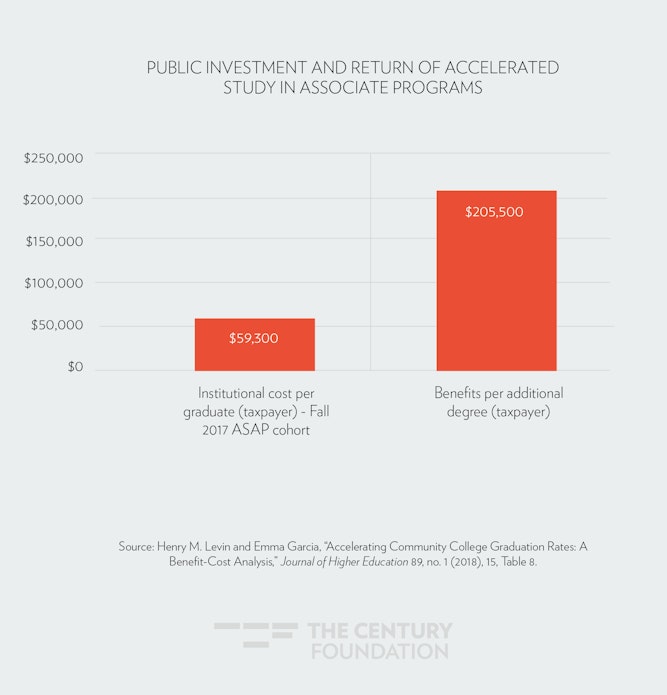
Take, for example, a taxpayer cost–benefit analysis of CUNY’s ASAP program. In a 2018 study in the Journal of Higher Education, Columbia University’s Henry M. Levin and Emma Garcia of the Economic Policy Institute and Georgetown University found that for each additional $1 invested in ASAP, the return to the taxpayer was $3 to $4.36
Levin and Garcia estimate the lifetime earnings of an associate’s degree holder to be $964,500 on average, compared with $630,300 for a high school graduate, for a net gain of $324,100.37 Based on those estimates, they calculate that an associate’s degree recipient will pay $165,400 more in taxes over her lifetime and will cost taxpayers $40,100 less in health expenditures, welfare and public assistance, and criminal justice costs. The total public benefit over a lifetime is $205,500. The institutional cost of ASAP per graduate for the fall 2007 cohort was $59,300, yielding about $3.50 to the taxpayer for every $1.00 invested.38 (See Figure 8.) Although the analysis focused on ASAP’s ability to boost completion rates, the underlying measurements of the benefits of raising community college completion apply to any program that does so.
Figure 8
The Need for More Research on Funding Levels
Because there is strong evidence that current community college funding levels are too low to permit colleges and their students to achieve what policymakers desire and expect, and that certain investments are likely to increase outcomes, we recommend short-, medium- and long-term strategies for reform.
In the short term, state and federal policymakers should begin to increase funding for community colleges to improve opportunities for students. While the precise level of funding community colleges need to adequately meet their goals is yet to be determined, the evidentiary basis for the returns to certain increased public investment is strong, so legislators need not wait to act. (In Section 3 of this report, we outline specific recommendations for a new federal–state partnership to boost community college funding.)
In the medium term, federal and state legislators can begin to implement a strategy of supporting rigorous research to help guide the amount and types of investments to be made. Legislators are now in a difficult position, having to make decisions about higher education investments without sufficient research guidance. There is shockingly little research on a basic question: What level of funding could produce adequate community college education outcomes? The dearth of research is particularly remarkable given the extensive body of research that has been conducted in the K–12 arena on the same question.
For almost four decades, researchers have studied the question of how much funding is necessary to produce an adequate elementary and secondary education, including an appropriate funding premium to address the needs of low-income students.39 A 2008 review of thirteen studies found that the cost of educating socioeconomically disadvantaged students ranged from 22.5 percent to 167.5 percent more than the cost of educating students with no extra needs.40 In a 2015 analysis, the Education Trust said a 40 percent premium for educating these students should be considered “conservative,” given research finding that it costs twice as much to educate low-income students to the same standards as more-affluent students.41
Today, at the state level, thirty-seven K–12 funding formulas recognize that students with greater needs deserve greater resources.42 (See Figure 9.) Research on the level of resources needed for community colleges—and accompanying public policy responses—are by comparison in their infancy.
Figure 9

Finally, in the long run, we recommend that policymakers use the evidence of these research-based efforts to guide future funding decisions, in all likelihood increasing support for community colleges and their students.
Framework for Estimating Adequate Funding for American Community Colleges
We believe it is crucial that scholarship on costs at the community college level catch up with that for similar K–12 research. Federal and state policymakers and foundation officials should commission research to estimate the true costs of community college education. The task is complex, but after carefully considering and discussing the challenges, we have concluded that it is both possible and necessary for researchers to undertake such a study.
In this section, we delve into some of the issues researchers will face and make recommendations for a framework of how to proceed. We begin by outlining four common steps that researchers take when approximating the true costs of an adequate K–12 education. We next identify four key differences between the K–12 and community college sectors that will require scholars to adjust their methodology. We then review a few preliminary attempts to estimate costs in higher education. Finally, this section culminates in an eight-part framework for conducting studies that estimate the costs of a community college education.
Costing-Out Studies in Elementary and Secondary Education
Since at least the early 1980s, scholars and consultants have been engaged in efforts to estimate the costs of providing adequate educational programs and services toward achieving adequate educational outcomes for children. The pace of progress on estimating the costs of adequate K–12 education accelerated with the proliferation of state accountability systems and outcome measures from the 1990s forward, coupled with increased use of those outcome measures in the context of litigation challenging the adequacy of public school funding under state constitutions. Those legal challenges forced the issues of (a) defining state constitutional obligations, (b) identifying measures of student outcomes which might be used to indicate equity and adequacy, and (c) developing reliable and valid methods for determining the costs associated with meeting measurable outcome goals. Even with improved empirical evidence, and even in the presence of judicial orders, the process by which state school spending levels and distributions are determined remains political, complicated and imperfect.
In this section, we outline four major steps in conducting cost analyses, drawn from decades of experiences in elementary and secondary education.
Four Steps in Costing Out a K–12 Education
Step 1: Researchers in collaboration with policymakers and other key constituents identify the desired outcomes of the education system, a prerequisite for determining costs.
Step 2: Researchers in collaboration with policymakers and other key constituents identify the relevant unit of analysis for estimating those costs, which might focus on aggregations of institutions (states or school districts), specific institutions or organizations (schools, service providers, and so on) or programs and/or services within those institutions.
Step 3: Researchers determine the appropriate methods for best identifying the costs associated with the desired outcomes, given the units of analysis.
Step 4: Researchers identify the key cost drivers (including student disadvantage) that influence the costs of achieving the desired outcomes, across settings, institutions, programs and services, and the students they serve.
Step 1. Identify Desired Outcomes
In order to estimate costs, the first step is to identify with some precision the desired outcome. As Bruce Baker and Jesse Levin explain in their background paper for this working group report, much of the recent interest in estimating the costs of meeting specific educational outcome standards in elementary and secondary education stems from the role of state courts in determining whether adequacy requirements of state constitutions have been met.43 In recent decades, several states’ high courts have determined that their state constitution’s education article requires the legislature to provide sufficient funding to meet some minimum standard. In a handful of cases, state legislatures—either prior to, or in response to, legal challenges and court orders—have engaged outside consultants to estimate the costs of meeting those standards and provide guidance on state school finance systems. Specifically, the consultants are hired to provide guidance on how to make those systems compliant with constitutional requirements, as articulated in court orders. (Similar state constitutional obligations arguably extend to remedial courses in community colleges to the extent that material was supposed to be taught in K–12 schooling.)44
As Baker and Levin explain, constitutional requirements are often stated in vague terms, and judicial rulings regarding constitutional requirements are at times only marginally more precise. Neither is sufficient for making the leap to establishing an empirical framework and setting up an analysis to determine costs of meeting those requirements. Typically, the responsibility for specifying measurable outcomes and standards falls on state legislatures and/or state boards of education and departments of education. State courts may prod legislators to make use of standards, which they have already legislated. Further, in the absence of judicial intervention, state policymakers may work with external consultants to operationalize state standards and set goals for cost analyses.
Elementary and secondary education standards and accountability systems tend to be based primarily on (a) standardized assessments of reading and math from grades three to eight, and sometimes grades ten and/or eleven, and (b) other measures, such as four-year high school graduation rates. Standardized assessments often have assigned “cut-scores” that declare whether each student’s performance is “proficient” (meeting basic standards) or not, and in some states, students must pass a common high school exam in order to receive a diploma. Increasingly, states have also adopted measures of test score growth, and in some cases test score growth conditional on student need (comparing students of similar backgrounds and needs). These systems of measures and indicators, though limited, often serve to provide convenient benchmarks for judicial analysis and for empirical estimation of “costs.”
Step 2. Identify the Relevant Units of Analysis
After identifying outcome goals, researchers must determine the appropriate unit of analysis. K–12 education systems largely strive to provide a common educational program, often with the dominant purpose of preparing students for their next level of education. As a result, cost analyses can focus on institutions as a whole—schools or districts—as their unit of analysis, with a singular set of goals, measured academic standards, and outcomes. Typically, at the K–12 level, researchers set aside distinctions having to do with high school vocational programs and other specialized schools (for example, magnet schools, standalone special education schools, and so on), even though those schools have more varied goals and corresponding programming.
In most cases in elementary and secondary education, cost analyses focus on state mandated outcomes and constitutional obligations, which are achieved, in turn, by local public school districts. However, the unit of analysis may vary depending on the costing-out method chosen (see Step 3, below). Most input-oriented cost analyses—those that tally up the resources needed for delivering specific programs and services—focus on schools within districts, and then add administrative overhead costs to determine district unit costs. Most outcome-oriented approaches, by contrast, focus on the district as the unit of analysis, where the district and its board of education are primarily responsible for financial management of local public schools, and where revenue arrives and expenditure allocations are determined. However, increasingly, even cost modeling approaches are including school-level analyses, in part to begin to attempt to reconcile findings between input and outcome-oriented methods through hybrid approaches. It is also feasible to take these approaches to the next lower level of exploring the costs of specific programs and services within institutions. Input-oriented approaches require as much to arrive at institution-level costs.
Step 3. Determine Appropriate Costing-Out Methods
In addition to identifying goals and the appropriate unit of analysis, researchers must identify the cost analysis method that best suits the policy objective; that is, that best enables estimation of the full costs of meeting the collectively agreed upon outcome goals. Selection of methods may depend in part on the measurability of (and available measures of) those outcome goals. As alluded to above, method types can neatly be categorized as outcome-oriented and input-oriented approaches.
- Outcome-oriented analyses start with data on both student outcomes and the specific programs and services used by institutions to generate the outcomes. The costs of attaining these outcomes across different site settings—defined by characteristics such as student needs and size of operation—are arrived at using statistical estimation techniques referred to as cost functions.
- Input-oriented analyses first identify the staffing, materials, supplies and equipment, physical space, and other elements (inputs) required to provide educational programs and services capable of producing the desired outcomes in a variety of settings (again, defined by characteristics such as student needs, size of operation, and so on). The inputs are then costed out and applied to calculate the costs of providing programming and services across different sites.
Outcome-oriented analysis can only be applied where outcome goals have been measured quantitatively over time, and where adequate data exist on expenditures, cost, and student need factors. However, even where these data are limited but still sufficient, cost modeling can be used in conjunction with input-oriented methods to develop a fuller picture of cost-efficient deployment of resources, programs, and services. In the best-case scenario, as discussed in the Baker and Levin background report, data are sufficiently rich enough to do extensive cost modeling and to combine and reconcile those findings with input-oriented estimates of institutional costs.
Combining the two approaches may be ideal, because it would provide the right information, where it is needed: outcome-oriented analyses provide information to legislators about the amount of money required to achieve a given set of goals, while input-oriented approaches give school leaders guidance on where to invest resources.
Step 4. Identify Cost Drivers (Including Student Disadvantage)
An important fourth component of the K–12 analysis involves identifying cost factors that may vary from school to school (depending on, for example, the size of the school or its geographic location) and depending on such factors as the proportion of students who are disadvantaged. As discussed by Baker and Levin in their background paper, which factors influence the costs of achieving desired outcomes are relatively well understood in K–12 education, but our knowledge of those factors continues to evolve. We know those factors to fall into two distinct groups—student need factors, and other exogenous cost factors. Further, some student need factors operate at the level of the individual student and have specific remedies in terms of programs and services, while other student need factors operate at the level of the collective student population. For example, a student with a specific disability or language barrier might need very specific supports, whereas an institution serving a generally higher poverty student population, from less educated households, might require more generalized resource intensive interventions (expanded early childhood programs, smaller class sizes, and so on). Finding the best measures to characterize need and to identify other exogenous cost pressures (competitive wage variation, economies of scale, population sparsity, and so on) is an important step for either input-oriented or outcome-oriented analysis.
Differences between the K–12 Sector and Community Colleges
The four steps employed in K–12 costing-out exercises can provide a foundation for beginning to think through how such research could be conducted at the community college level. But there are critical differences between the sectors that will affect the analysis. In seeking to apply K–12 methodologies to community colleges, four fundamental distinctions between postsecondary education and K–12 education are particularly important. Each of these four differences presents unique challenges for estimating the cost of providing an adequate community college education, as detailed below.
Difference 1. Higher Education Involves More Choice on the Part of Students
At the K–12 level, attendance is mandatory and students have less choice of programs to pursue. With higher education, students have choice of whether or not to pursue postsecondary education, at which institution to pursue such education, and greater choice about which programs to pursue should they decide to enroll in community college.
In higher education, we must also consider access to institutions as a potential outcome of providing more adequate programs and services.
Unlike K–12 education, higher education is not compulsory. An adequate K–12 education system must provide sufficient programs and services for all children to achieve desired outcomes. In higher education, we must also consider access to institutions as a potential outcome of providing more adequate programs and services. That is, who comes, who stays and who completes? An adequate postsecondary education system is one that provides greater access to more diverse student populations than presently exists, and provides all who enter with equal opportunity to persist and complete.
It is insufficient to measure success rates of only those students who presently access higher education. Higher education institutions that are less accessible, academically, financially or geographically, may end up serving more advantaged student populations to begin with, and thus may appear more successful by virtue of who they serve rather than the quality of programs and services they provide.
Difference 2. Higher Education Has Fewer Standardized Tests as Measures of Academic Success
While K–12 education defines outcomes largely by test scores and graduation, higher education does not have widespread testing, requiring researchers to identify different outcome goals.
Unlike K–12 education, community colleges do not have a standard way of assessing learning gains. Outcome measures and data systems in K–12 education proliferated throughout the 1990s and 2000s, enabling statistical analysis of those outcomes, factors affecting those outcomes, and the costs of meeting those outcomes across varied settings and children. Commonly collected and reported outcome measures include state standardized assessments, originally in reading and math (grades three to eight), and later encompassing science and social studies, and extending to high school exams. Most recently, many states have moved toward assessments of common standards, increasing the possibility of estimating costs across multiple states concurrently. States also collect school and district (institution level) data on graduation rates, attendance rates, and, in some cases, college attendance and persistence.
Because the goals of postsecondary education are varied, there do not exist similar common assessments of knowledge and skills. In fact, one purpose of the intermediate measures of knowledge and skills collected in the K–12 system is to be predictive of success in core courses at the postsecondary level. But success in more specialized postsecondary degree and certificate programs is perhaps better measured by outcomes that occur later in life, after postsecondary schooling has been completed—such as achieving relatively greater success in the labor market. In turn, to the extent we cannot measure directly or consistently those outcomes occurring after postsecondary schooling, we must seek intermediate measures within the postsecondary system that may be predictive of those outcomes. (We discuss proposed outcome measures at length below.)
Difference 3. Higher Education Has More Varied Programming and Program-Specific Costs within Institutions
Whereas K–12 has comparatively far more uniform programming and cost structures within schools, higher education has greater variation within colleges for different credentials and within different academic disciplines. These credentials and programs differ in costs and goals so researchers will have to sort through whether the appropriate unit of analysis should be the college department, the degree or certificate program, or some combination of these.
At the K–12 level, schools are often an obvious level of analysis, but community colleges typically offer a variety of programs that raise questions about the appropriate unit of analysis. Unlike K–12, where most students in a school have roughly common goals (such as developing reading and math skills), within community colleges, students have varying goals. Some seek degrees, others certificates. Some seek specialized skills in programs such as nursing, while others seek general education skills that may prepare them to transfer to a four-year institution. The student choices and varied pathways involved in postsecondary education systems increases the complexity of evaluating costs of achieving desired outcomes for these systems. But it also provides unique opportunities to better understand how students’ choices, coupled with institutional structures and supports, affect outcomes.
Difference 4. Higher Education Has Fewer Essential Needs Programs in Place That Provide Supports Known to Improve Student Outcomes, Especially for Marginalized Student Populations
For minors in the K–12 system, federal, state, and local policy provides for breakfast and lunch (free and reduced meals programs), health care (the Child Health Insurance Program, known as CHIP), and transportation (free bus service for students who cannot walk to school). Analogous higher education programs are sometimes built into financial aid programs but are often not well developed.
Unlike K–12 education, where supports for nutrition, health, textbooks, and transportation are considered essential programs, at the community college level, those supports, while vitally important, are frequently not provided to students.
In elementary and secondary education, we have come to realize that the provision of an equitable and adequate system for all eligible children requires the provision of more than merely academic programs. Children must be transported to those programs, including students who do not have family supports to provide transportation. Children must be well fed in order to be successful in school, and thus we provide subsidized lunches and breakfast for children from low-income families. In many cases, state and local systems provide additional supports, including physical and mental health screenings, after-school programs, and a variety of parent and community supports. Some of these “supplemental” or “wrap-around” services come about with increased knowledge and awareness that these supports contribute efficiently to student success on measured outcomes. At the K–12 level, taxpayers also provide textbook materials free of charge.
It is similarly the case that college-aged students (traditional or nontraditional) have inequitable access to transportation, and may also lack food and/or housing security. These are essential elements to student success. Adults too must get to school (and/or have sufficient technology to log in online), be well fed, and have housing security to ensure their persistence and completion of programs. In addition, they must be able to afford materials and supplies (textbooks). Sometimes supports for textbooks, meal plans, and housing are incorporated into financial aid programs, particularly at four-year residential colleges, but community college students often lack access to these types of assistance. As discussed further below, since these supports have not historically been broadly and uniformly provided within the public higher education system, identifying the cost of doing so at public expense is necessary.
Early Efforts to Apply Costing-Out Methods to Higher Education and Community Colleges
Perhaps because of the complexity of applying K–12 costing-out techniques to higher education, few such studies have been conducted to date. Instead, community college studies tend to focus on existing levels of expenditures rather than on their costs to achieve a given objective. As Baker and Levin’s background report emphasizes, expenditure studies are more straightforward because they do not require a measure of outcome goals as cost studies necessarily do. Expenditure studies merely characterize existing expenditures of institutions, given whatever outcomes they presently achieve. That said, expenditure data could be used in combination with outcome data, and data on school contexts and students, to infer the specific costs associated with achieving current outcome levels, and to extrapolate costs associated with achieving different outcome levels.
In this section, we begin with a discussion of existing expenditure studies, then review two early efforts to begin to assess costs.
Expenditure Studies
Researchers have conducted several expenditure studies on postsecondary institutions in general and community colleges in particular, using national data sources either directly from the Integrated Postsecondary Education Data System (IPEDS), or as compiled for the Delta Cost Project.45 Most recently, Tammy Kolbe and Bruce Baker conducted two studies of the levels, distribution, and trends in community college expenditures by state.
The first study evaluates the level and progressiveness of total spending and instructional spending per pupil for community colleges by state. Specifically, Kolbe and Baker explore whether and to what extent community colleges in counties with lower-income populations spend the same (flat), less (regressive), or more (progressive) per pupil than community colleges in higher-income counties. The study establishes a baseline for understanding present spending levels across states, and for knowing which states have generally more progressive versus regressive spending.
Most existing community college systems do not systematically provide additional funding to community colleges in lower-income settings.
The second expenditure study benchmarks the level and progressiveness of spending in state community college systems against K–12 spending.46 As with the first, the results vary widely across states and provide a baseline for understanding state policy and contextual differences. In addition, the findings allow for a comparison of the level of commitment to community colleges relative to elementary and secondary education systems, for which a broader collection of comparative studies exists. Like the first study, this study considers only existing spending, toward existing outcomes (that is, it does not attempt to calculate the costs of providing educational adequacy). Both analyses confirm that most existing community college systems do not systematically provide additional funding to community colleges in lower-income settings. Many are neutral at best, and still many others are significantly regressive.
The Real Cost Project (2003)
One notable example of “cost” analysis applied to a community college system is the Real Cost Project, conducted on behalf of the California Community College system in 2003.47 The Real Cost Project was similar to early elementary and secondary education cost studies, which, instead of focusing on measured student outcomes, focused on programs and services, including additional supports that were presumed (preferably based on research) to lead to desirable outcomes. The approach lays out prototypical institutions based on a collection of best practices. Those prototypical institutions may be developed through consensus-building activities with focus groups of informed professionals, and/or expert knowledge of research-based practices.
The Real Cost Project involved creating similar prototype institutions, as described here:
The prototype is not the median college, but it is also not a baseline institution which has only those characteristics shared by all colleges. That approach would tend to understate the important local context of rural and urban colleges, and obscure one of the purposes of the Real Cost Project—to capture the unique cost structure associated with the diverse student population of the California Community Colleges. So while the prototype does not describe any actual college perfectly, it is a reasonable representation of typical demographics, generally as reflected in statewide enrollment patterns. As a result, the prototype college looks like California in its relative composition of academic preparation, ethnicity . . . and gender, disability, income status and public assistance, and part-time/fulltime status.48
In addition, the resources prescribed for the prototype were driven by a set of quality indicators, albeit not necessarily outcome measures:
These Quality Indicators represent an integrated approach to quality student learning and achievement. Group learning, team teaching, learning communities, intensive writing across the curriculum, and individualized interaction between faculty and students are possible at the prototype college because of the combination of smaller classes, a shift in faculty time allocation toward students, extensive professional development and training in pedagogical strategies, and a substantial change in the curriculum. Every student desiring to transfer to a baccalaureate university would have a meaningful transfer and educational plan—more than merely a ministerial signature on a form. These are essential attributes of a quality education for the broad diversity of students at the California Community Colleges.49
Using a number of quality indicators (such as class size, high-quality faculty and staff, need for counseling and health services, equipment, and technology), the group derived a cost estimate of $9,200 per full-time equivalent student—considerably higher than the actual amount spent around the time (2003), which was less than $5,000.50
Baker/Morphew Resource Cost Modeling (RCM, 2007)
In a 2007 analysis, Bruce Baker and Christopher Morphew developed the conceptual thinking around applying cost modeling to higher education by tackling an important complexity: that unlike K–12 education, where course taking is largely prescribed, college students have greater choice in course selection. Specifically, the authors examined how “resource cost modeling”—an input-oriented costing-out approach used at the K–12 level—could apply to higher education, given the varying course-taking pathways students pursue to earning their degrees.51
Cost estimates must take into account student pathways to program completion by considering all of the costs associated with providing access to those specific pathways and associated resources.
The authors point out that if we are to look at outcome measures such as program or degree completion, one must consider not only the way in which institutions organize their resources, but also the varied ways in which students access those resources toward degree completion. For example, students completing a program in mathematics navigate their way through general education courses as well as math courses, drawing on resources across units within institutions, not merely the higher-level unit offering the degree or credential. Among those students pursuing degrees in math, there may be a handful of most common pathways (which represent resource consumption patterns) to completion. Students may also access varied additional supports—academic, residential, and so on—as they navigate their way toward program completion. A comprehensive and precise estimate of the costs associated with program completion must account for the ways in which students access resources along the way. That is, cost estimates must take into account student pathways to program completion by considering all of the costs associated with providing access to those specific pathways and associated resources. The study provided an important advance in how K–12 techniques could apply to the very different world of higher education.
Framework for Applying K–12 Methods to Community Colleges
The earlier efforts at costing out a college education provide a basis upon which researchers can build in order to try something that is unprecedented: a full-fledged study to estimate the costs of an adequate community college education. Our goal is to advance the thinking on this question by providing a framework for applying cost estimation methods from elementary and secondary education to community colleges, recognizing the distinctions between the two.
Below, we identify eight key decision points that researchers will face in applying well-established K–12 analysis principles to the community college sector. For each challenge, we make recommendations providing our best advice on how to proceed.
Eight Issues in Applying K–12 Methods to Community Colleges
2. In further defining goals, what is the best way to articulate adequate outcomes? Should researchers consider intermediate goals, such as completion, ultimate goals such as labor market outcomes, or some combination of the two?
3. In defining goals even further, how should researchers assess the appropriate level of success to be costed out? Not every high school student in a state is likely to complete a community college degree or certificate or higher, for example, so how should the appropriate degree of success sought be determined?
4. How should researchers capture costs across different educational units (program-level versus institutional-level costs)?
5. Should researchers employ an input-oriented or an output-oriented analysis, or a hybrid approach?
6. What adjustments to the prototypical community college costs should be made for institutions with higher student need factors? Should need measures include economic disadvantage, academic preparedness from high school, first generation college status, nontraditional/adult learner status, race, and/or other factors?
7. How should researchers account for student needs such as food, housing, transportation, and childcare?
8. What adjustments should researchers make to the cost of a prototypical community college education for other variations in cost related to region, scale, program, and the like?
Issue 1: In beginning to define goals, how should researchers address the non-mandatory nature of attendance in higher education? Because students are not required by law to attend community college, how do we define goals in a way that incorporates access?
In K–12 education, schooling is typically compulsory for students through age sixteen, so an outcome metric—such as high school completion—starts with a base of students that is universal. In the community college sector, by contrast, attendance is not mandatory, so a measure that looked at completion rates would not tell us whether a college is doing a good job of providing access to students (by recruiting them, offering courses that are in demand at convenient times, and so on). Indeed, a system that defined outcomes strictly in terms of proportion of beginning students who complete could provide a perverse incentive of encouraging community colleges to recruit only the most prepared students, screening out those with less preparation.
Recommendation 1: Any evaluation to determine the costs of providing an adequate system of community colleges must include, as one of many outcome measures, indicators of the population served, and ideally should capture the breadth and equity of access. One might consider, for example, the needs for postsecondary education across economic, geographic, racial, and ethnic groups, and the system’s equity of access. And one might evaluate the extent to which the population served sufficiently represents disadvantaged student populations in the relevant service region.
To calculate the cost associated with a particular goal requires that researchers define the outcome measures and the levels denoting accomplishment of the goal. In this case, to determine the types and quantities of resources necessary to successfully recruit and serve a particular population of students requires that one first define the target population. To this end, a key step would be to perform a descriptive analysis of the composition of enrollment with respect to student characteristics (for example, low-income status, first-generation college enrollee, ethnic minority, and so on) across college campuses throughout the state.
Recruitment targets would then be set across the groups, which would be included as part of the goal definition. Note that results of the descriptive analysis would be used as a baseline. That is, the chosen targets may not be simply to achieve the average composition of enrolling students, but rather to significantly improve recruitment among student groups who are currently underrepresented.
Costs of the efforts involved in an expanded targeted recruitment effort, as well as the different and possibly additional supports necessary to adequately serve the new composition of enrolling students, could then be calculated through an input-oriented method, such as professional judgment.
Issue 2: In further defining goals, should researchers consider intermediate metrics, such as completion, or ultimate goals, such as labor market outcomes, or some combination of the two?
Among the thorniest issues researchers face in applying K–12 costing-out techniques is articulating a clear set of goals for adequate outcomes. K–12 cost analyses have the convenience of falling back on short-run academic outcomes as their goal, as those outcomes are predictive of success at the next stage of their education. Many community college programs are career-specific, and thus the desired outcomes are employment and income. Should researchers consider labor market outcomes as the appropriate measure, intermediate measures such as retention and completion and transfer, or some combination of the two?
In their background report for the working group, Anthony Carnevale, Jeff Strohl, and Artem Gulish of Georgetown University make the argument that economic adequacy is a necessary condition to achieve educational adequacy. In making this argument, they suggest that labor market outcomes are the most appropriate metric. Because delivering economic self-sufficiency is critical, they argue, a community college education should help students attain skills that will enable them to earn a living. In American society, where government provides few supports to those not in the labor market, human flourishing requires that individuals be economically self-sufficient. Merely providing resources to allow students to complete a community college certificate or degree is an insufficient measure of success, Carnevale and colleagues argue, because completion does not guarantee adequate labor market outcomes.
What level of labor market success is necessary to allow for human flourishing in contemporary American society? Carnevale and colleagues operationalize their approach by suggesting a two-part test for economic self-sufficiency: (1) “a program must leave its graduates earning more than $35,000 per year ten years after they have completed it”; and (2) “over that ten-year period, that program also must provide its graduates with a sufficient earnings premium, compared to the earnings of workers with only a high-school diploma, to cover the program’s total cost to the student.”52 This second requirement typically translates into a minimum salary of $42,000.53 The authors say adjustments to these requirements should be made to account for cost of living variations by region, and that race and gender discrimination in the workplace, and society’s need for people to enter the intellectual and caring professions, should be considered in using earnings outcome metrics.
Carnevale and colleagues argue this two-part standard provides the minimum economic self-sufficiency necessary for human flourishing because it allows for entry into the bottom rungs of the middle class. A $35,000 salary for a full-time worker generally translates into a $50,000 income for a household. They further note that because there are so many different costs associated with achieving completion outcomes in different programs, it is not possible, using a completion metric, to estimate a single cost for a community college education.
We think this approach has many strengths. Monitoring these data makes sense, and the use of the measures as minimal thresholds could be appropriate in some circumstances. But as Carnevale and colleagues themselves note, a number of complications arise with operationalizing a stand-alone labor market outcome goal.
For one thing, the ability to achieve these economic targets is not in the control of the community colleges alone. Linking employment and income to program quality is complicated by regional labor market variations, employment supply and demand, and temporal cycles. These outcomes depend on economic conditions, and labor markets that can fluctuate more rapidly than institutions can adapt.
It is questionable whether we would want our community colleges to try to adapt to every cyclical shift in employment demand.
Moreover, it is questionable whether we would want our community colleges to try to adapt to every cyclical shift in employment demand. Specifically, while earnings growth might be one measure upon which to judge community college performance, it would be undesirable to structure goals such that community colleges are put in the position of determining program offerings based only on their expected labor market returns.54 This could result in a significant narrowing of program offerings and there is no guarantee that community colleges would do a good job at precisely forecasting returns to specific degrees or credentials.
In addition, the ten-year lag between the observed goal and the programmatic investment complicates the application of this standard.
Moreover, while the $35,000 threshold is appropriate for estimating the costs of an education that is adequate for generating what we broadly consider to be “good jobs,” we acknowledge that this threshold is not universally achievable. Indeed, it is based only on those who currently complete community college credentials, who constitute less than 40 percent of all those currently enrolled—and only two-thirds of that group now achieve this standard. (See issue 3 below, discussing appropriate rates of success for which policymakers should strive.) Moreover, if we successfully increase access and enrollment in community college for disadvantaged or low-achieving groups who do not now attend, attainment of the $35,000 goal could fall even lower.
To be clear, the working group approves of all investments in postsecondary education that are cost-efficient and materially improve the lives of all students, even if the subsequent earnings of these students fall short of helping of meeting the $35,000 standard. Policymakers should always consider the public’s “return on investment,” which examines the increase in earnings generated by education measured against the cost of the investment.55 For instance, a short-term and low-cost certificate that raises some students’ earnings from $10,000 to $15,000 annually might well be cost-efficient and appropriate for those students, especially those who are not in a position to pursue or attain more substantial credentials.
Accordingly, we believe that the attainment of $35,000 in earnings should be considered the relevant standard of an “adequate” education for some substantial part of the community college population, while a somewhat different standard—consistent with cost-efficiency and significant earnings improvements for those with currently low earnings—is acceptable for those not able to attain associate degrees or the best-paying certificates anytime soon, as long as there are clear pathways to further education. Exactly what these alternative standards should be, and for how many students each standard is appropriate, could be determined by further research.
We are also concerned about the effect of predicating the goals of community colleges on a single result—labor market outcomes. Public opinion research suggests individuals have a wide variety of rationales for pursuing community college.56 Individuals and the public derive utility from education for reasons other than pecuniary gain (for example, to satisfy one’s curiosity in or passion for a subject), and society invests in education in order to produce better citizens and parents, in addition to better workers. In this way, education is similar to other public goods, such as parks, that public dollars regularly support.
Furthermore, potential income varies by the program or degree sought, which in turn is a function of the interests and desires of individual students. It may well be that the expected income for a graduate of a computer technology training program exceeds that for the veterinary technician from the same institution. But the animal lover who truly desires to be a veterinary technician might find little life satisfaction in maintaining and troubleshooting a bank of computer servers in a corporate basement. If the community college will not offer veterinary programs, she may seek that program elsewhere, perhaps through a private online provider who will offer an inferior program. At the very least, the outcome measures must be sensitive to student choices, and must vary by program, degree, certificate, or academic trajectory. A floor of $35,000 to join the middle-class (or $42,000 to equal the total cost of a program) may not cover important trajectories that students desire.
At the very least, the outcome measures must be sensitive to student choices, and must vary by program, degree, certificate, or academic trajectory. A floor of $35,000 to join the middle-class (or $42,000 to equal the total cost of a program) may not cover important trajectories that students desire.
In part for these reasons, as Baker and Levin point out, most existing mechanisms of accountability for community colleges—such as performance-based funding—use proximal measures, such as completion, rather than distal measures, such as labor market outcomes.57 Such intermediate measures, while imperfect, avoid the complications associated with a labor market outcome measure and are typically associated with improved earnings. At the same time, we agree with Carnevale and colleagues that proximal measures by themselves are not sufficient, because completion of a degree that does not support adequate earnings cannot be considered a benchmark of success. We therefore suggest a third path that brings together proximal and distal outcome measures.
Recommendation 2: Proximal measures such as successful completion of a program should serve as the primary goal.58 However, this measure should include a validation check that these proximal measures translate into positive labor market outcomes for students leaving the particular programs and institutions. In other words, we recommend bringing together the recommendations in the two previous reports by Carnevale, Gulish, and Strohl and by Baker and Levin. Given practical concerns, preliminary attempts to estimate the cost of adequate community college programs should focus on intermediate measurable outcomes, such as access, persistence, and completion toward degrees, certificates, or successful transfer (followed by completion). However, degree and certificate completion measures can be validated by their relation to longer-term economic outcomes.
That is to say, we suggest an approach that takes Baker and Levin’s preference for intermediate, proximate outcomes and the preference of Carnevale, Gulish, and Strohl for distal outcomes and meets in the middle. Researchers would provide an estimate for what it costs to achieve a reasonable level of completion in a particular program. That information is important given that completion, whatever the labor market outcomes, can have independent value. Separately—looking at labor market outcomes for graduates of this program across a variety of community colleges over time—researchers would provide an estimate of what it costs to make it likely that graduates in the program will also meet a labor market wage test. Policymakers would have information about costs associated with meeting the completion standard on the one hand, and the labor market standard on the other, and individual states could decide the relative weight to be accorded to each factor at any given point in time.
Issue 3: In defining goals even further, how should researchers assess the appropriate level of success to be costed out? Not everyone in a state is likely to complete a community college degree or certificate or higher, for example, so how should the appropriate degree of success sought be determined?
Whether using proximate goals (degree or certificate completion), distal goals (such as a $35,000 annual salary), or some combination, public policy goals do not expect perfection. It is unlikely that 100 percent of state residents will complete a degree or certificate, or that 100 percent of community college graduates will make more than $35,000 a year, so policymakers must set ambitious but realistic goals. Today, for example, 67 percent of community college graduates with an associate’s degree make $35,000 a year ten years after graduation,59 so a public policy goal might be to raise that level above 67 percent, but aim for something less than 100 percent.
How should such goals be set? Researchers could model a particular success rate for associate’s degree holders, or provide cost estimates for a range of success rates—75 percent, 85 percent, and 95 percent, for example. Similar percentages would need to be calculated for those earning certificates with reasonable labor market returns.60 In determining the range, researchers could examine existing success rates as a benchmark, and then look to projections for employer demand of skill levels in the future. Alternatively, policymakers could conduct surveys of stakeholders to determine acceptable success rates. As outlined below, we recommend a combination of approaches.
Recommendation 3: Researchers should cost out not a single success rate, but instead focus on a range of possible levels of success, guided by research on community needs and public engagement of stakeholders.61 In determining what the acceptable range might be, we suggest the definitions of success be informed by solid analysis of existing access and success measures across campuses in a community college system. In addition, this question can be greatly informed through authentic public engagement where individuals with a stake in community college success rates are able to provide input as to what they perceive as an appropriate goal. Public engagement of this sort has been undertaken in K–12 cost studies. For example, in the adequacy studies for New Mexico and New York, researchers held public engagement forums throughout the state to promote input from parents, teachers, business leaders, taxpayers, and other citizens as to what constitutes an adequate education (that is, how the goals should be defined). For the New Mexico study, two surveys were administered to all legislators, superintendents, and principals in the state, and to the general public, respectively.62 We recommend a similar approach with respect to determining success goals for community colleges.
Issue 4: How should researchers capture costs across different educational units: at the program level, institutional level, or some combination?
As discussed earlier, in K–12 costing-out studies, the unit of analysis is typically a school district or an individual school because there are common outcome goals and roughly common cost structures for programs. But community colleges are different. Outcomes (especially labor market outcomes) can vary dramatically by programs within community colleges, as can costs associated with different certificate and degree programs (for example, welding versus general education).
At the same time, students do not take courses only in their program of study. As Baker and Morphew suggested in their 2007 study, students pursuing any specific degree or program goal access a distribution of coursework across multiple units (departments) within an institution. Likewise, there are common costs (for example, administration) that run across individual programs, so it is difficult to isolate costs solely by particular programs.
We again recommend a hybrid approach. This method merges the program-level and institution-level analyses through an examination of student pathways.
Recommendation 4: Because costs vary dramatically by program, and students take some of their classes in different programs, researchers should use transcripts to identify typical pathways and associated costs.Then, after the program-level cost analysis is completed, researchers can also compute the costs at the institutional level by adding up the participants in various programs and apportioning institutional costs that cut across programs (for example, for student services, campus infrastructure, and so on).
Deeper exploration of student pathways will aid in identifying those resources accessed by certain students in certain contexts that result in their most efficiently completing program requirements. Exploration of resources associated with student pathways through institutions may be supplemented with exploration of the ways in which resources are organized and delivered within and across different types of institutions.
Persistence and completion toward students’ degree, certificate, or academic transfer goals must be analyzed from the perspective of the pathways (course selection, sequence) students take through community colleges. Further, one can use student transcript data to identify which pathways frequently taken by students lead to greater success rates and whether the match between pathway and successful outcomes differs by the backgrounds of students.
Issue 5: Should researchers employ an input-oriented or an output-oriented analysis, or a hybrid approach?
As discussed earlier, step three of the K–12 costing-out process looks at whether to use an approach that is outcome-oriented, income-oriented, or employs a combination of the two. Outcome-oriented analyses use “cost functions” to see what resources have been necessary at institutions to achieve a given result (such as access and completion). Input-oriented analyses, by contrast, begin by asking experts to identify key ingredients (staffing, materials, supplies and equipment, physical space, and other elements) required to achieve a particular result. These ingredients are then costed out.
Both approaches offer advantages. Outcome oriented studies provide validation that a given level of expenditure has resulted in certain outcomes, but provide little guidance on where institutions should allocate resources. Input-oriented studies, by contrast, rely on experts to inform where money should be spent but often lack the real-world validation that these expenditures will achieve a given result.
A third approach draws upon elements of the input and output methods.
Recommendation 5: Researchers should draw upon the best elements of the output-oriented and input-oriented approaches in an iterative process. By combining the two approaches, researchers can determine what particular spending levels have been able to produce actual outcomes, but also providing guidance to colleges on what ingredients are most effective.
For outcome-based modeling, we suggest estimating at the program level, the relationship between measured outcomes, expenses associated with resources consumed (via student pathways), contextual cost factors, and student need factors. We also suggest estimating institutional cost models, with consideration of the distribution of students across program types. Outcome-based modeling will aid in setting per-pupil cost targets toward achieving specific persistence and completion rates by program, context and student types.
Outcome-based models can also provide guidance about which community college programs are relatively more efficient and thereby aid the input-oriented investigation into the combination of personnel and non-personnel resources that are used to produce the results. This input analysis, aided by experts, could generate insights for community college leaders into which investments are commonly found at colleges that are highly effective. Those findings, in turn, could be a jumping off point for more rigorous cost-effectiveness analysis of the type done on the City University of New York’s ASAP program. As these types of studies accumulate, they might be used to provide for community college leaders a calculator showing price per improvement.
Issue 6: What adjustments to the prototypical community college costs should be made for institutions with higher student needs? Should need measures include economic disadvantage, academic preparedness from high school, first-generation college status, nontraditional/adult learner status, race, and/or other factors?
As with K–12 schools, certain community colleges are likely to have additional costs associated with educating high-needs students who are, on average, less likely to complete. Costing-out analysis needs to adjust costs for programs and institutions based on the level of need. Typically, at the K–12 level, costs are adjusted based on factors such as student poverty, academic preparedness, and special education status. In higher education, performance-based funding models typically provide a premium in funding for success with students who are, on average, less likely to complete, such as those eligible for Pell Grants, those who are first-generation college students, and those who are nontraditional/adult learners. Given the well-documented role that racial and ethnic discrimination has played and continues to play in American society, states should also consider using underrepresented minority status as a need factor.
Given the well-documented role that racial and ethnic discrimination has played and continues to play in American society, states should also consider using underrepresented minority status as a need factor.
What is the best way to determine what need factors to employ? Our recommendation is to be guided by research.
Recommendation 6: In order to isolate which need factors are associated with a need for greater funding, researchers should conduct a statistical analysis to determine those factors that most heavily predict reduced outcomes, controlling for other factors. Researchers should review the literature for economic and demographic factors as well as academic preparedness (from high school) and whether the student is a first-generation or nontraditional/adult college student, as well as any additional factors that might be identified which lead to decreased likelihood of persistence and completion.
Issue 7: How should researchers account for student needs such as food, housing, transportation, and child care?
A growing body of research suggests that college students—particularly community college students—face significant needs associated with food, housing, transportation, and childcare.63 (Thirty percent of community college students have dependent children.)64 Just as policymakers have long recognized that certain elementary and secondary pupils need publicly supported transportation to get to school, and free breakfast and lunch while on campus, policymakers need to acknowledge that community colleges, as an extension of elementary and secondary public education, need to grapple with providing critical supports to disadvantaged individuals.65 Four-year residential colleges, likewise, recognize that in order for students to succeed, all need access to housing, food, and health care. Americans appreciate this reality. A 2018 Demos poll found that six in ten Americans agree that full-time public college students who work part-time should not have to go into debt to pay for “books, groceries, transportation, and rent.”66
Since housing and food security is so critical to student success, calculating the cost of addressing those needs is a necessary element of the costing-out work. For some students, existing federal or state aid may be enough to address student needs. For some needs, costs may be covered through state appropriations to institutions or through grant aid, while others may be supplied through other services or means. Lumping all costs together, however, can provide a very misleading picture of community college costs in state-to-state comparisons.67
Recommendation 7: Researchers should separate out the costs associated with direct educational services from equally important costs associated with students’ basic needs. In this way, policymakers have a complete picture of what resources are necessary for student success and they can identify ways that services and resources can be provided and financed.
It is critical to find ways to estimate the costs necessary for student success, even when they may not be delivered directly by community colleges. Providing food and housing security and ensuring accessible transportation are prerequisites for students to be able to engage in a quality higher education experience.
Issue 8: What adjustments should researchers make to the cost of a prototypical community college education for other variations in cost related to region, scale, program, and the like?
It is not enough for researchers to identify the costs of delivering an adequate community college education at the typical institution. Costs will vary based on such factors as region (wages necessary to attract staff and faculty), size (economies of scale), program (for example, welding versus general education), and other cost drivers. We recommend following procedures first established in the K–12 setting.
Recommendation 8: Any cost analysis of community colleges must give thorough consideration to geographic and structural cost factors as well as student need factors (outlined above) that affect the costs of achieving desired outcome goals. Cost and need factors are reasonably well understood in K–12 cost analysis and many of those factors carry over into community college analysis. For one, regional competitiveness of faculty and staff wages most certainly plays into the estimation of costs. So too does economies of scale, both at the institutional and program level. We recommend adopting these well-established adjustments in K–12 studies to community college sector research.
Translating Empirical Evidence into Policy
Creating the research to establish expenditures necessary to support an adequate community college education should provide a strong basis for reform. However, it is only a step preliminary to implementing the research findings in the real world.
Whenever introducing empirical evidence into policy deliberations, especially where large sums of tax dollars are involved, expectations must be realistic. Cost estimates may inform policy, but they will likely never determine it directly and precisely. As Baker and Levin discuss in their background report, cost estimates in K–12 education are often used to benchmark whether and to what extent state school finance systems are meeting adequacy requirements. Estimates of the cost of achieving desired outcomes can assist policymakers in steering state funding systems in the right direction. Without such evidence, that direction is unknown.
Empirical estimates themselves may be imprecise, based on limited sets of outcomes, or other imperfect or incomplete data. But the evidence should not be disregarded outright for these reasons, because reasonable estimates are most certainly better than none at all. Those estimates can be used to set overall levels of funding and to determine how much more funding is needed for some students, in some programs and institutions, to achieve comparable rates of access, persistence, and completion.
How will policymakers greet studies of the true cost of a community college education? We begin this section by acknowledging the political impediments to reform. We then cite some reasons for optimism and make suggestions for reform to break the logjam on community college funding reform.
Acknowledging the Impediments to Reform
It is important to acknowledge frankly that policymakers seeking to act upon new research on the funding levels needed to promote a strong community college education will face considerable obstacles. Today’s system, which underfunds community colleges, is increasingly reliant upon tuition dollars rather than state support, and continues to rely heavily on the wealth of localities—both of which can undercut adequate funding.
As Richard Kahlenberg, Robert Shireman, Kimberly Quick, and Tariq Habash note in a background report for the working group, the current funding of community colleges is based on a hybrid model that draws a piece from four-year colleges (with some reliance on tuition dollars) and another piece from K–12 education (with some reliance on local appropriations). In some ways, however, this in-between position results in the worst of both worlds. The reliance on local funds is regressive, since wealthier districts supply more funds to community colleges in rich areas; and the reliance on tuition dollars means the burden of funding education can be shifted from the state to the individual—which is precisely what legislators have done in recent years, as the student population has grown more diverse.68
Originally, tuition was not a major source of community college funding. Many of the early community colleges—at the time usually referred to as “junior” colleges—began as extensions of K–12 education systems and followed the K–12 model that is 100 percent funded by state and local appropriations. But this relationship has shifted over time. Between the 1999–2000 and 2014–15 academic years, the proportion of state and local funding of two-year colleges declined from 64 percent to 52 percent, and funding through tuition revenue increased from 22 percent to 33 percent.69
Today, scaling investments to meet adequate levels of funding for community colleges faces three critical political challenges associated with political power realities, state budget constraints, and declining support for higher education as registered in public opinion research.
First, current institutional funding disparities—both those between four-year universities and community colleges and those among community colleges themselves—result in part from inequitable access to political power.70 State representatives—who are more likely to have attended or sent their children to four-year institutions—may also be more likely to respond to these schools rather than to community colleges.71
Second, state policymakers determining community college funding face budget constraints. States slashed their higher education budgets during the Great Recession, but even today, slow revenue growth—which economists attribute to a number of factors, including state decisions to enact costly tax cuts—poses challenges to meeting adequacy funding goals.
More troubling still, there is evidence that recent state disinvestment in public higher education may be related to the growing demographic diversity of the student population. Although conservatives complain about liberal bias among higher education faculty, Ronald Brownstein of The Atlantic makes the case that the changing demographics of the student body seems a more likely explanation for conservative enthusiasm to cut higher education budgets. There has been a “clear determination . . . to shift the burden from the community collectively to families individually precisely as the student body is reaching historic levels of diversity.”72 As the nation’s population becomes blacker and browner, this challenge may become even more acute.
Finally, there is some evidence that support of and confidence in institutions of higher education have fallen among Republicans and conservatives. A 2018 New America survey shows that Republican support for funding is waning (even as overall impressions of higher education remain positive). According to a 2017 survey by Pew Research Center, moreover, 58 percent of Republicans and Republican-leaning independents believe that colleges and universities have a negative effect on the way things are going in the country, while just 36 percent say their effect is positive. The Pew survey had found Republicans’ attitudes towards college were positive as recently as 2014, when a 54 percent majority of Republicans and Republican-leaners said that colleges were having a positive effect.73
Reasons for Optimism and a Path Forward
Although the current funding system—and the political dynamics underlying it—is troubling, we also think there are three reasons to be hopeful for reform.
First, community colleges have not suffered the same decline in popularity that higher education has as a whole. A 2018 Demos poll found that 85 percent of Americans have a favorable view of community colleges, compared with 66 percent who have such a view of private four-year colleges.74 (See Figure 10.) Adam Harris, writing in The Atlantic, noted, “Despite lukewarm feelings about higher education generally, 80 percent of Americans have a positive view of the institution near them—that often means community colleges.”75 Part of the relative popularity of two-year institutions may also have to do with their visible connection to workforce and economic development. Former Republican Tennessee governor Bill Haslam explicitly linked his support for community colleges to his larger “Drive to 55” campaign to boost economic development in the state by increasing to 55 percent the proportion of residents with a postsecondary credential.76
Figure 10
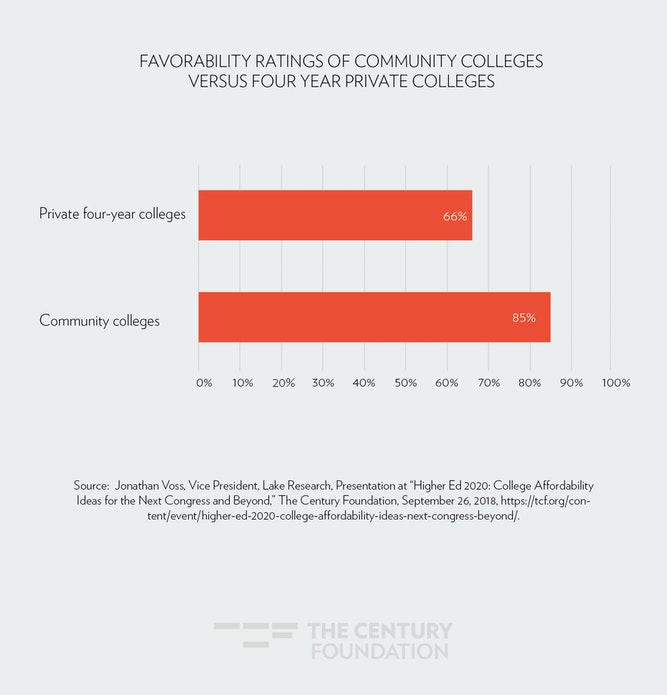
Second, new research evidence can sometimes make a difference in public policy circles. For example, after publication of the research cited above finding that the City University of New York’s ASAP program’s benefits to taxpayers outweigh the costs by more than three to one, policymakers and philanthropists came together to increase funding for ASAP from roughly 1,000 students in 2010 to 25,000 students in 2018–19.77
New research estimating the costs of an adequate community college education may be particularly persuasive to legislators because efficiency is baked into the methodology. When researchers seek to identify institutions that are already achieving adequate outcomes, the methodology calls on them to identify the most efficient of these institutions in assessing a minimum level of investment required. This feature of the study could be appealing to legislators who want any new financial investment to be applied with high levels of efficiency.
Third, there is reason to believe that the creation of a new federal-state partnership around providing adequate community college funding—grounded in research—could help break the logjam. As Kahlenberg, Shireman, Quick, and Habash note, the federal government has a long history of supporting federal-state partnerships in higher education, going back to the 1862 Morrill Act establishing land grant colleges.78 Federal-state partnerships are common in a variety of fields, such as unemployment insurance, health care, and K–12 education.79
We believe a new federal-state partnership to fund community colleges could create important new opportunities.80 To begin with, the federal government can be a critical source of new funding for community colleges that changes the state-level funding dynamic. As long as states are constrained to what is seen as a zero-sum game within the realm of education (with four-year colleges, community colleges and K–12 schools competing for their share of a small pie of state resources), the politics of boosting community college funding are challenging. A new influx of federal funds could create a very different political environment.
In addition, a matching funds program in which the federal government provides new dollars only if states agree to increase their own investments can provide a strong incentive for states to commit new resources necessary to support community colleges. In the K–12 arena, federal funding under the Elementary and Secondary Education Act has provided a modest amount of revenue but has given federal policy makers considerable leverage in encouraging states to enact a variety of forward-looking policies.
We are encouraged also by the example of federal–state partnerships in the health care sphere. Medicaid is a voluntary program that all states eventually adopted because of the federal matching funds made available. Likewise, while some conservative governors opposed the expansion of Medicaid funding, most recently under the Affordable Care Act (ACA), it is notable that a number of moderate and conservative governors agreed to take federal money, even though doing so required a modest expansion of state investments. Among the “red” and “purple” states that have adopted Medicaid expansion are Alaska, Arizona, Arkansas, Indiana, Kentucky, Louisiana, Montana, North Dakota, Ohio, and West Virginia. All told, thirty-three states (including Washington, D.C.) have adopted Medicaid expansion programs even though until recently twenty-six states have had Republican control of the executive and legislative branches.81
In some ways, a matching funding program for community colleges could be even more attractive to state legislators and governors than Medicaid funding. One key difference, of course, is that Medicaid is an entitlement program whose budgetary commitments are open-ended, while community college funding can be more easily circumscribed and involves a more predictable set of financial commitments. In addition, community college education is not means-tested in the way that Medicaid is, so states may experience relatively greater political pressure from middle-class constituencies to sign onto a federal–state partnership that supports two-year institutions than to those supporting Medicaid. Finally, states have additional political pressure to invest in higher education to keep talented students in state and avoid a “brain drain,” whereas the same pressure to retain low-income families using Medicaid within state borders does not exist.82
We also think that a federal–state partnership could be attractive to federal policymakers. Many have grown frustrated that in years past the federal government has substantially increased funding for the Pell Grant program, only to see state public institutions increase tuition as state governments withdraw resources per full time equivalent student. Federal financial aid expenditures tripled from $50 billion to over $150 billion between 1995 and 2015 in constant 2015 dollars, while state appropriations per full-time equivalent student fell in inflation-adjusted dollars by 28 percent.83 A matching funds program would assure federal policymakers that states would do their part as well.
Conclusion
Community colleges were first created based upon an idea that is both pragmatic and idealistic: that as the economy’s need for skills increased, the United States needed a new kind of institution that would help realize the goal of social mobility. Cruelly, however, these institutions that disproportionately educate low-income and minority students have been starved of the funding needed to succeed. Policymakers have instructed community colleges to do more with less, even though that cramped point of view stifles the role that community colleges can play in American society.
There is a better way. New evidence demonstrates that money spent wisely on community colleges can yield a payoff to taxpayers that is more than three times the cost.84 But rigorous research is needed to guide new investments, and to better understand the levels required.
Research on community colleges needs to catch up to elementary and secondary education, where for forty years, scholars have conducted studies on what constitutes adequate funding. This proposed area of research is complex, as we found over several months of discussions on how to apply K–12 costing-out techniques to the community colleges sector. But we believe this report creates a solid framework upon which researchers can build. It is vital that scholars undertake an effort to estimate what some of society’s most vulnerable students need in order to realize their potential—and thereby to allow the United States to attain its potential as well. Social mobility is written into the DNA of America, but we are unlikely to make significant progress unless we provide America’s community colleges the resources they need.
Members of The Century Foundation Working Group on Community College Financial Resources
Thomas Bailey (Columbia University)
Bruce Baker (Rutgers University)
Brooks Bowden (North Carolina State University)
Anthony Carnevale (Georgetown University)
Debbie Cochrane (The Institute for College Access and Success)
Michelle Cooper (Institute for Higher Education Policy)
Russ Deaton (Tennessee Board of Regents)
Wil Del Pilar (Education Trust)
David Deming (Harvard University)
Sara Goldrick-Rab (Temple University)
Harry Holzer (Georgetown University)
Tammy Kolbe (University of Vermont)
Jesse Levin (American Institutes for Research)
Bridget Terry Long (Harvard University)
Tatiana Melguizo (University of Southern California)
Gail Mellow (LaGuardia Community College)
Andrew Nichols (Education Trust)
George Pernsteiner (State Higher Education Executive Officers)
Ken Redd (National Association of College and University Business Officers)
Jennifer Rice (University of Maryland)
Robert Toutkoushian (University of Georgia)
Richard D. Kahlenberg (The Century Foundation), Executive Director
Notes
- See, for example, Raj Chetty et al., “The Fading American Dream: Trends in Absolute Income Mobility Since 1940,” NBER Working Paper No. 22910, December 2016, rev. March 2017, https://www.nber.org/papers/w22910; Richard V. Reeves and Eleanor Krause, “Raj Chetty in 14 charts: Big findings on opportunity and mobility we should all know,” Brookings Institution, January 11, 2018, https://www.brookings.edu/blog/social-mobility-memos/2018/01/11/raj-chetty-in-14-charts-big-findings-on-opportunity-and-mobility-we-should-know/; and Bruce Stokes, “Public divided on prospects for the next generation,” Pew Research Center, June 5, 2017, http://www.pewglobal.org/2017/06/05/2-public-divided-on-prospects-for-the-next-generation/.
- Anthony P. Carnevale, Artem Gulish, and Jeff Strohl, “Educational Adequacy in the Twenty-First Century,” The Century Foundation, May 2, 2018, 2, https://tcf.org/content/report/educational-adequacy-twenty-first-century/.
- Nick Anderson, “‘We serve the top 100 percent’: California community college chief responds to Trump,” Washington Post, February 16, 2018 (quoting Eloy Ortiz Oakley, chancellor of the California community college system), https://www.washingtonpost.com/news/grade-point/wp/2018/02/16/we-serve-the-top-100-percent-california-community-college-chief-responds-to-trump/.
- There are 1,047 public community colleges in the United States. See U.S. Department of Education, “Community College Facts at a Glance,” https://www2.ed.gov/about/offices/list/ovae/pi/cclo/ccfacts.html. Unduplicated year-round enrollment shows 9 million undergraduates in public two-year colleges in 2015–16. See “Community College FAQs,” Community College Research Center, Teachers College, Columbia University, https://ccrc.tc.columbia.edu/Community-College-FAQs.html. For resource levels, see discussion below.
- “Community College FAQs,” Community College Research Center, Teachers College, Columbia University, https://ccrc.tc.columbia.edu/Community-College-FAQs.html (81 percent of entering community college students aspire to earn a bachelor’s degree or higher); Laura Horn and Paul Skomsvold, “Community College Student Outcomes 1994–2009,” U.S. Department of Education, Institute of Education Sciences and National Center for Education Statistics, November 2011, Table 1, 2003–04 cohort (81 percent aspire to a bachelor’s degree); National Student Clearinghouse Research Center, Signature Report: Completing College: A National View of Student Completion Rates—Fall 2011 Cohort, December 2017, Appendix C, Table 39 (after six years, 23 percent complete at two-year institutions alone and an additional 15 percent complete a four-year degree).
- See discussion below.
- See Eleanor Krause and Isabel V. Sawhill, “Seven reasons to worry about the American middle class,” Brookings Institution, June 5, 2018 (citing NBC/Wall Street Journal poll finding an increase in pessimism about intergenerational mobility between 2007 and 2014).
- Bruce Stokes, “Public divided on prospects for the next generation,” Pew Research Center, June 5, 2017, http://www.pewglobal.org/2017/06/05/2-public-divided-on-prospects-for-the-next-generation/.
- Raj Chetty et al., “The Fading American Dream: Trends in Absolute Income Mobility Since 1940,” NBER Working Paper No. 22910, December 2016, rev. March 2017, https://www.nber.org/papers/w22910.
- See first figure in Richard V. Reeves and Eleanor Krause, “Raj Chetty in 14 charts: Big findings on opportunity and mobility we should all know,” Brookings Institution, January 11, 2018, https://www.brookings.edu/blog/social-mobility-memos/2018/01/11/raj-chetty-in-14-charts-big-findings-on-opportunity-and-mobility-we-should-know/.
- Sandy Baum and Charles Kurose, “Community Colleges in Context: Exploring Financing of Two- and Four-Year Institutions,” in Bridging the Higher Education Divide: Strengthening Community Colleges and Restoring the American Dream (New York: The Century Foundation Press, 2013), 74, https://tcf.org/content/book/bridging-the-higher-education-divide
- See discussion below, including Jonathan Voss, presentation at “Higher Ed 2020: College Affordability Ideas for the Next Congress and Beyond,” The Century Foundation, September 26, 2018, https://tcf.org/content/event/higher-ed-2020-college-affordability-ideas-next-congress-beyond
- National Student Clearinghouse Research Center, “Completing College: A National View of Student Completion Rates—Fall 2011 Cohort, December 2017,” Appendix C, Table 39. This research is consistent with the 2004/2009 Beginning Postsecondary Student Longitudinal Study (BPS), which found that only 34.5 percent of students who started in a two-year college earned a degree or certificate (from their starting institution or another school) within six years (8.5 percent earned certificates, 14.4 percent earned associate’s degrees, and 11.6 percent earned bachelor’s degrees). See Bridging the Higher Education Divide, 30. For a more sanguine assessment, see Kevin Carey, “Revised Data Shows Community Colleges Have Been Underappreciated,” New York Times, October 31, 2017.
- According to the Community College Research Center, Teachers College, Columbia University, 68 percent of students beginning at public two-year colleges in 2003–04 took one or more remedial classes in the six years after their initial enrollment. See “Community College FAQs,” Community College Research Center, Teachers College, Columbia University, https://ccrc.tc.columbia.edu/Community-College-FAQs.html.
- C. Lockwood Reynolds, “Where to Attend? Estimating the Effects of Beginning at a Two-Year College,” University of Michigan, Ann Arbor, October 25, 2006, cited in William G. Bowen, Matthew M. Chingos, and Michael S. McPherson, Crossing the Finish Line: Completing College and America’s Public Universities (Princeton, N.J.: Princeton University Press, 2009), 134.
- See, for example, Thomas Bailey, Shanna Smith Jaggars, and Davis Jenkins, Redesigning America’s Community Colleges: A Clearer Path to Student Success (Cambridge, Mass.: Harvard University Press, 2015). See also Harry J. Holzer and Sandy Baum, Making College Work: Pathways to Success for Disadvantaged Students (Washington, D.C.: Brookings Institution Press, 2017). Others have documented ways to improve the efficiency of developmental education. See Judith Scott-Clayton, Peter M. Crosta and Clive Belfield, “Improving the Targeting of Treatment: Evidence From College Remediation,” National Bureau of Economic Research Working Paper, October 2012, https://www.nber.org/papers/w18457.pdf; and Bridget Terry Long, “Addressing the Academic Barriers to Higher Education,” Brookings Institution 2014, https://www.brookings.edu/research/addressing-the-academic-barriers-to-higher-education/.
- Donna M. Desrochers and Steven Hurlburt, Trends in College Spending 2003–2013 (Washington D.C.: American Institutes for Research, 2016), 24–27.
- It is commonly assumed that the first two years of college are less costly than the third and fourth, but Sandy Baum and Charles Kurose find that inequalities in spending between community colleges and four-year institutions remain after one accounts for that difference. See Sandy Baum and Charles Kurose, “Community Colleges in Context: Exploring Financing of Two and Four-Year Institutions,” in Bridging the Higher Education Divide: Strengthening Community Colleges and Restoring the American Dream (New York: The Century Foundation Press, 2013), 97 and 102.
- Donna M. Desrochers and Steven Hurlburt, “Trends in College Spending 2003 to 2013,” Delta Cost Project and the American Institutes of Research, January 2016, 24–27.
- Portions of this discussion are drawn from Richard D. Kahlenberg, Robert Shireman, Kimberly Quick, and Tariq Habash, “Policy Strategies for Pursuing Adequate Funding of Community Colleges,” The Century Foundation, October 25, 2018, https://tcf.org/content/report/policy-strategies-pursuing-adequate-funding-community-colleges/.
- See John Bound, Michael F. Lovenheim, and Sarah Turner, “Why Have College Completion Rates Declined? An Analysis of Changing Student Preparation and Collegiate Resources,” American Economic Journal: Applied Economics 2, no. 3 (2010): 129–57. See also David J. Deming, “Increasing College Completion with a Federal Higher Education Matching Grant,” The Hamilton Project, April 2017, 12.
- See Bruce D. Baker, “How Money Matters for Schools,” Learning Policy Institute, December 2017, 14. See also Bruce D. Baker, “Does Money Matter in Education?” Albert Shanker Institute, 2nd edition, 2016, i.
- Rucker C. Johnson and Sean Tanner, “Money and Freedom: The Impact of California’s School Finance Reform,” Learning Policy Institute, February 2018, 9.
- David J. Deming and Christopher R. Walters, “The Impact of Price Caps and Spending Cuts on U.S. Postsecondary Attainment,” National Bureau of Economic Research, Working Paper 23736, August 2017, 3.
- Ibid., Table 4.
- Ibid., 16.
- Ibid., p. 21. See also David J. Deming, “Increasing College Completion,” 2. See also Kolbe and Baker, 4 (regarding Deming’s findings having particular power at the community college level).
- For an important summary of current research on the benefits of higher education spending, see Fernando Furquim, “What do universities get for their instructional dollars? What research tells us about the relationship between spending and student outcomes in higher education,” The Century Foundation (forthcoming) (suggesting that spending on instruction and student supports is particularly effective).
- Juan Carlos Calcagno, Thomas Bailey, Davis Jenkins, Gregory Kienzl, and Timothy Leinbach, “Community College Student Success: What Institutional Characteristics Make a Difference?” Economics of Education Review 27 (2008): 632–45, 644. See also Jane Wellman, “Financial Characteristics of broad access public institutions,” background paper prepared for the Stanford Conference on Mapping Broad Access Higher Education, December 1–2, 2011, 21–22 (citing three research studies).
- Donna M. Desrochers and Jane V. Wellman, “Trends in College Spending 1999–2009,” Delta Project on Postsecondary Education Costs, Productivity, and Accountability,2011, 30, http://www.deltacostproject.org/resources/pdf/Trends2011_Final_090711.pdf.
- Richard D. Kahlenberg, “Community of Equals? Few elites give much thought to community colleges. But they educate 44 percent of our undergraduates—and they need help,” Democracy Journal, Spring 2014.
- Susan Dynarski, “How to Improve Graduation Rates at Community Colleges,” New York Times, March 11, 2015; and Katherine Mangan, “Program’s Extra Support for Community-College Students Is Paying Off,” Chronicle of Higher Education, February 26, 2015.
- Bridging the Higher Education Divide, 35–40. See also David J. Deming, “Increasing College Completion,” 6, suggesting “A number of recent high-quality studies find large impacts of student supports and mentoring on persistence and degree completion.”
- “A Matter of Degrees: Practices to Pathways,” Center for Community College Student Engagement, University of Texas at Austin, 2014, https://www.ccsse.org/docs/matter_of_degrees_3.pdf.
- See Carnevale, Gulish, and Strohl, “Educational Adequacy in the Twenty-First Century,” 24–25 (citing Judith Scott-Clayton, “The Shapeless River: Does a Lack of Structure Inhibit Students’ Progress at Community Colleges?” CCRC Working Paper no. 25, Community College Research Center, 2011; Angela Boatman, “Evaluating Institution Efforts to Streamline Student Remediation: The Causal Effects of Tennessee Developmental Course Redesign Initiative,” National Center for Postsecondary Research, 2012; Craig Hayward and Terrence Willett, “Curricular Redesign and Gatekeeper Completion: A Multi-College Evaluation of the California Acceleration Project” The Research and Planning Group for California Community Colleges, 2014; Joshua Angrist, Daniel Lang, and Philip Oreopoulos, “Incentives and services for college achievement: Evidence from a randomized trial,” American Economic Journal: Applied Economics 1, no. 1 (2009): 136–63; Eric Bettinger and Rachel Baker, “The Effects of Student Coaching in College: An Evaluation of a Randomized Experiment in Student Mentoring,” NBER Working Paper 16881, National Bureau of Economic Research, 2011; Alexander K. Mayer, Reshma Patel, Timothy Rudd, and Alyssa Ratledge, “Designing Scholarships to Improve College Success: Final Report on the Performance-Based Scholarship Demonstration,” MDRC, 2015; Davis Jenkins, “Get with the Program: Accelerating Community College Students’ Entry into and Completion of Programs of Study,” CCRC Working Paper no. 32, Community College Research Center, Columbia University, 2011).
- Henry M. Levin and Emma Garcia, “Accelerating Community College Graduation Rates: A Benefit-Cost Analysis,” Journal of Higher Education 89, no. 1 (2018): 1–27.
- Ibid., 10 (present value at age 23 years at 2.5 percent discount rate, 2008–10).
- Ibid., 11–15. See also Philip Trostel, “It’s Not Just the Money: The Benefits of College Education to Individuals and Society,” Lumina Issue Papers, October 14, 2015, 9 and 14, https://www.luminafoundation.org/files/resources/its-not-just-the-money.pdf (finding that the present value of net additional lifetime earnings of a community college associate degree holder of $246,000 in 2012)
- Bridging the Higher Education Divide, 17.
- Bridging the Higher Education Divide, 17.
- Natasha Ushomirsky and David Williams, “Funding Gaps 2015: Too Many States Still Spend Less on Education Students Who Need the Most,” The Education Trust, March 2015, 5.
- Deborah A. Verstegen, “How Do States Pay for Schools? An Update of a 50-State Survey of Finance Policies and Programs,” Association for Education Finance and Policy Annual Conference, San Antonio, Texas, March 15, 2014, 8.
- Bruce Baker and Jesse Levin, “Estimating the Real Cost of Community College,” The Century Foundation, October 23, 2017, https://tcf.org/content/report/estimating-real-cost-community-college
- Bridging the Higher Education Divide, 40–41.
- See websites for the Integrated Postsecondary Education Data System (https://nces.ed.gov/ipeds/) and the Delta Cost Project (https://www.deltacostproject.org/).
- Tammy Kolbe and Bruce D. Baker, “Fiscal Equity and America’s Community Colleges,” Journal of Higher Education, May 18, 2018.
- Chancellor’s Office, California Community Colleges, “The Real Cost Project: Preliminary Report,” September 2003, 9–10, http://californiacommunitycolleges.cccco.edu/Portals/0/Reports/realcost.pdf.
- “Real Cost Project,” 15.
- “Real Cost Project,” 19.
- “Real Cost Project,” 1–2, 15–19.
- Christopher Morphew and Bruce Baker, “On the Utility of National Datasets and Resource Cost Models for Estimating Faculty Instructional Costs in Higher Education,” Journal of Education Finance 33, no. 1 (2007): 20-48.
- Anthony P. Carnevale, Artem Gulish, and Jeff Strohl, “Educational Adequacy in the Twenty-First Century,” The Century Foundation, May 2, 2018, 2, https://tcf.org/content/report/educational-adequacy-twenty-first-century/.
- These figures are in 2016 dollars.
- For support for the notion that earnings growth could be a measure of community college performance, see Holzer and Baum, Making College Work, 175–76
- Jacob Mincer, Schooling, Experience and Earning (National Bureau of Economic Research, 1974).
- See, for example, Christine Woff-Eisenberg, “Amplifying Student Voices: The Community College Libraries and Academic Support for Student Success Project,” Ithaka S+R and Institute of Museum Sciences and Library Services, 2018, 11–15, https://www.insidehighered.com/sites/default/server_files/media/SR_Report_Amplifying_Student_Voices_CCLASS%20_08132018.pdf.
- The completion standard applies to students seeking a degree or certificate. Of course, some students take courses at community college in order to attain a new skill without seeking to complete a certificate or degree.
- When examining completion, we look to goals for the entire population rather than rates for the population in college, for the reasons outlined under Issue 1.
- Carnevale, Gulish and Strohl, “Educational Adequacy,” 2.
- An expansion of access to community college among those with lower achievement might initially weaken, rather than raise, these success rates.
- These success levels should be examined both at the institutional and the community-need level. Caution should be taken in judging schools or program based on rates of completion of degrees or certificates, as opposed to the number of completers among the population that needs to be served in the geographic area. An institution may have a reasonable strategy of offering very low-cost access to a broad swath of the local population, giving many adults the opportunity to try out an area of study with an expectation that many may choose not to continue (resulting in a low graduation rate). As long as the courses are affordable, no harm has been done, and many may benefit from the courses they did take. On the other hand, if the broad access consistently fails to produce the degrees and certificates that are appropriate given community needs and the pursuit of equity, or if it leaves former students with debts they cannot repay, then the broad-access strategy should be rethought.
- See Jay Chambers, T. Parrish, J. Levin, J. Smith, J. Guthrie, R. Seder, and L. Taylor, The New York Adequacy Study: Determining the Cost of Providing All Children in New York an Adequate Education (Palo Alto, Calif.: American Institutes for Research, 2004); and Jay Chambers, J. Levin, D. Delancey, and K. Manship, An Independent Comprehensive Study of the New Mexico Public School Funding Formula: Volume 1—Final Report (Palo Alto, Calif.: American Institutes for Research, 2008).
- See, for example, Sara Goldrick-Rab, “It’s Hard to Study if You’re Hungry,” New York Times, January 14, 2018, https://www.nytimes.com/2018/01/14/opinion/hunger-college-food-insecurity.html. See also “Food Insecurity: Better Information Could Help Eligible College Students Access Federal Food Assistance Benefits,” General Accountability Office, January 9, 2019, https://www.gao.gov/products/GAO-19-95.
- Harry J. Holzer and Sandy Baum, Making College Work: Pathways for Success for Disadvantaged Students (Washington, D.C.: Brookings Institution Press, 2017), 146.
- See Richard D. Kahlenberg, Robert Shireman, Kimberly Quick and Tariq Habash, “Policy Strategies for Pursuing Adequate Funding of Community Colleges,” The Century Foundation, October 25, 2018 https://tcf.org/content/report/policy-strategies-pursuing-adequate-funding-community-colleges/.
- Jonathan Voss, vice president, Lake Research, presentation at “Higher Ed 2020: College Affordability Ideas for the Next Congress and Beyond,” The Century Foundation, September 26, 2018, https://tcf.org/content/event/higher-ed-2020-college-affordability-ideas-next-congress-beyond
- In Vermont, for example, a budgeting process that places social supports in the education budget—a practice not typically used by other states—has led to unfair criticisms that Vermont spends more than other states on education without comparable results.
- Portions of this discussion are drawn from Richard D. Kahlenberg, Robert Shireman, Kimberly Quick and Tariq Habash, “Policy Strategies for Pursuing Adequate Funding of Community Colleges,” The Century Foundation, October 25, 2018 https://tcf.org/content/report/policy-strategies-pursuing-adequate-funding-community-colleges/.
- See Kahlenberg, Shireman, Quick and Habash, Figure 5.
- Nicholas Carnes, White-Collar Government: The Hidden Role of Class in Economic Policy Making (Chicago: University of Chicago Press, 2013).
- National Conference of State Legislatures, Legislator Demographics Survey, “State Legislators 2015 Highest Degree Attained,” http://www.ncsl.org/Portals/1/Documents/About_State_Legislatures/Education.pdf. Nationally, the survey found that at least 73 percent of state legislators held a bachelor’s or advanced degree, with only 4 percent possessing less than a bachelor’s, and 23 percent missing data. Pew, who helped conduct the survey, also points out that lawmakers with business backgrounds hold the biggest share of seats.
- Ronald Brownstein, reply to “Letters: Why Have States Cut University Funds?” May 15, 2018. https://www.theatlantic.com/letters/archive/2018/05/letters-american-higher-education-hits-a-dangerous-milestone/560081/.
- Hannah Fingerhut, “Republicans skeptical of colleges’ impact on U.S., but most see benefits for workforce participation,” Pew Research Center, July 20, 2017, http://www.pewresearch.org/fact-tank/2017/07/20/republicans-skeptical-of-colleges-impact-on-u-s-but-most-see-benefits-for-workforce-preparation/.
- Jonathan Voss, vice president, Lake Research, presentation at “Higher Ed 2020: College Affordability Ideas for the Next Congress and Beyond,” The Century Foundation, September 26, 2018, https://tcf.org/content/event/higher-ed-2020-college-affordability-ideas-next-congress-beyond
- Adam Harris, “The Higher Education Nearly All Americans Love,” Atlantic, May 21, 2018.
- See Drive to 55 Alliance website, http://driveto55.org/.
- City University of New York, “Significant Increases in Associate Degree Graduation Rates: CUNY Accelerated Study in Associate Programs (ASAP), March 1, 2017, http://www1.cuny.edu/sites/asap/wp-content/uploads/sites/8/2017/03/ASAP_Program_Overview_Web.pdf.
- John Michael Lee Jr., and Samaad Wes Keys, “Land-Grant But Unequal: State One-to-One Funding for 1890 Land-Grant Universities,” Association of Public and Land Grant Universities, September 2013, 1–2.
- Jennifer Mishory, “Path to Debt-Free College: A Blueprint for Building a Successful Federal-State Partnership,” The Century Foundation, September 26, 2018, 3. For similar programs, see e.g. David Tandberg, Sophia Laderman, and Andy Carlson, “A Federal-State Partnership for True College Affordability,” State Higher Education Executive Officers Association, June 2017; David J. Deming, “Increasing College Completion with a Federal Higher Education Match,” The Hamilton Project, April 2017, 2; and “Fact Sheet: White House Unveils America’s College Promise Proposal,” The White House, January 9, 2015, https://obamawhitehouse.archives.gov/the-press-office/2015/01/09/fact-sheet-white-house-unveils-america-s-college-promise-proposal-tuitio.
- For an earlier call for a federal–state partnership for community colleges, see “Investing in American Education: The American Graduation Initiative,” The White House, https://obamawhitehouse.archives.gov/blog/2009/07/14/investing-education-american-graduation-initiative, and “Transforming America’s Community Colleges,” The Brooking Institution, May 7, 2009, https://www.brookings.edu/events/transforming-americas-community-colleges-a-federal-policy-proposal-to-expand-opportunity-and-promote-economic-prosperity/.
- “Status of State Action on the Medicaid Expansion Decision,” Henry J. Kaiser Family Foundation, April 27, 2018, https://www.kff.org/health-reform/state-indicator/state-activity-around-expanding-medicaid-under-the-affordable-care-act/?activeTab=map¤tTimeframe=0&selectedDistributions=current-status-of-medicaid-expansion-decision&sortModel=%7B%22colId%22:%22Location%22,%22sort%22:%22asc%22%7D. See also Deming, “Increasing College Completion,” 6 (citing the matching program structure as having been “used successfully to boost state Medicaid spending”).
- For discussion of state pressure to avoid “brain drain,” see Colleen Campbell, Center for American Progress, remarks at “Higher Ed 2020: College Affordability Ideas for the Next Congress and Beyond,” The Century Foundation, September 26, 2018, https://tcf.org/content/event/higher-ed-2020-college-affordability-ideas-next-congress-beyond
- See Deming and Walters, “The Impact of Price Caps,” 2.
- Henry M. Levin and Emma Garcia, “Accelerating Community College Graduation Rates: A Benefit-Cost Analysis,” Journal of Higher Education 89, no. 1 (2018): 1–27.


