
The effects of state higher education policy fall far beyond a state’s border. States continually assess their higher education tuition and other policies in comparison to their closest economic competitors: neighboring states that may attract talent or regional economic investments fueled by higher education systems outpacing their own. In some extreme cases, states even create financial disincentives for college graduates to leave the state through higher education policy. And it’s not just a competition, as regions facing similar economic trends and challenges can also learn from each others’ successes.
In our previous report, Michigan’s College Affordability Crisis, we examined the affordability of Michigan’s colleges and universities across institutions, across demographics and income levels, and across time.1 In this report, we review the affordability of Michigan’s public colleges and universities relative to five neighboring states—Illinois, Indiana, Minnesota, Ohio, and Wisconsin—to see where the state may be falling down on its commitment to keeping public higher education affordable in comparison to the region. (In a third, forthcoming report, we will draw from lessons in the region and elsewhere to lay out recommendations to address these challenges.)
Michigan’s public colleges and universities have become steadily less affordable over the past two decades, mirroring a national trend where state funding of public higher education has not kept pace with costs, leading to increased tuition and fees. Many states, including the five other states in the Midwest analyzed in this report, also enacted large decreases in higher education funding during the Great Recession—despite increases in enrollments during that time—and, in many cases, funding has not yet returned to pre-recession levels.2 Here, we assess those trends within the context of the region. We found that:
- Michigan’s public higher education funding as a percent of the state budget—4.1 percent—places it in the bottom ten states nationwide, and most nearby states provide more higher education dollars per student.
- Of the six states, Michigan offers the least in state grant aid for college students—one fourth as much per student as Indiana—though Michigan institutions provide more institutional aid than schools in other states.
- Four-year institutions in Michigan have some of the highest public tuition prices and take in more in tuition and fees per student than institutions in any other state in the region.
- Michigan’s higher education system serves a population that is higher-poverty than its neighbors, and serves a higher percentage of students who receive a Pell grant.
- While Michigan does a better job than its neighbors in keeping net price low for low-income students, the average net price for all students at four-year colleges as a percentage of median income is higher than that for the rest of the region.
- Community colleges in the state have a slightly lower net price than those in most neighboring states, though there is significant variation because so much of the public investment supporting these schools comes from uneven local support.
- Michigan public university bachelor’s degree graduates have the highest average student debt in the region, taking on about $25,000 in debt by graduation.
Michigan Trails in Higher Education Funding and Has Most Tuition-Dependent Universities
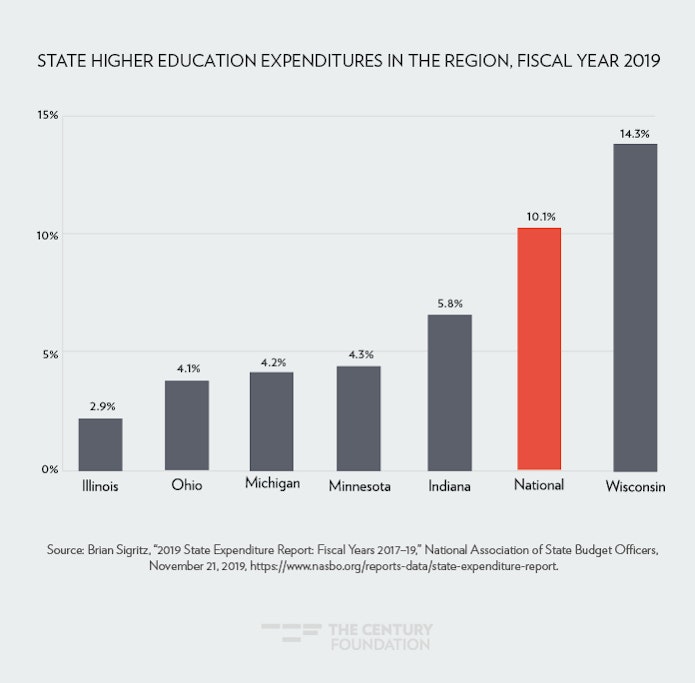
In 2019, Michigan devoted the third-smallest share of resources to higher education compared to other states in the region, greater only than Ohio and Illinois, which was still recovering from a severe budget crisis (see Figure 1).3 Nationally, it was in the bottom ten, ranked forty-first, with just 4.2 percent of state expenditures devoted to higher education (the national average was 10.1 percent). The high spending reported by Wisconsin—the only state in the region with a spending value higher than the national average—conflicts with other data (see Table 1) and may be due to Wisconsin reporting its data differently than its neighbors do.
Figure 1
Michigan takes in the most tuition and fee revenue per student.4 of any state in the region, and its tuition income at its public universities is well above the national average. Michigan also appropriated the second fewest state dollars per student in operating expenses at public institutions in 2016–17 in the region (see Table 1).
Table 1
| Tuition and Fee Revenue, State Appropriations, and Local Appropriations in the Region, 2016–17 School Year | |||
| Tuition and Fee Revenue per Student | State Appropriations per Student | Local Appropriations per Student | |
| Michigan | $11,124 | $4,656 | $1,448 |
| Public University | $14,671 | $5,361 | $0 |
| Community College | $3,647 | $3,170 | $4,501 |
| Illinois | $6,673 | $2,682 | $2,896 |
| Public University | $11,334 | $3,227 | $0 |
| Community College | $2,683 | $2,215 | $5,374 |
| Indiana | $9,468 | $6,002 | $18 |
| Public University | $11,499 | $6,424 | $23 |
| Community College | $2,318 | $4,516 | $0 |
| Minnesota | $6,823 | $6,723 | $0 |
| Public University | $9,281 | $7,916 | $0 |
| Community College | $3,273 | $5,000 | $0 |
| Ohio | $9,241 | $5,175 | $438 |
| Public University | $11,492 | $5,541 | $0 |
| Community College | $3,088 | $4,175 | $1,637 |
| Wisconsin | $6,840 | $5,897 | $2,095 |
| Public University | $8,283 | $4,827 | $0 |
| Community College | $3,062 | $8,699 | $7,578 |
| National | $6,598 | $5,827 | $1,057 |
| Public University | $8,711 | $6,947 | $141 |
| Community College | $2,425 | $3,614 | $2,866 |
|
Note: Data from the State Higher Education Executive Officers Association shows similar patterns. Source: National Center for Education Statistics, Integrated Postsecondary Education Data System (IPEDS), 2016–17 data. |
|||
Of the six states, Michigan awards the least in state higher education grants to public college students, both in aggregate funding and in per student funding. Illinois provides three times as much aggregate funding, and Minnesota and Wisconsin provide more aggregate funding via state grant aid than Michigan, despite having significantly smaller postsecondary enrollments. Michigan also offers the least state grant aid per public student in any of the six states: Wisconsin offers twice as much, Illinois three times as much, Minnesota four times as much, and Indiana more than five times as much (see Table 2).
Michigan’s public institutions in part make up for the state’s lack of grant aid by providing more generous institutional aid. Of the states in the region, Michigan has the largest amount of institutional aid per student, and first-time full-time undergraduates at Michigan four-year institutions are more likely to receive institutional aid than students in other states (see Table 2).
Table 2
|
State Grant Aid and Institutional Aid in the Region |
|||||
| Total State Grant Aid at Public Colleges and Universities | State Grant Aid per Student at Public Colleges and Universities | Total Institutional Aid at Public Colleges and Universities | Institutional Aid per Student at Public Colleges and Universities | Percentage of First-Time Full-Time Undergraduates Receiving Institutional Aid at Public Universities | |
| Michigan | $78,260,154 | $203 | $1,100,555,241 | $2,849 | 66% |
| Illinois | $234,155,622 | $608 | $401,490,366 | $1,043 | 58% |
| Indiana | $280,751,723 | $1,103 | $573,841,814 | $2,254 | 48% |
| Minnesota | $171,787,909 | $884 | $257,206,634 | $1,323 | 53% |
| Ohio | $87,087,948 | $214 | $898,953,378 | $2,207 | 64% |
| Wisconsin | $93,372,390 | $449 | $223,850,451 | $1,076 | 27% |
| National | $10,307,145,817 | $899 | $18,226,043,313 | $1,590 | 48% |
| Sources: State Grant Aid data come from the National Association of State Student Grant and Aid Programs (NASSGAP) query tool for 2017–18 data, and the remainder of data including enrollments used to calculate per-student data come from National Center for Education Statistics, Integrated Postsecondary Education Data System (IPEDS) 2016–17 data. | |||||
Michigan’s Public Universities Have Highest Tuition, Students Graduate with Most Debt in the Region
Michigan’s four-year universities have the highest tuition and fees as a proportion of median household income of any of the six states. When one considers the cost of full-time attendance after average grant aid,5 Michigan’s median four-year institution costs more than a quarter of the median household income in the state, more than in any other state in the region (see Table 3). Michigan’s community colleges do somewhat better: they compare favorably to other states, in both tuition costs and total costs, but the total cost of attendance, including non-tuition costs, varies widely. Affordability depends heavily on the area of the state in which you live.6 Table 3 shows the substantial variation in net price across institutions within the state.
Table 3
|
Tuition and Fees and Net Price at Median Institutions by State |
|||||
| Median Institution Tuition and Fees | Median Institution Net Price | ||||
| Median Household Income | In Dollars | As a Percentage of Median Household Income | In Dollars | As a Percentage of Median Household Income | |
| Michigan | $54,909 | ||||
| Public University | $12,093 | 22% | $14,005 | 26% | |
| Low Net Price (UM Dearborn) | $9,692 | 18% | |||
| High Net Price (Michigan Technological University) | $17,139 | 31% | |||
| Community College | $3,890 | 7% | $5,868 | 11% | |
| Low Net Price (Alpena CC) | $3,226 | 6% | |||
| High Net Price (Southwestern Michigan CC) | $8,741 | 16% | |||
| Illinois | $62,992 | ||||
| Public University | $12,050 | 19% | $15,803 | 25% | |
| Community College | $3,887 | 6% | $5,701 | 9% | |
| Indiana | $54,181 | ||||
| Public University | $7,589 | 14% | $9,917 | 18% | |
| Community College | $4,255 | 8% | $6,423 | 12% | |
| Minnesota | $68,388 | ||||
| Public University | $9,029 | 13% | $14,491 | 21% | |
| Community College | $5,396 | 8% | $10,563 | 15% | |
| Ohio |
$54,021 |
||||
| Public University | $6,128 | 11% | $11,866 | 22% | |
| Community College | $3,858 | 7% | $7,301 | 14% | |
| Wisconsin | $59,305 | ||||
| Public University | $7,946 | 13% | $13,069 | 22% | |
| Community College | $4,370 | 7% | $9,641 | 16% | |
| National | $60,336 | ||||
| Public University | $7,878 | 13% | $12,630 | 21% | |
| Community College | $3,718 | 6% | $7,264 | 12% | |
|
Sources: Data on median household income come from American Community Survey 2017 data, and tuition and net price data come from National Center for Education Statistics, Integrated Postsecondary Education Data System (IPEDS) 2016–17 data. |
|||||
Given the mission of public higher education to serve the whole public, an important question is whether states are keeping their institutions affordable for low-income students. Fourteen percent of households in Michigan have incomes under the federal poverty level, the highest in the region, and Michigan’s public higher education institutions serve a larger proportion of students with Pell grants than do the public institutions of the other states in the region (see Table 4). The various forms of federal, institutional, and state aid across all six states help make the cost of full-time college attendance lower for low-income students (defined as an income under $30,000) than for students in higher income brackets. But nonetheless, in Michigan, a student with a household income under $30,000 can still be expected to spend over $9,000 per year to enroll full time at a public four-year institution in the state. While this is a high cost for a low-income household to bear, for low-income students, Michigan is the third-most affordable of the six states in the region for universities and the second-most affordable for community colleges (see Table 4)
Table 4
|
Net Price for Low-Income Students and Prevalence of Students Receiving Pell |
|||||
| Federal Poverty Rate | Net Price, Weighted Average, $0–30,000 | Net Price, Weighted Average, $30,000–48,000 | Percentage of Students Receiving Pell Grants | Number of Students Receiving Pell Grants | |
| Michigan | 14.2% | 25.5% | 135,817 | ||
| Public University | $9,220 | $11,161 | 27.4% | 69,551 | |
| Community College | $5,050 | $5,487 | 23.8% | 66,266 | |
| Illinois | 12.6% | 18.9% | 133,625 | ||
| Public University | $12,267 | $13,091 | 33.3% | 51,107 | |
| Community College | $4,931 | $5,513 | 14.9% | 82,518 | |
| Indiana | 13.5% | 20.8% | 81,371 | ||
| Public University | $7,174 | $8,303 | 21.9% | 49,837 | |
| Community College | $6,099 | $6,426 | 19.1% | 31,534 | |
| Minnesota | 9.5% | 22.1% | 66,997 | ||
| Public University | $9,589 | $10,153 | 19.7% | 26,112 | |
| Community College | $10,048 | $10,262 | 23.9% | 40,885 | |
| Ohio | 14.0% | 23.7% | 134,903 | ||
| Public University | $12,163 | $13,752 | 24.6% | 76,764 | |
| Community College | $5,483 | $5,875 | 22.6% | 58,139 | |
| Wisconsin | 11.3% | 21.1% | 68,540 | ||
| Public University | $8,368 | $9,796 | 21.4% | 36,783 | |
| Community College | $8,409 | $9,013 | 20.7% | 31,757 | |
| National | 13.4% | 25.3% | 4,448,085 | ||
| Public University | $9,228 | $10,900 | 28.4% | 2,509,847 | |
| Community College | $6,068 | $6,681 | 22.2% | 1,938,238 | |
|
Sources: Data on households in federal poverty come from American Community Survey 2017 data, and the remainder of data come from National Center for Education Statistics, Integrated Postsecondary Education Data System (IPEDS) 2016–17 data. |
|||||
Despite comparing reasonably well to neighboring states in net price for low-income students, Michigan’s public higher education institutions remain unaffordable for many residents. 7 The same is true for many residents of neighboring states. Furthermore, with the highest poverty rate and the largest proportion of students attending public institutions receiving Pell grants in the region, and with both rates above the national average, Michigan still presents obstacles to these students with its reliance on a model of high tuition and high institutional aid. Given the obscurity of the institutional aid system for most prospective students, “sticker shock” may dissuade low-income and middle-income students alike from ever considering institutions that seem too expensive to be feasible for their budget.
Another way of evaluating the relative affordability of institutions is to measure the extent to which their students take on student debt. Graduates of Michigan’s public universities who complete a bachelor’s degree and borrow to finance their education take on more debt—carrying an average debt burden of almost $25,000 in federal student loans by graduation—than bachelor’s degree recipients who attended public universities in neighboring states. Students attending public institutions who complete associate’s degrees tend to have lower debt at graduation than students who complete bachelor’s degrees—unsurprising, given both the lower prices of community colleges and the briefer enrollment—but there is substantial variation by state.8 Michigan’s associate’s degree graduates—mostly completing at community colleges—are in the middle of the pack when compared with other states in the region. (See Table 5.)
Table 5
|
Federal Student Loan Debt at Graduation, by State and Degree Level |
||
| Percentage of Graduates Who Borrowed | Average Debt Burden among Graduates Who Borrowed | |
| Michigan | ||
| Bachelor’s degree | 58% | $24,895 |
| Associate’s degree | 30% | $15,333 |
| Illinois | ||
| Bachelor’s degree | 55% | $21,960 |
| Associate’s degree | 15% | $9,803 |
| Indiana | ||
| Bachelor’s degree | 55% | $24,083 |
| Associate’s degree | 49% | $18,009 |
| Minnesota | ||
| Bachelor’s degree | 59% | $21,239 |
| Associate’s degree | 52% | $17,918 |
| Ohio | ||
| Bachelor’s degree | 59% | $24,060 |
| Associate’s degree | 43% | $17,971 |
| Wisconsin | ||
| Bachelor’s degree | 59% | $22,307 |
| Associate’s degree | 57% | $14,912 |
| National | ||
| Bachelor’s degree | 52% | $21,919 |
| Associate’s degree | 28% | $14,525 |
|
Source: U.S. Department of Education, Preliminary Loan Debt Data by Field of Study, merged 2015–16 and 2016–17 data. |
||
Conclusion
Michigan’s reliance on high tuition to fund its public universities is making those institutions less affordable to its residents than universities in neighboring states. Michigan residents who are considering seeking a bachelor’s degree face higher sticker prices on its public institutions than residents in neighboring states, and may end up not pursuing the bachelor’s, going outside the state, or simply deciding that college isn’t for someone like them. As shown in our previous report, Michigan’s community colleges, though more affordable than its public universities, have suffered from the same reduction in funding over time and have become less affordable than in the past.9
A state system of higher education can contribute to the civil, economic, and cultural life of a state, to the individual fortunes of the residents of a state, and to the overall economic competitiveness in the region. But a commitment to keeping public institutions accessible means ensuring accessibility for all of the residents of a state, especially those most in need of opportunities to gain new credentials, skills, and knowledge.
Acknowledgments
The authors thank Lumina Foundation and the Joyce Foundation for their support of this project. The views expressed in this publication are those of the authors and do not necessarily represent those of either foundation, its officers, or its employees.
Notes
- Peter Granville, Kevin Miller, and Jen Mishory, “Michigan’s College Affordability Crisis,” The Century Foundation, September 6, 2019, https://tcf.org/content/report/michigans-college-affordability-crisis/.
- Michael Mitchell, Michael Leachman, and Matt Saenz, “State Higher Education Funding Cuts Have Pushed Costs to Students, Worsened Inequality,” Center on Budget and Policy Priorities, October 24, 2019, https://www.cbpp.org/research/state-budget-and-tax/state-higher-education-funding-cuts-have-pushed-costs-to-students.
- State funding of higher education institutions in Illinois remains low as a proportion of total budget despite some recovery from the drastic drop in state higher education funding during its 2016 budget crisis. Brian Sigritz, “2019 State Expenditure Report: Fiscal Years 2017–19,” National Association of State Budget Officers, November 21, 2019, https://www.nasbo.org/reports-data/state-expenditure-report. The National Association of State Budget Officers’ reporting of state budget spending on higher education varies from state to state. The values for some states include expenses that are excluded in other states, which may contribute to the differences among states and from other sources of data on state appropriations.
- Appropriations are measured in terms of dollars per “full-time equivalent student” (FTE), to compare across institutions where many enroll part time, and to capture changes in costs that institutions may encounter as enrollments rise and fall. When this report refers to averages per student, it means “per FTE student,” unless otherwise indicated.
- Net price as provided by institutions to the National Center for Education Statistics, Integrated Postsecondary Education Data System (IPEDS), is the average for students who receive Title IV federal aid (for example, Pell grants and federal student loans), but net prices do not reflect loan aid.
- Peter Granville, Kevin Miller, and Jen Mishory, “Michigan’s College Affordability Crisis,” The Century Foundation September 6, 2019, https://tcf.org/content/report/michigans-college-affordability-crisis/.
- Peter Granville, Kevin Miller, and Jen Mishory, “Michigan’s College Affordability Crisis,” September 6, 2019, https://tcf.org/content/report/michigans-college-affordability-crisis/.
- Some colleges do not participate in the federal student loan program. Six community colleges in Illinois do not participate and other colleges have extremely low rates of federal student loan usage; this explains Illinois’s unusually low usage of federal student loans among associate degree completers. Private student loan debt is not reflected in Table 5 and data on private student loan uptake and amounts are less available than data on federal student loans. Several tribal community colleges in Michigan, Minnesota, and Wisconsin also do not participate in the federal student loan program.
- Peter Granville, Kevin Miller, and Jen Mishory, “Michigan’s College Affordability Crisis,” The Century Foundation, September 6, 2019, https://tcf.org/content/report/michigans-college-affordability-crisis/.