
About the Data
The primary source of these data are reports by the states submitted to the U.S. Department of Labor and the U.S. Department of the Treasury. We invite comments and corrections, but users should not expect that data is corrected from any errors of submissions, such as double counting or zeroes. Weekly claims data will be updated on Thursday each week, and monthly data will be updated by the end of the following month (for instance, August data will be posted by the end of September).
Glossary
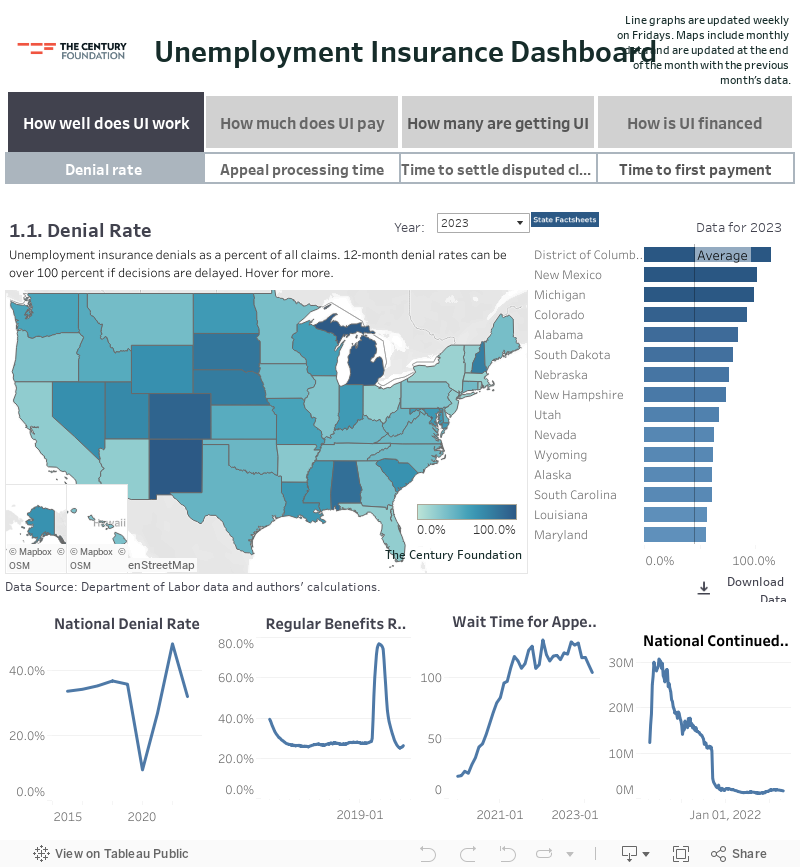
- Denial rate: Unemployment insurance denials as a percent of all claims. This includes claims denied for reasons for unemployment or failure to search actively for work. Because workers could be denied at multiple points in one application, the denial rate can be more than 100 percent. The annual rate is for the most recent 5 months.
- Appeal processing time: The average age of pending appeals expressed in days since the appeal was filed. Appeals can be filed by claimants or employers who disagree with the decision by the state on an eligibility or tax issue. The minimum performance standard is thirty days or less.
- Time to first payments: The time lapse between when an individual is found eligible for benefits and when they receive a payment. The minimum performance standard is twenty-one days (technically, this counts as fourteen days for states that have a statutory waiting week).
- Time to settle disputed claims: The percentage of claims disputed for reasons other than earnings eligibility that are settled within twenty-one days. This is known technically as nonmonetary timeliness. The minimum performance standard is 80 percent of claims decided in twenty-one days per federal regulations. Disputed claims can be for separation or nonseparation issues.
- Separation: An eligibility issue related to the reason that an individual became unemployed, such as whether they were laid off, fired, or quit.
- Nonseparation: An eligibility issue other than how much a worker earned or why they became unemployed. These include whether an individual is available for work, refused a job offer, or failed to search for work.
- Initial claim: A new application for unemployment benefits or to restart unemployment benefits after a subsequent period of unemployment benefits within a benefit year.
- Average weekly benefit amount: The average weekly amount claimants collect for weeks of total unemployment.
- Maximum weekly benefit amount: The maximum weekly amount allowed by law among claimants in a state. States calculate a weekly benefit based on a claimant’s pre-layoff earnings, but this can never go above the maximum amount. Some states have different maximums for claimants with children or who engage in seasonal work. The dashboard reports the lowest maximum weekly benefit amount for the purposes of comparing states in the dashboard.
- Replacement rate: The ratio of the claimants’ weekly benefit amount (WBA) to the claimants’ average weekly wage. This represents how much of claimants’ previously earned average weekly wage the UI benefit is replacing, as a percentage.
- Active caseload: The continued claims of current weekly beneficiaries in all programs.
- Continued claims or insured unemployment: Ongoing claims for unemployment benefits, including weeks that are paid and weeks that are pending or serving a disqualification.
- First payment: The first payment represents the first UI payment received by an eligible unemployed individual.
- Pandemic Unemployment Assistance (PUA): A CARES Act program that expanded states’ ability to provide unemployment insurance for many workers impacted by the COVID-19 pandemic, including for workers who are not ordinarily eligible for unemployment benefits, including independent contractors, self-employed, students and youth, and others who may be unable to prove prior-year income. The program was federally funded, but applicants apply through state systems where eligibility is determined. Read more here.
- Recipiency rate: The percentage of unemployed workers who receive benefits from regular programs out of the total number of unemployed. Historically, experts assume that at least half of unemployed workers are eligible for benefits, so at least 50 percent recipiency rate is the goal.
- Exhaustions: The number of claimants drawing the final payment of their original entitlement for a given program. This represents the number of people who use all of their benefits without finding a job.
- Trust fund balance: The cash balance in the individual unemployment trust fund state account, not including loans as of the end of the month. States with loans could have a negative net balance, which is not shown in the dashboard.
- Average high cost multiple (AHCM): A common actuary measure of UI trust fund adequacy. The AHCM provides an estimate of the length of time (measured in number of years) that the current reserve in the trust fund (without taking into account future revenue income) can pay out benefits at historically high payout rate. If a state’s AHCM is 1.0, the state is expected to be able to pay one year (twelve months) of UI benefits. If the AHCM is 0.5, the state would be able to pay out six months of benefits. The federal pre-recession standard is 1.0.
-
About the Project
The surge in job loss in 2020 exposed deep flaws in the unemployment insurance (UI) safety net, with major delays and uneven access. Now that federal pandemic UI benefits have expired, the core responsibility for unemployment aid sits with the states.
TCF’s new Unemployment Insurance Dashboard is a new, comprehensive database showing access to state benefits for unemployed workers. The dashboard illustrates how state UI programs too often have more holes than safety nets. For example, as of the twelve months ending May 2022, only 29 percent of jobless workers were receiving a state UI payment, down from 76 percent for the year ending January 2021. This is just one of the many structural flaws exposed through this interactive tool.
This project is intended to give policymakers, researchers, and advocates the information they need to identify areas of reform. Importantly, the intersection between racial equity and unemployment benefits has been poorly understood. Our new Demographic and Racial Equity Explorer demonstrates, for example, that states with large Black populations pay out the least generous benefits.
What’s included in this dashboard?
The indicators in the project answer four key questions:
- How well does UI work? The dashboard includes data on what percent of claims are denied, as well as how long it takes to pay benefits to eligible workers, settle claims disputed by employers, and process appeals of decisions. These include core federal performance standards on which states are judged by the federal government.
- How much does UI pay? The dashboard includes data covering the average and maximum unemployment benefit amount in each state, as well as what percentage of workers’ prior wages are replaced by these benefits.
- How many are getting UI? The dashboard includes data detailing current applicants and recipients of state UI benefits, what share of the unemployed collect them, and how many recipients exhaust benefits before finding a job. Information is displayed as raw figures and per-capita, not seasonally adjusted.
- How is UI financed? Each state is responsible for financing its own benefits through state taxes and a state trust fund. The dashboard includes data on whether state trust funds stack up to national standards and the average tax rate on employers.
What other unemployment resources does TCF have?
TCF’s landmark Pandemic Unemployment Dashboard, launched October 2020 and continuously updated, chronicled how well the UI system functioned throughout the COVID-19 pandemic, and is still available as an archive here.
Building on that work, this new dashboard includes more than 50 unemployment insurance indicators for each state over time, which allow for comparisons between the states in benefit levels, timeliness, administration, financing, and recipiency.
Additionally, TCF has newly launched:
- The Unemployment Insurance and Racial Equity Explorer, which allows users to compare differences in state populations by race side-by-side with the state’s access and adequacy of unemployment benefits.
- The fact sheet function, available through the above Racial Equity Explorer, generates a customized state fact sheet comparing variables chosen from the database to all neighboring states.
What if I want to work with the data myself?
The raw data for the project is available in a spreadsheet that includes all of the data here, plus data in the (archived) pandemic dashboard. Working with the data requires you to make a copy of the posted view-only “google sheet.” In addition, those using the fact sheet function can download a more limited set of information using the export function within tableau


