About the Data
The primary source of these data are reports by the states submitted to the U.S. Department of Labor and the U.S. Department of the Treasury. We invite comments and corrections, but users should not expect that data is corrected from any errors of submissions, such as double counting or zeroes. Weekly claims data will be updated on Thursday each week, and monthly data will be updated by the end of the following month (for instance, August data will be posted by the end of September).
Glossary
- Denial rate: Unemployment insurance denials as a percent of all claims. This includes claims denied for reasons for unemployment or failure to search actively for work. Because workers could be denied at multiple points in one application, the denial rate can be more than 100 percent. The annual rate is for the most recent 5 months.
- Appeal processing time: The average age of pending appeals expressed in days since the appeal was filed. Appeals can be filed by claimants or employers who disagree with the decision by the state on an eligibility or tax issue. The minimum performance standard is thirty days or less.
- Time to first payments: The time lapse between when an individual is found eligible for benefits and when they receive a payment. The minimum performance standard is twenty-one days (technically, this counts as fourteen days for states that have a statutory waiting week).
- Time to settle disputed claims: The percentage of claims disputed for reasons other than earnings eligibility that are settled within twenty-one days. This is known technically as nonmonetary timeliness. The minimum performance standard is 80 percent of claims decided in twenty-one days per federal regulations. Disputed claims can be for separation or nonseparation issues.
- Separation: An eligibility issue related to the reason that an individual became unemployed, such as whether they were laid off, fired, or quit.
- Nonseparation: An eligibility issue other than how much a worker earned or why they became unemployed. These include whether an individual is available for work, refused a job offer, or failed to search for work.
- Initial claim: A new application for unemployment benefits or to restart unemployment benefits after a subsequent period of unemployment benefits within a benefit year.
- Average weekly benefit amount: The average weekly amount claimants collect for weeks of total unemployment.
- Maximum weekly benefit amount: The maximum weekly amount allowed by law among claimants in a state. States calculate a weekly benefit based on a claimant’s pre-layoff earnings, but this can never go above the maximum amount. Some states have different maximums for claimants with children or who engage in seasonal work. The dashboard reports the lowest maximum weekly benefit amount for the purposes of comparing states in the dashboard.
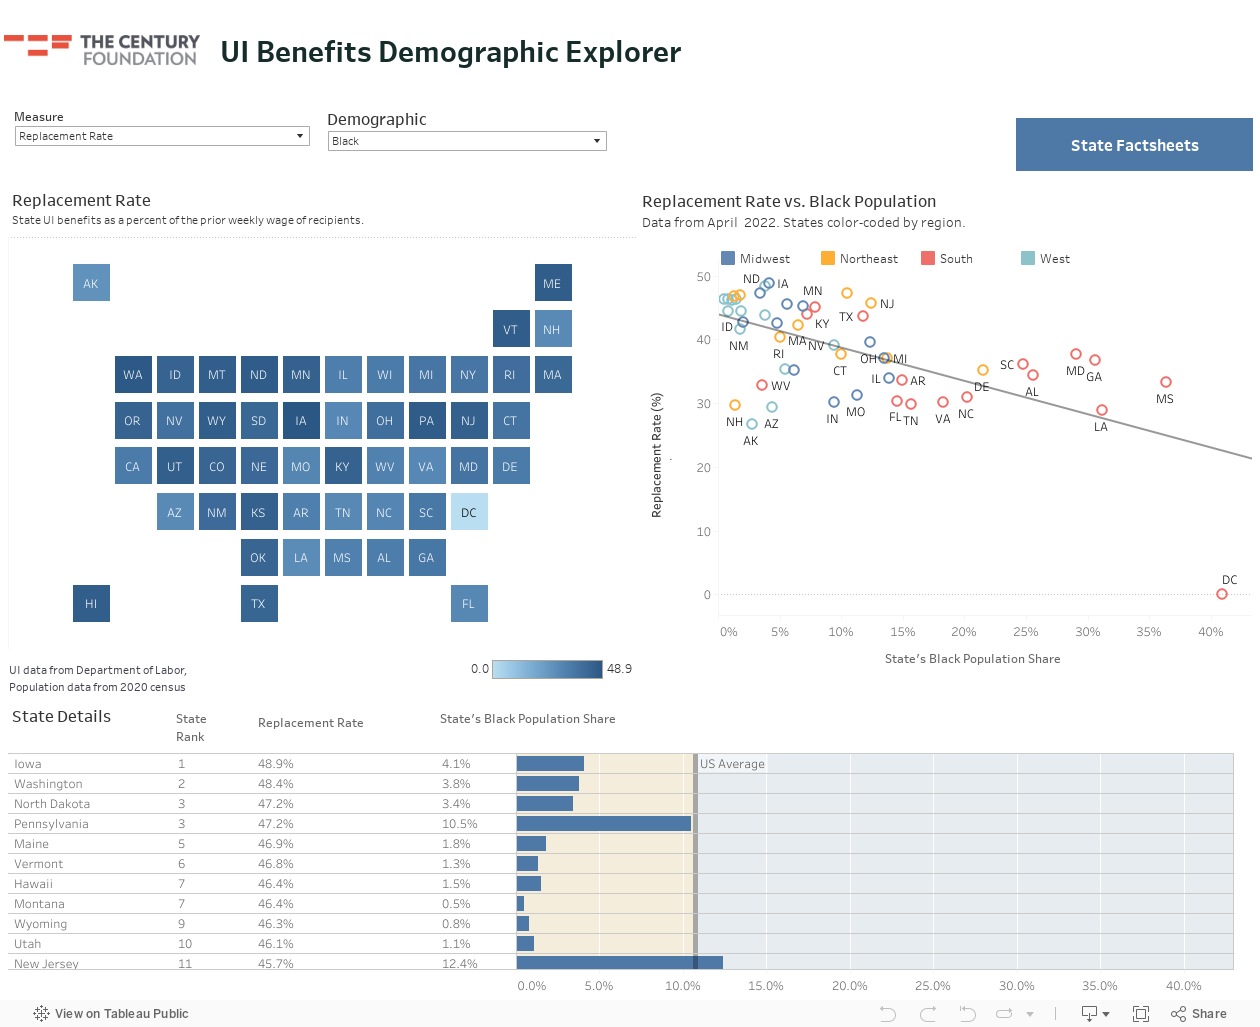
- Replacement rate: The ratio of the claimants’ weekly benefit amount (WBA) to the claimants’ average weekly wage. This represents how much of claimants’ previously earned average weekly wage the UI benefit is replacing, as a percentage.
- Active caseload: The continued claims of current weekly beneficiaries in all programs.
- Continued claims or insured unemployment: Ongoing claims for unemployment benefits, including weeks that are paid and weeks that are pending or serving a disqualification.
- First payment: The first payment represents the first UI payment received by an eligible unemployed individual.
- Pandemic Unemployment Assistance (PUA): A CARES Act program that expanded states’ ability to provide unemployment insurance for many workers impacted by the COVID-19 pandemic, including for workers who are not ordinarily eligible for unemployment benefits, including independent contractors, self-employed, students and youth, and others who may be unable to prove prior-year income. The program was federally funded, but applicants apply through state systems where eligibility is determined. Read more here.
- Recipiency rate: The percentage of unemployed workers who receive benefits from regular programs out of the total number of unemployed. Historically, experts assume that at least half of unemployed workers are eligible for benefits, so at least 50 percent recipiency rate is the goal.
- Exhaustions: The number of claimants drawing the final payment of their original entitlement for a given program. This represents the number of people who use all of their benefits without finding a job.
- Trust fund balance: The cash balance in the individual unemployment trust fund state account, not including loans as of the end of the month. States with loans could have a negative net balance, which is not shown in the dashboard.
- Average high cost multiple (AHCM): A common actuary measure of UI trust fund adequacy. The AHCM provides an estimate of the length of time (measured in number of years) that the current reserve in the trust fund (without taking into account future revenue income) can pay out benefits at historically high payout rate. If a state’s AHCM is 1.0, the state is expected to be able to pay one year (twelve months) of UI benefits. If the AHCM is 0.5, the state would be able to pay out six months of benefits. The federal pre-recession standard is 1.0.
- Average tax rate: The average tax rate as a percent of total wages among taxable employers. This rate is a calculated effective average tax rate that can be compared between states. Each state sets its own taxable wage base and sets nominal tax rates only on a portion of wages, so nominal rates cannot be compared.
- State versus federal benefits: State claims refer to the permanent basic package of up to twenty-six weeks of unemployment available to regular workers in taxable employment. Federal programs cover those not eligible currently for state benefits either because they are long-term unemployed or because they are independent contractors, or did not earn enough to collect state UI. State benefits are paid for through state payroll taxes, and federal benefits are paid for through general revenues or federal unemployment taxes. Federal benefit payments ended for most workers by September 4, 2021. This dashboard is focused on ongoing policies so it centers on state benefits policies.
Welcome to the Unemployment Insurance and Racial Equity Explorer, which is a deeper dive into unemployment insurance data presented in the Unemployment Insurance Data Dashboard.
This page allows users to compare differences in state populations by race with access and adequacy of unemployment benefits. The intersection between racial equity and unemployment benefits has been poorly understood. The demographic explorer demonstrates, for example, that states with large Black populations pay out the least financially generous benefits; and this is just one of such relationships that the project tracks.
The fact sheet function allows users to generate a customized state fact sheet comparing indicators chosen from the database to all neighboring states. You can save a PDF of the fact sheet or download the data for your state and its neighbors by right-clicking the download icon in the bottom right corner of your fact sheet.
To learn more about the project and data, please visit the project home page.
About the Project
The surge in job loss in 2020 exposed deep flaws in the unemployment insurance (UI) safety net, with major delays and uneven access. TCF chronicled these through our pandemic unemployment insurance data dashboard.
Now that federal pandemic unemployment benefits have expired, the core responsibility for unemployment benefits sits with states. TCF’s new Unemployment Insurance Dashboard is being launched in August 2022 to display available data on access to state benefits for unemployed workers. The dashboard illustrates how state unemployment insurance programs too often have more holes than net: as of the twelve months ending May 2022, for example, only 29 percent of jobless workers were receiving a state UI check, down from 76 percent as of the year ending January 2021. This is just one of the structural flaws exposed in the data, and we hope this project gives policymakers and advocates what they need to identify areas of reform.


