Citizen-activists created a new type of popular movement in Lebanon in the spring of 2016, building on a history of activism to contest municipal elections. Their campaign, “Beirut Madinati,” or “Beirut Is My City,” captivated public opinion. It won an impressive 30 percent of the city vote, rattling the country’s corrupt political establishment even though it fell short of obtaining any city council seats because of winner-takes-all election rules. The group’s limited success illustrates the hunger for reform in the Arab world and the ongoing process of organizational learning taking place within and across borders. But Beirut Madinati’s struggle to articulate an overtly political or ideological central animating idea has limited the group’s impact. Its members chose not to compete in the 2017 Lebanese parliamentary elections, and are now trying to build an enduring political organization with roots in Beirut’s neighborhoods. If the group survives and expands, it will represent a new threshold in activist, reformist politics. Its enduring struggles to resolve internal and ideological disputes, however, echo a wider regional problem among secular, anti-sectarian reform movements.
For most of its recent history, Lebanon has hosted an ongoing experiment in abusive governance. The country’s tiny ruling class has grown even more dominant since the civil war, which lasted from 1975 to 1991. A few dozen dynastic families hold the reins of a weak state. Collectively, they have ruled as an oligarchic kleptocracy, preserving the state almost solely as a means to extract rents. This small circle of rulers has grown richer and richer as the quality of life in modern Lebanon has eroded beyond recognition for anyone old enough to remember even the early 1970s. This process of immiseration reached a nadir in the summer of 2015, when a dispute between the warlords who dominate the Lebanese government brought garbage collection to a halt. Suddenly, Beirut and its environs were literally awash in waste. Mass protests broke out in August 2015 in response to the garbage crisis, briefly mobilizing Lebanese from across a spectrum, including followers of rival sectarian warlords and people who normally defined themselves as apolitical.
The warlords swiftly united to stave off the popular challenge to their legitimacy, deploying security forces to crush protests and intelligence operatives to orchestrate sophisticated smear campaigns against protest leaders.1 The people-power mobilization faded as quickly as it had appeared, like many street protest movements in the Arab world since 2010. Yet something new emerged in its wake. A core group of committed activists, technocrats, and citizens organized an overtly political movement, “Beirut Madinati,” or “Beirut Is My City,” which competed for the Beirut municipal council in the May 2016 elections. The organizers were determined to put into practice the lessons learned from decades of activism and from the Arab uprisings, and to seize the momentum of the garbage crisis. Beirut Madinati sought power, not as a protest movement but as a political party.
After an energetic campaign, Beirut Madinati surprised the political establishment by winning 30 percent of the vote—enough to claim a symbolic victory but not to win a single seat on the city council. The group then spent months deliberating whether to continue as a political party. Its members finally opted out of the parliamentary elections expected to take place in 2017, and decided, for the time being, to continue primarily as a watchdog group, pressuring the Beirut municipal council to do a better job.
This report’s close narrative analysis of Beirut Madinati helps identify barriers to entry and electoral success for antiestablishment movements. Given the impossibility of prediction, narrative case studies and other qualitative ethnographic methods open a door to understanding the forces of popular dissatisfaction and the paths through which some movements blossom into high-impact groups.
The story of Beirut Madinati, in itself, illuminates at least three overararching reasons that it should command our attention. Firstly, it sought to attain power rather than protest. Few popular movements since the Arab uprisings have entered directly into politics, abandoning the civil society label to contest elections; still fewer have had staying power. Secondly, it overtly sought to learn from other movements in Lebanon, the Arab world, and other non-Arab countries.2 Finally, it refused on principle to draw on existing ideologies—political or sectarian—or power structures like the ruling families and their heads, the “zu’ama.” The normally fractious rival sectarian warlords and their parties understood the threat, and united to stave off the insurgents.3
The experience of Beirut Madinati shows the benefit of organizational learning and opportunism, but also the limitations of an initiative that lacks an ideological core or animating central idea.
These distinguishing features contributed to Beirut Madinati’s initial success but might ultimately limit its impact. The movement’s meteoric rise, its failure to achieve tangible power or attempt an entrée into national politics, and its long-term trajectory as a reform movement hold important lessons for would-be reformers in the Arab world and beyond. The experience of Beirut Madinati shows the benefit of organizational learning and opportunism, but also the limitations of an initiative that lacks an ideological core or animating central idea.
Taking Back the City: Origins of a Movement
Lebanon’s peak in popular mobilization and protest came in 2005, when mass protests, perhaps involving half the country’s total population, broke out after the assassination of former prime minister Rafik Hariri.4 In quick succession followed a war with Israel, then an ultimately violent internal feud between Lebanon’s sectarian factions over Hezbollah’s rightful share of executive power. The showdown unfolded over nearly two years and climaxed in May 2008 with street battles in Ras Beirut and other flashpoints around the country, which finally prompted the country’s ruling zu’ama to adjust their shares of government power. The outcome of the 2005–8 crises demonstrated that Lebanon’s rulers were incapable of correctly estimating their actual relative power. More troubling, they had no mechanisms of negotiation and conflict resolution short of brinkmanship, confrontation, or violence. The cascades of protests in the end had no impact on the negotiations among the country’s rulers. The system allowed no point of entry for citizens to shape policy, and ruling factions paid no price for destructive behavior.
The regional context also played a major role in shaping events in Lebanon. The constant threat of war with Israel hangs over Lebanon. Since 2011, the civil war in Syria has encroached on Lebanon’s national security. The specter of communal conflict perpetually spurs anxiety among Lebanese: unique among Arab countries, Lebanon has eighteen officially recognized sects with relatively balanced population shares. These demographics fuel conflict, but also preserve a degree of pluralism and consociational decision-making rare in the region. In a regional context of crippled governance, frustrated people-power uprisings, and nascent initiatives for reform and revolution, Lebanon always faces the threat of foreign intervention and catastrophic security breakdown. For most Lebanese, day-to-day peace depends not on the state but on interpersonal neighborhood dynamics, the vagaries of competing foreign governments, self-serving political bosses, and transnational movements. As a result, Lebanon functions as a sort of showcase for the region’s political experiments. Despite its official population, an estimated four to four-and-a-half million,5 Lebanon carries outsize importance for the rest of the Arab world. Lebanon’s strange governing recipe—with corrupt warlords and their militias securing the loyalty of their fiefdoms through patronage—has made for an oddly stable species of postwar recovery.
When revolts swept the Arab world in 2010 and 2011, many Lebanese were wary. On the one hand, the country had a free press, flourishing civil society, and organized political opposition. On the other, it also had fresh memories of the civil war and the 2008 clashes. The country’s rulers had made their fortunes as warlords, and constantly reminded the public that a hard push for reform could easily spark a repeat of the civil war. Fear of anarchy meant that popular revolt had less appeal as a political tool in Lebanon than it did elsewhere in the early years of the Arab uprisings. The war that broke out in Syria in 2011 only exacerbated the anxiety, as Lebanese factions took opposite sides in their neighbor’s strife. Fighting seeped across the border,6 and refugees swelled to 20–25 percent of Lebanon’s total population.7 Even more so than in 2005–8, Lebanon appeared at risk of a violent collapse.
Garbage Piles Up
Inept at so many other aspects of governance, Lebanon’s warlords proved resilient and resourceful at muddling through an acute security crisis from 2011 to 2013. Factional leaders who encouraged their followers to fight to the death under sectarian banners in Syria ordered them to show restraint at home in Lebanon. Their security efforts were surprisingly effective. When their interests were threatened, the zu’ama were capable of coordination and expeditious action. Meanwhile, as security was restored, traditional patronage and corruption thrived, salaries stalled, the cost of living rose, and basic services continually deteriorated. Electricity, water, and garbage collection, which had improved in the 1990s, had declined for a decade and a half. By 2015, the Lebanese infrastructure was experiencing unprecedented levels of strain, and the government refused to take even the most basic action to maintain the existing, poor quality of service. The collapse of governance highlighted an enraging reality: Lebanon’s services were appalling by design, the result of a division of rackets among warlords, whose profits grew as official services declined and citizens were forced to turn to profiteering networks to provide everything from gas and power to, in some cases, neighborhood security.
The garbage crisis marked a turning point for many Lebanese who had been hitherto willing to accede to the ruling clique’s paralyzing logic. Protests in August and September 2015 were the largest and most intense that Lebanon had seen in a decade. The climactic demonstrations on August 22–23 drew an estimated ten thousand protesters8 and were attacked by security forces.9 A week later maybe twenty thousand attended a peaceful follow-up march on downtown Beirut—a small number compared to the millions who demonstrated in 2005 but nevertheless a threat to the status quo because of their simple, radical, and popular message against government corruption, incompetence, and inaction.10 The protests were catalyzed by an antiestablishment group called You Stink, whose name addressed the political class. A small core of activists carefully limited You Stink’s message: the government needed to solve the garbage crisis, and all the existing movements and leaders were guilty. “We insist we don’t want to have a leader or an ideology,” explained one of the You Stink founders, an activist and advertising professional named Assad Thebian.11 “We don’t want to be kidnapped by the left, the right, or civil society. We don’t believe in revolution. We believe in change. We believe all public figures are corrupt.”
You Stink initially resisted calls to expand its critique to the sectarian political system, the electoral law, or other manifestations of public corruption. In keeping with wider regional trends from the 2010–11 Arab uprisings, it tried to divorce “legitimate” protest and popular anger, from the “tainted” game of politics. (Eventually You Stink officially expanded its critique to include Lebanese election laws.) The protest movement quickly balkanized.12 Some factions did embrace an ideological critique of the government, usually from the left. Others targeted elections or corruption, or worked in sync with establishment political parties. Important political blocs took umbrage at You Stink, including the Future Movement, the Free Patriotic Movement, Hezbollah, Amal, and the Progressive Socialist Party, representing the bulk of Sunni, Shia, Druze, and the single most important Maronite faction.
Authorities quickly closed ranks. Police turned tear gas and water cannons against demonstrators. Many were arrested after clashes that appeared incited by agents provocateurs; activists claimed that state security services and political parties deployed violent infiltrators among the ranks of peaceful demonstrators to discredit the protests. Political leaders levied baseless but incendiary allegations that You Stink was destabilizing the country, creating sectarian strife, and insulting religion. Some politicians decried You Stink’s methods but publicly sympathized with the protesters’ demands for an end to corruption—even though they and their parties were integrally tied to the corruption. Government and political party officials released leaks, sometimes false, sometimes culled from sources such as individual Facebook pages and taken out of context, to paint You Stink leaders as atheists, hedonists, al-Qaeda sympathizers, foreign agents, or spoiled out-of-touch members of the elite.13 Protests’ leaders faced threats and were sometimes attacked. One political party, the Christian Free Patriotic Movement, mustered a demonstration of its own that dwarfed the anti-garbage protests, as a reminder that the status quo powers had massive reserves of resources and obedient loyalists. The campaign offered a glimpse of the machinery the state could deploy to shut down any popular movement that it considered a threat.
Government and political party officials released leaks, sometimes false, sometimes culled from sources such as individual Facebook pages and taken out of context, to paint You Stink leaders as atheists, hedonists, al-Qaeda sympathizers, foreign agents, or spoiled out-of-touch members of the elite.
Many of the activists in You Stink, as well as those who went on to establish Beirut Madinati, believe that the establishment parties were behind the sudden proliferation of rival protest groups.14 Competing messages from AstroTurf groups sapped the popular garbage protests of their vigor and drowned out You Stink’s message. Fewer people joined each successive demonstration, and even supporters of You Stink feared that the movement—even unintentionally— created a risk of violence, even by threatening a corrupt status quo.15 The waste crisis worsened, and when the winter rains came and washed through the proliferating illegal dump sites to which Lebanese had resorted, the country’s rivers, streets, and seafront were flooded with garbage. But the political class remained secure, calculating that wider fears—the war in Syria, regional rivalries between Saudi Arabia and Iran, latent sectarian tensions, the threat of violence orchestrated by the very same warlords in order to preserve their fiefs—would suffice to mute popular anger. Nonetheless, they worked hard to demonize the protesters, and their smears found echoes even among fellow dissidents, who whispered that their rivals were paid foreign agents.16
Some protesters were arrested. One was threatened with blasphemy charges. Thebian for a time moved out of his house after receiving threats. “We are fighting a system with no mercy,” Thebian said, assessing his movement’s record after its public activities had dwindled to occasional, small, symbolic anti-corruption actions.17 “Everyone thinks this system is fragile, but I think it’s one of the strongest governing systems.” Because all the major political parties and leaders benefit from corruption, any challenge to the way the system operates, like the assault on the garbage contract, threatens the entire system. You Stink, and the public protests, brought enormous public attention to one particularly egregious example of Lebanese corruption and dysfunction. Lebanon’s rulers weathered the bump in public anger without making any concessions, or reaching a solution to the garbage issue that prompted it. Apparently, the profits to be had through a secret, extortionate waste management contract were worth any short-term political discomfort.
The Legacy of “You Stink”
The activists involved in the garbage campaign, along with many others who were watching sympathetically, or allied with the movement as technical advisers or casual protesters, internalized several lessons about organizing public opinion, and the simultaneous strength and insecurity of the ruling elite. You Stink performed well with a simple, targeted message, and the technocratic expertise it developed about the issue on which it focused. By avoiding direct attacks on specific politicians and on the sectarian system per se, it coined a message about corruption and fixing services that even politicians found themselves forced to agree with, at least rhetorically.18 The movement galvanized a wide array of Lebanese, including some elites and some working class and unemployed, some critics of the system and some political activists who came from established parties. It also brought together a group of political activists, technical experts, and urban planners to propose alternatives to the government’s garbage proposals, and some of them found a voice articulating policy plans rather than simply voicing opposition to the government.19
On the flip side, You Stink’s reliance on volunteer work from young activists who had to support themselves with full-time jobs while simultaneously trying to run a movement left it vulnerable to organization fatigue. Its insistence on internal transparency and a horizontal, leaderless structure made it difficult to make decisions and act quickly. The unexpected vehemence of the official smear campaign, and the sudden spread of rival factions, swamped You Stink’s public message. Finally, because its only tactic was protest and its only issue was garbage, the You Stink movement found itself with no raison d’être when large crowds stopped showing up for demonstrations and the government stalled on the garbage issue. It simply had nothing to do. Its core members, like Thebian, went back to their day jobs. Its main victory had been revealing just how easily spooked the country’s political bosses were. “People were actually demanding a change in the pattern in which we were being governed since the 1990s,” Thebian said.20 “This frightened the politicians. Every political party that has been part of the system has been part of the corruption. This is not something they will sacrifice easily. It is something they took with power, and they will use their power to keep it.”
During the garbage protests, a wide range of veteran activists and new entrants into the public sphere tackled the question of how best to improve Lebanon’s entrenched political system. Arguments took place during street protests, on televised talk shows, and in private activist strategy meetings.21 Competing protest groups contemplated mergers, and some discussed founding a political party. The youth movement galvanized cascades of conversation in different circles, including older activists who had been involved in a variety of campaigns going back decades, including labor organizing, and a loose community of Beirut urban planners, most of whom had some connection to the American University of Beirut (AUB).
Beirut Madinati took shape as the garbage movement lost coherence. By September 2015, a group of activist professionals and academics agreed that they wanted to harness the energy in the You Stink protests into a tangible project. Many ideas were floated: establishing a political party, promoting urban reform in Beirut, fighting corruption, contesting the upcoming municipal elections. Jad Chaaban, an AUB economist, brought in a circle of activists interested in traditional politics and elections, including former journalist Rana Khoury and human rights lawyer Nayla Geagea. Mona Fawaz, an urban planner at AUB, invited planners and architects. They were joined by journalists, engineers, advertising executives, AUB faculty members, and dozens of veterans of past campaigns on causes ranging from civil marriage to the Fouad Boutros Highway, a proposed road through an old neighborhood in Beirut. “It’s not just about making change, but creating a nucleus of people who can create change,” said Fawaz, recalling the early discussions in August and September 2015.22 Chaaban drafted a political party platform, and Fawaz tried to formalize a core group at a dinner party at her home in September.
“It’s not just about making change, but creating a nucleus of people who can create change,”
This core group of Beirut Madinati founders, candidates and volunteers could be roughly described as the secular middle and upper-middle class. Its membership was evenly divided among Lebanon’s sects, but few of its founders or volunteers identified as observant or devoutly religious. Some had family or historical connections to dynastic clans or major political parties, but identified personally as secular, anti-sectarian, and/or independent. With some exceptions, the younger generation of volunteers were educated and activist. Some had been involved with the Secular Club at AUB, a student organization that tried to galvanize anti-sectarian politics and craft an alternative to the existing Lebanese political groupings. The older generation of activists, including the founders, represented, loosely put, the secular Beiruti professional class, traditionally identified with the Ras Beirut area. They were not, as the establishment would later allege, ultrarich, out-of-touch, Francophone, Christian elites; many came from humble or middle-class backgrounds and they operated within the solidly middle-class confines of urban Beirut. Many were white-collar professionals, in advertising, architecture, academia, or the arts, but none were members of the ultrawealthy circle that dominates Lebanese business and politics.
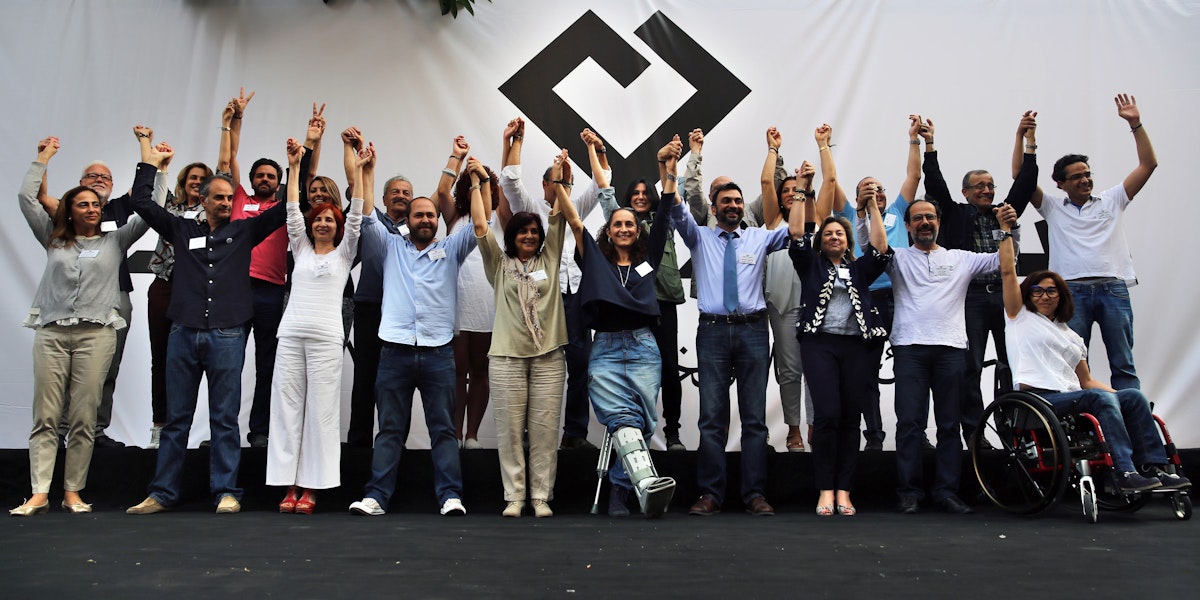
By November a group of political activists, academics and professionals coalesced with the specific goal of competing in the Beirut municipal elections. Within a month, they had created committees, and by January 2016, the program committee had researched and drafted what became the Beirut Madinati electoral campaign platform, which they summarized in a succinct ten-point plan that avoided Lebanese politics and focused on technocratic quality-of-life issues: traffic, parks, public transportation, housing, waste management, and the like.23 Professionals, with experience in political campaigns, marketing, and advertising, contributed their expertise. All told, the dedicated activists and volunteers that drove Beirut Madinati numbered just a few hundred individuals, who raised and spent a total of $415,000 over the course of their campaign. They were arrayed against established parties with legions of paid employees, massive advertising budgets, and full-time operatives and loyalists throughout the city. The founders decided from the start not to include any established politicians, even if they shared the nascent movement’s views, in order to avoid any taint by association with the existing system. They chose a sunny, apolitical name: Beirut Madinati, or Beirut Is My City. “The shift from You Stink to us is from saying, ‘This political class is untenable, rotten, we can’t work with it.’ The next stop is to say, ‘This is what we must do, and this is what the political class should be doing,’” Fawaz said. 24
A Program to Make Life Better
The platform carefully enumerated a to-do list and touted the probity, expertise, and independence of the Beirut Madinati technocrats. The language studiously avoided sounding political. Beirut Madinati was a “campaign,” not a political party, with a “program,” not a platform. The city’s inept leaders had refused all input and had failed in their obligations to citizens. Beirut Madinati’s “primary objective is to make Beirut more livable: more affordable, more walkable, more green, more accessible, and, simply, more pleasant.” Who could oppose such goals? Critics rarely disagreed with the aims, only expressing doubts that technocrats, even in control of the city council, would have enough authority to thwart the wealthy, politically-connected cabal of developers and family dynasties that had driven the city to ruin.
The program’s mission statement imagines Beirut as a city where working people can raise children and grow old with a modicum of comfort and dignity, and where the city government serves the population. In the context of Beirut’s daily dysfunction, such an image is almost fantastical. But the program tries to paint improvement as feasible, breaking down problems by sector and proposing solutions that include minimal, feasible workarounds and building up to bigger, more dreamy improvements. The campaign tended to focus on the most feasible reforms with the most immediate impact: traffic, public transportation, parks and public space, affordable housing in the rampant new construction around the city, waste management, and more transparent and inclusive administration. These weren’t necessarily the most important problems in people’s lives, like health care and education, but they were more easily addressed and fell under the prerogative of municipal authorities.
The movement’s founders had long labored on urban issues, lobbying the city council, with occasional success. As a result, they were familiar with the actual powers of the city council in a system where the national government held most of the purse strings, and authorities crafted their proposals accordingly. If they won seats on the council, they wanted an agenda that was practical and achievable. At the top of the list was transportation. Although Beirut is a small city, geographically, there is no centrally planned public transportation system. Residents rely disproportionately on private cars (70 percent of all trips in the city, according to the Beirut Madinati platform), and an organic, uncoordinated system of privately operated minivans and buses. Beirut Madinati’s platform sought to unify and rationalize the existing routes, and introduce rapid-transit bus routes. They also promised to improve traffic flow by deploying police or traffic monitors, which are currently almost nonexistent unless a VIP is trying to pass through a traffic jam. The urban planning tenor of the traffic proposals masked their profoundly political nature; traditional warlords’ parties could not coordinate across municipal boundaries because of their competition and dysfunction, whereas a nonaligned group like Beirut Madinati could try to coordinate between, for example, minibus drivers based in a Hezbollah area and others from a Future Movement neighborhood.
The urban planning tenor of the traffic proposals masked their profoundly political nature; traditional warlords’ parties could not coordinate across municipal boundaries because of their competition and dysfunction.
The campaign promised, if elected, to increase the amount of green space per person in Beirut from one square meter to five. The city has almost no public parks, and what little open or green space exists is often closed to the public or slated for construction. The campaign’s plan would mark a radical improvement in congested neighborhoods without any expensive intervention: the city could use its legal authority to open access to existing but inaccessible open spaces. Beirut Madinati promised to create a city recycling program to reduce the amount of waste sent to landfills. Municipal buildings would be renovated in keeping with ecologically sound “green” principles. In office, Beirut Madinati would aggressively oversee existing authorities that barely functioned but could improve public safety: monitoring water quality, street lights, and the placement of garbage bins. Finally, and easiest of all to implement, a city council with Beirut Madinati members would hold meetings, publish its records, and attend public hearings—all of which are practices that are already required by law yet do not occur.
The remaining proposals on the program were in a similar vein, but less easily accomplished. Beirut Madinati promised to open public access to the city’s waterfront, establish new markets that encouraged small local producers, add social impact clauses to public contracts, and double the number of public libraries. Hardest of all to achieve, the campaign proposed to convince developers to include affordable housing units in new construction and address the problem of deteriorated housing stock for the poor, and to reform a rent-regulation regime that protected only a small number of tenants. The first items on the program could conceptually be implemented through city council authority without antagonizing any entrenched constituencies. On the other hand, the more ambitious proposals, relating to housing, development, and parking lots, were likely to face stiff opposition from wealthy individuals and constituencies who profit handsomely from the current dysfunction.
The founders of Beirut Madinati hailed from a diversity of professional backgrounds, and as a group they were connected to almost all the well-known reform efforts in Lebanon. This collective record of fighting the system, rather than any expectation of success, endowed the Beirut Madinati team with an aura of optimism and integrity. These were people who had consistently stood against efforts by the elite to take away public goods such as affordable housing, parks, public waterfront areas, union contracts, and a long list of other things. They had campaigned for the rights of the disadvantaged. They had challenged the zu’ama, the ruling families, and had even scored the occasional success. They had blocked a throughway favored by the government and big developers that would have destroyed one of Beirut’s few surviving old-fashioned neighborhoods with an economically diverse population. After years of legwork, one Beirut Madinati candidate had successfully transformed an iconic building ravaged by the civil war into a museum. Several, working together, were fighting a pair of projects that are in the process of destroying the last two remaining natural spaces on the waterfront where Beirut residents can convene. Some had brought attention to the systemic mistreatment of refugees.
Beirut Madinati’s founders repeated in public statements that they thought their movement’s appeal stemmed from the content of its platform, and from the belief they exuded that change was possible. Interviews with volunteers, voters, and sympathizers—as well as the ultimate results—raise the possibility that the movement’s popularity drew more heavily on the personal appeal of the candidates, and frustration with the status quo. In other words, the basket of technical issues—with which no one theoretically disagreed, even the ruling party bosses—were not what inspired volunteers to join Beirut Madinati. Instead, what volunteers and voters said they liked was the integrity of the candidates, their optimism, their refusal to concede defeat to the corrupt government, and the movement’s orientation toward the concerns of regular citizens struggling to make ends meet in a city plagued by traffic and lacking the essential amenities of most cities in the developed world.
This dissonance has characterized Beirut Madinati throughout its existence. Some of its founders speak of the urban platform with genuine conviction, and believe the movement’s longevity relies on achieving tangible results on traffic, development, pollution, and so on. Citizens and voters, on the other hand, seem to be seeking a rallying idea, along with a concrete, mobilizing activity, that will restore any level of accountability and check the runaway powers of an extractive and predatory government. My impression from extensive interviews with Beirut residents is that those who were attracted to Beirut Madinati liked the personalities involved and the sense of possibility and citizen agency that they fostered—much more so than the platform specifics.
Through word of mouth and personal circles, Beirut Madinati assembled a campaign team and solicited volunteers for the election. Traditional campaigns cost an enormous amount of money, much of it spent on advertising and personnel, including thousands of canvassers and election day monitors for the city’s approximately 850 polling stations. Beirut Madinati intended to rely almost exclusively on volunteers and on free or cheap advertising, with the bulk of publicity coming through media coverage and social media shares.25 “The experiment is very simple,” said Chaaban, the AUB economist, during Beirut Madinati’s launch period.26 “There are no political parties in Lebanon. There is a leader, and followers. We want to test this with a focused objective.”
The Election Campaign
Previous Beirut elections had witnessed declining turnout, dropping from a peak of 33 percent in 1998 to 21 percent in 2010 (the same proportion that voted in 2016).27 Popular anger was high in the wake of the garbage protests and other serial governance failures. While the state was weak and municipal government had limited powers, the city council of Beirut had a $240 million operating budget.28 Lebanon at the time had no president, and no parliamentary elections scheduled; the sitting parliament, stuffed with hereditary politicians, had unconstitutionally extended its own mandate by nearly three years in November 2014 on the grounds that a country with a vacant presidency could ill afford a disbanded parliament, and the caretaker government in place could not stage elections for a new one. Municipal elections were the only opportunity to have any impact at all. “People have had enough. It is not enough to have success in our NGOs,” Chaaban said. “We need people like us in power. You can’t just demonstrate and get teargassed.”
Machine politics guaranteed that Lebanese elections, even at the local level, were not genuinely competitive. In most cases, the dominant parties came to agreements beforehand and avoided direct competition. Further complicating matters, Lebanese are forced to vote in their area of origin rather than where they live. The government does not print standardized ballots, and most voters use ballots distributed by parties and local chieftains that, through careful coding such as the font or order of names on the ballot, allow parties to keep track of how people vote. Such practices reinforce vote buying and bloc voting by families and other groupings. Beirut’s electoral boundaries include a Sunni majority, dominated by Saad Hariri’s Future Movement, and a sizable Christian population that supports multiple competing Christian parties. The city limits include about five hundred thousand registered voters, far fewer than the actual population, and do not include adjoining, Shia-dominated areas, which fall in different electoral districts. With the blessing of the other ruling parties in Lebanon, Hariri and his party select the municipal list for Beirut, negotiating with the Christian parties and other smaller groups for shares of the twenty-four seats. By tradition, the slate of candidates on the council is half Christian and half Muslim, in keeping with Beirut’s identity as a mixed city. This precooked system can create interesting paradoxes. For instance, because Hezbollah is not directly involved in the Beirut elections or the city governance, its media outlets have a history of fair, aggressive, and investigative coverage of Beirut city politics. Similarly, the neighborhood bosses who instruct people how to vote hold less sway over Christians and middle-class Sunnis not embedded in Hariri patronage networks.
Normally, a group of activists from the secular intellectual elite would stand almost no chance against the well-oiled political machine of a “zaim” (the singular of zu’ama). But the municipal elections of 2016 offered a rare opportunity, because the city’s dominant political boss had suffered numerous setbacks and was uncharacteristically vulnerable and distracted. As a result of various regional machinations, Saudi Arabia had withdrawn its patronage of Hariri after decades supporting the family dynasty.29 Nearly bankrupt, Hariri faced challenges from other politicians eager to replace him as the nation’s preeminent Sunni leader. This confluence of factors weakened the governing slate and meant that a challenger in the Beirut municipal race would benefit from a historical opening.
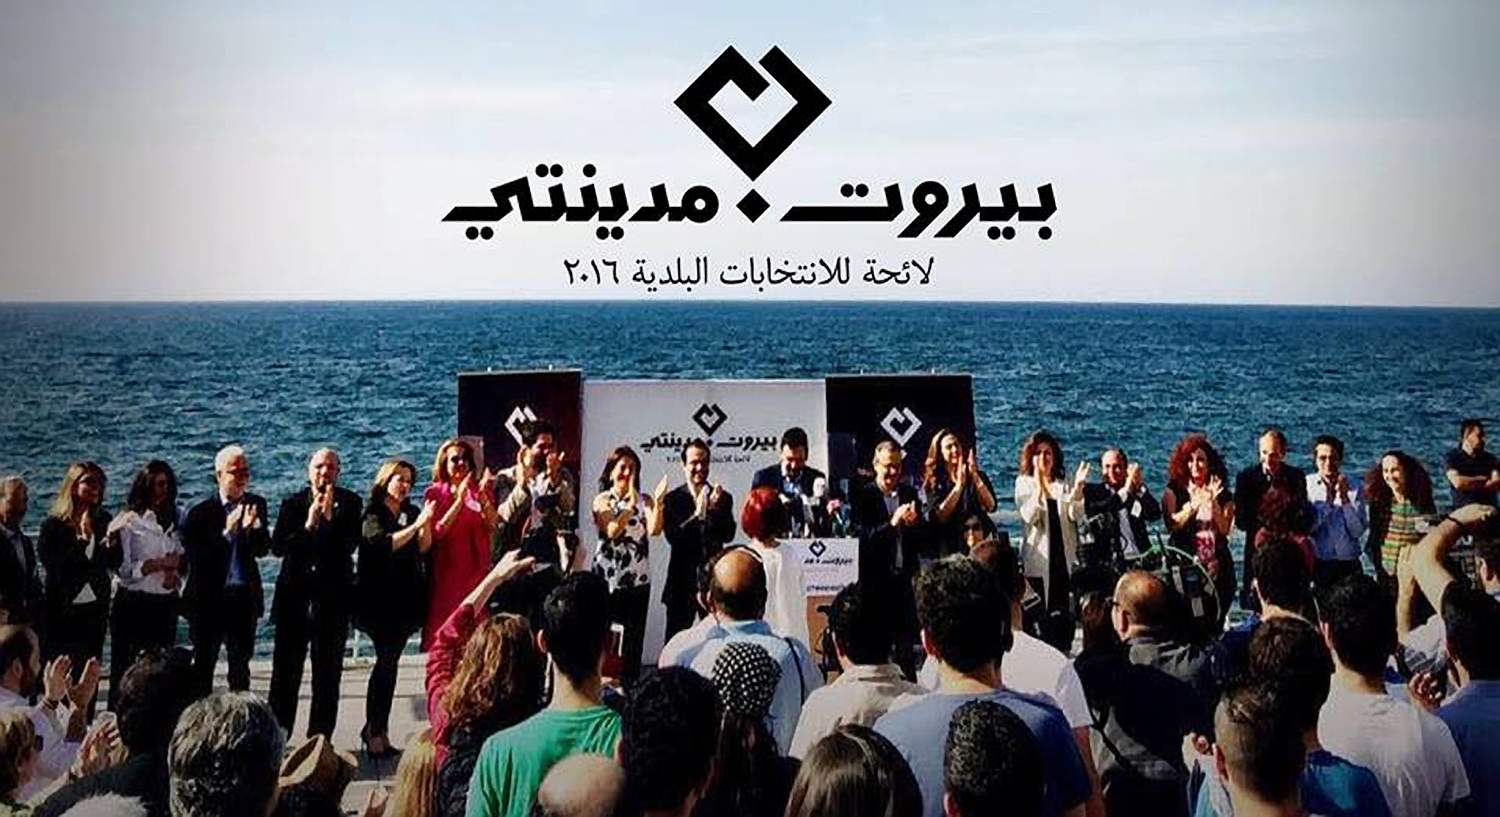
Beirut Madinati’s founders conceived it as an organization that would be egalitarian, inclusive and immune to bossman rule—leading by example in a country where “every party has evolved into a one-man show.”30 The group had a general assembly, which voted on major decisions. A campaign general coordinator and a steering committee oversaw daily operations during the campaign. Beirut Madinati’s strategists might have overestimated their organizational prowess, and initially underestimated how much money they’d be able to raise. Like many reform movements of the era, the insistence on horizontal, consensus-driven, leaderless, transparent internal decision-making put a low ceiling on ideological appeal, flexibility, and speedy decision making.31 The campaign officially launched on March 23 with a press conference at a seaside restaurant in Ras Beirut. A full slate of twenty-four candidates was unveiled. A month earlier Chaaban had expressed modest hopes for success, but heartened by the response they’d elicited in their call for volunteers and donations, the campaign steering committee now hoped to win a significant share, maybe even a majority, of the city council seats.
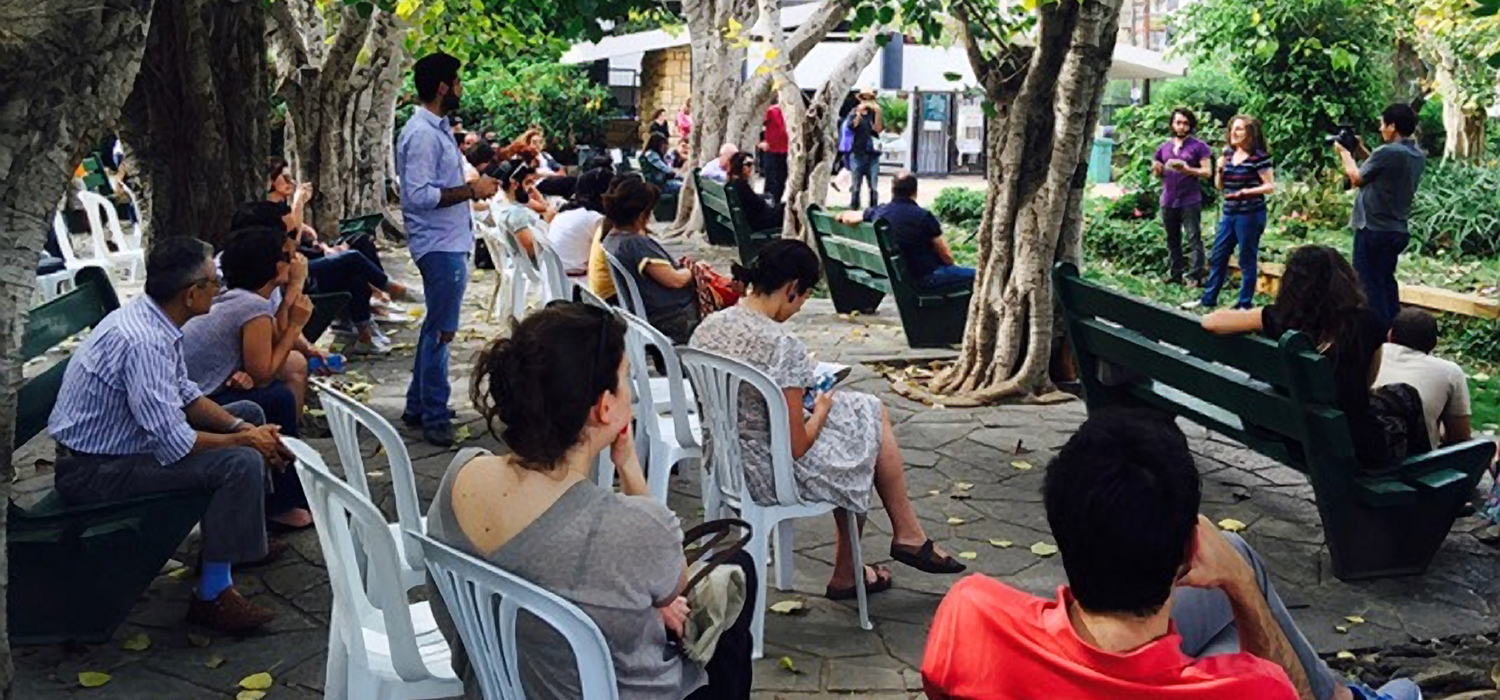
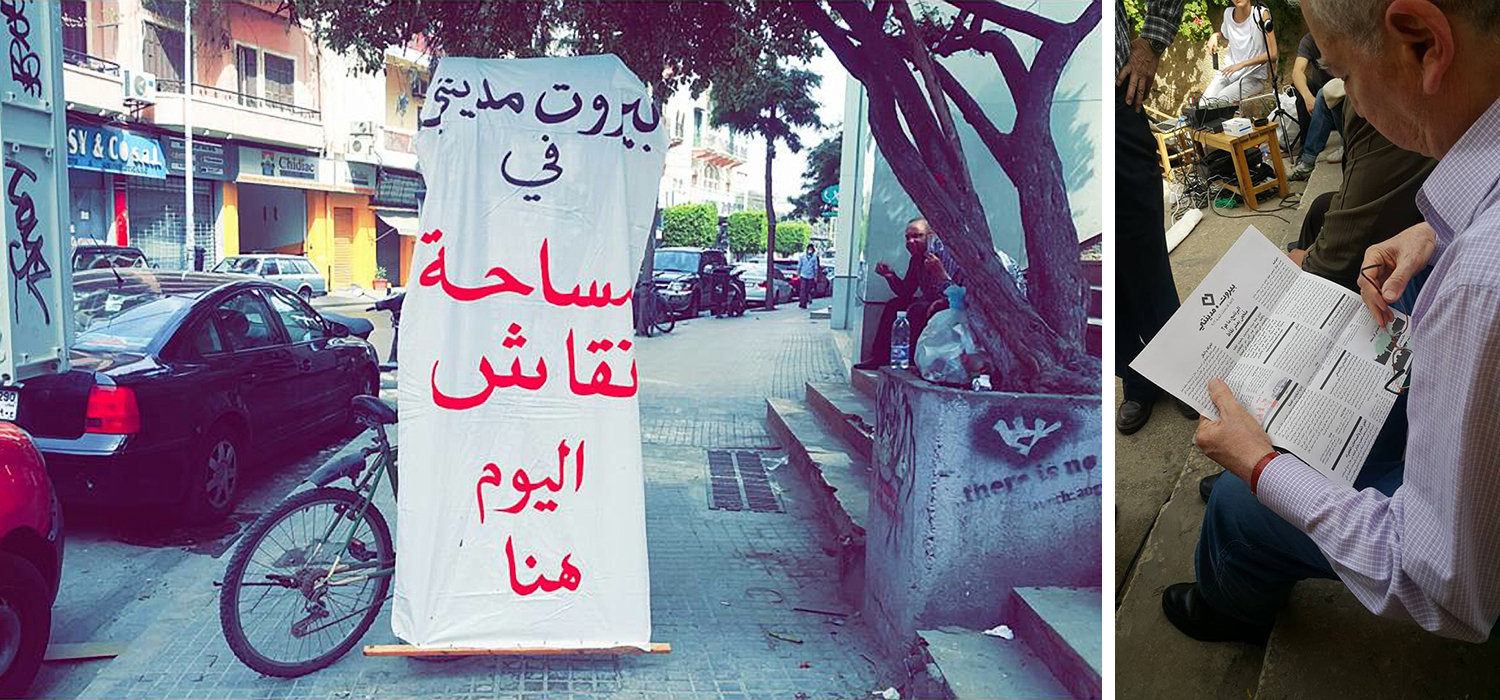
Good governance undergirded the platform. The slate intended to campaign door to door and neighborhood by neighborhood, relying on volunteer canvassers and open public events called “discussion spaces” or “open squares” (masahet naqash in Arabic) that would take place in underutilized public spaces and call attention to the city government’s marginalization of neighborhoods and citizens. Meanwhile, the established parties opted not to fight each other and instead assembled a single establishment “Beirutis” list, which unsubtly marketed itself as the rightful guardians of the city’s old-timers against a destabilizing, rabble-rousing group of upstart newcomers.
With less than two months to campaign and long odds, Beirut Madinati generated a fair amount of buzz. Lebanese media gave its candidates and founders extensive coverage, another result of Lebanon’s open, pluralistic system, which meant that political bosses couldn’t simply quash media coverage they didn’t like.32 Among educated, online networks, the campaign dominated social media streams. But many of the scheduled public assemblies were cancelled or failed to materialized; in some instances, Beirut Madinati blamed the Future Movement or conservative city notables for strong-arming neighborhood power brokers into cancelling support for Beirut Madinati’s public meetings, while in other cases, cancellations seemed to result from gaps in organizational capacity. Discussion spaces in marginalized neighborhoods drew modest crowds, and often half or more of the attendees were already Beirut Madinati volunteers, rather than prospective voters drawn by a neighborhood forum. The organization couldn’t absorb all the volunteers, and voter outreach was underwhelming: Beirut Madinati did not engage in systematic door-to-door canvassing.
In some cases, Beirut Madinati volunteers faced direct intimidation, especially in neighborhoods where established parties like the Future Movement or Amal routinely deployed thuggish cadres to signal their party’s hold over an area.
In some cases, Beirut Madinati volunteers faced direct intimidation, especially in neighborhoods where established parties like the Future Movement or Amal routinely deployed thuggish cadres to signal their party’s hold over an area. Many of these areas were also the most neglected, like the poor Sunni quarter of Tariq al-Jadideh, which consistently voted for Saad Hariri as a sort of tribal sectarian protector, and in return, received even less than neighborhoods of shifting loyalty. “We don’t trust anyone, but we’ll vote for Hariri in order to show that we exist,” a Tariq al-Jadideh local boss named Ahmed Shara’l explained. “With the leaders we know, we’re still losing. Imagine how much more we lose if they’re gone.” Against this zero-sum logic, Beirut Madinati struggled to make inroads. Even mistreated clientelistic voters understood the logic of the system, and they reasonably doubted that a movement like Beirut Madinati, even if victorious, would be able to offer them anything at all: services, security, or representation within the narrow circles of power where decisions are made.
The establishment alliance seemed to take seriously the threat posed by Beirut Madinati, but considered it a “friendly” challenge. Hariri later described it as a well-meaning list that “shares our ambitions and values.”33 In any case, the establishment list added some fresh faces and adopted much of the rhetoric of Beirut Madinati, speaking suddenly of green spaces and quality of life. Major figures, including the minister of the interior, who by law is supposed to be a neutral figure overseeing the integrity of elections, endorsed Hariri’s list in the last weeks of the campaign, which also witnessed a sudden spree of billboards and radio ads. An orchestrated whisper campaign painted Beirut Madinati as Christian, elitist, and likely ineffectual—a rich claim coming from a list dominated by ultrawealthy clans and business interests. The establishment apparently calculated it could win without employing any harder tactics against Beirut Madinati.
For its part, Beirut Madinati campaigned politely, taking care not to provoke the establishment by frontal attacks. It did, however, raise expectations of an electoral victory among the core group of several hundred volunteers who immersed themselves nearly full-time in the effort in the month before the election, on May 8, 2016. Beirut Madinati spurred a national conversation about reform and obliquely raised the central concerns with the sectarian political system: that it had failed in even the most easily addressed practical ways. Members of Beirut Madinati’s steering committee telephoned officials in the Future Movement, asking them to use their influence to discourage the intimidation tactics being deployed against Beirut Madinati. The request did not yield any result. Such is the power and mystique of the country’s warlords that many Beirut Madinati activists worried that Saad Hariri would be able, if he chose, to simply shut down their campaign, or buy off critical activists with offers of lucrative consultancies or political positions. In any event, Hariri’s alliance copied some of the urban reform policy messages of Beirut Madinati, and made clear that a loss of control over the city could create a serious risk of sectarian violence—but nevertheless allowed its rivals to campaign.
Despite the media buzz that preceded it, election day in Beirut was quiet. “We’ve opened a Pandora’s Box,” said Ibrahim Mneimneh, an engineer who headed the Beirut Madinati candidates list, awaiting results at Beirut Madinati’s temporary headquarters.34 “People wanted to give a slap in the face to their sectarian leaders, without taking a huge risk. It’s just the right dose.” When the votes were counted, though, it appeared that far fewer Beirutis were willing to give that slap in the face to their established leaders than Beirut Madinati strategists had predicted.
Initial results showed that Beirut Madinati performed impressively, and most media reports carried an assessment based on partial returns.35 When final tallies were published, however, Beirut Madinati had won only 30 percent of the vote (not the 40 percent initially reported); still an impressive showing.36 Under proportional representation, Beirut Madinati’s votes might have given it ten of the twenty-four seats on the council. But under the existing rules, despite the group’s performance, it did not win a single city council seat. Only 20 percent of registered voters actually voted, but Beirut Madinati won the city’s mostly Christian parliamentary first district. According to Ramez Dagher’s analysis on his blog Moulahazat, about 30 percent of the city’s Sunni voters defected, despite a drumbeat of scare tactics. The numbers involved were quite small in absolute terms. After all the campaigning, the establishment’s Beirutis list was able to sweep the council with just 47,465 people voting for the top finisher and 38,989 for the lowest. There was a sizable gap between the lowest-scoring winner and the top vote-getter from Beirut Madinati, the list leader Ibrahim Mneimneh, who won 31,933 votes. Compared to the campaign’s original predictions, the number of election day voters was a disappointment, even if it was impressive for an upstart campaign with little financing.37
To Continue in Politics or Work as an Urban NGO?
In some ways, Beirut Madinati was incredibly shrewd, opportunistic, and pragmatic, but from another angle the same virtues could be viewed as overly cautious, bland, politically shortsighted, and conservative. The movement wanted to reject sectarianism, but carefully balanced its list: half Christian, half Muslim, half male, half female.38 The caution didn’t insulate Beirut Madinati from the slur that it was a pet project of hypereducated cosmopolitans more comfortable in bars than Beirut’s hardscrabble streets, dominated by Francophone Christians. This stereotyping, backed by establishment media, completely misrepresented the reality of Beirut Madinati and ignored the fact that the establishment was decidedly richer, more elite, and packed with leaders who spent more time abroad than in Lebanon. Nonetheless the tactic worked, and Beirut Madinati’s choice not to confront Hariri or other leaders directly, or to criticize sectarianism directly, might have cost the movement an opportunity to motivate otherwise apathetic and dejected voters.
Beirut Madinati carefully studied other movements and weighed the risks and possibilities of the current political moment in Lebanon. Its founders, candidates and volunteers were almost uniformly vocal critics of their country’s political leadership, endemic corruption, and governing system. Most were secular, anti-sectarian, and had no faith in the existing political parties. On the other hand, many of the secular anti-sectarians and technocrats had sectarian backgrounds, and affiliations to ideologies (leftism, socialism, resistance) or to specific political figures. They could set these differences aside for a short period while working on a ten-point quality-of-life improvement plan for Beirut, but when talk turned to national issues or root-and-branch reform of the system, the common ground quickly narrowed. Some had sympathies for the Future Movement, or for Hezbollah. Some considered themselves as communist or socialist, and had problems with what they saw as the neoliberal leanings of other members.
Elsewhere in Lebanon, voters had defected from the ruling parties in favor of groupings that were in some ways even more conservative and status quo than the ruling circle, representing tribes, families, or extreme populists from established political parties. The most successful were dissidents from within ruling circles who didn’t challenge corruption, sectarianism, or warlordism, but simply vowed to do a better job within its constrictions. A prime example is Ashraf Rifi, a former justice minister who resigned from the Sunni Future Movement and won the local elections in Tripoli.
The founders of Beirut Madinati were determined that their movement endure and preserve its unique internal character. They also felt a responsibility to their voters. After a “victory rally” in the parking lot by the Beirut Forum, despite disappointment over their loss, the group’s general assembly, consisting of about eighty members, met repeatedly over the summer to assess the election and choose a path forward. The internal debate quickly broke down into two almost evenly matched factions: one that wanted to focus on Beirut, and one that believed the movement should also address national politics. The Beirut faction believed the group should consolidate its electoral achievement, build a viable organization in the city, and spend the next six years of the city council’s term pushing for better governance and fighting various toxic urban development projects. The core of this group included some activists who had already spent decades working on urban causes in Beirut. The politics faction believed that the entire purpose had always been to challenge the failing sectarian political system; the municipal elections had been the vehicle available to challenge the status quo, and the future would soon bring more important targets, like the 2017 parliamentary elections.
In keeping with a dominant activist ethos, Beirut Madinati’s membership believed the process was as important as the outcome. They had run a leaderless campaign in order to show Lebanon it was possible to have a charismatic movement without a bossman. Now they wanted to take an existential decision in a deliberative, transparent, and inclusive fashion. In the event, the discussions turned acrimonious and stretched five months, from June through October of 2016. The debate—to run or not to run, to be a political party or an accountability movement—echoed the dilemma of anti-sectarian, secular, reform, and revolutionary movements almost everywhere. Opposition, protest, and citizen watchdog pressure were endowed with an air of unity, purity, and legitimacy, whereas power-seeking, election campaigning, and questions of national political allegiance or ideology were viewed as dirty, opportunistic, and dividing. “I’m afraid it will tear us apart,” said one leader of the organization during the final stages of the debate. “We’re stuck,” said another.39
This debate took place with an amount of self-awareness, openness and sophistication rarely seen in the Middle East. For many Beirut Madinati members, even the label “party” provoked almost an allergic reaction. “The word ‘politics’ in Lebanon has a negative connotation. It is a major hurdle to how to organize effectively,” Chaaban said during the early stages of the debate.40 “Maybe we can find an alternative to the word ‘hizb’ [party] in Arabic.”
In the end, the Beirut faction prevailed, and the group opted to proceed de facto as an NGO (although it employs the language of a “political platform”) and explicitly not as a political party. It would focus for the time being on pressuring the new municipal council, which had continued in the style of its predecessor, keeping the budget secret, holding no public meetings, ignoring all requests for information and hearings, while pushing forward private luxury projects on the city’s remaining waterfront and public land. Divisions had flared between left and right, sympathizers with Hezbollah and the Future Movement, outright secularists and more conservative incremental reformers, political savants, and idealistic activists.
“People hate politics. We want to reclaim the political,” said Fawaz, who was ambivalent about the wisest option for the movement.41 She believed that small victories were possible on practical urban issues, but that Lebanon was doomed without major national political reform. Ibrahim Mneimneh feared that politics would destroy the movement. People liked Beirut Madinati, he said, because it stayed away from sensitive issues. “Secularism is taboo,” he said. “We have to be clearly against the sectarian system. We can show this system has led to terrible results. Our key to success at a national level is finding a way to talk about an issue like security or corruption without singling out any political movement or sect and making them feel targeted.”
A further objection to politics was practical (and risk-averse). Under almost any imaginable scenario, Lebanon’s parliamentary election laws would overwhelmingly favor the existing dominant parties in some version of winner-takes-all voting. Beirut Madinati would face even longer odds in parliamentary elections than they did in the Beirut city race, because the districts are even more heavily gerrymandered and, with high stakes, the establishment would be unlikely to be caught unprepared like it was during the municipal races. Any campaign they ran would have to be intended largely for public education and organizational capacity building. “I believe you should be with the people on the ground,” said Mona El Hallak, an architect and founder of the Beit Beirut city museum, and one of the Beirut Madinati candidates.42 “That’s why I don’t see parliamentary elections as something of value. I don’t believe in the political discourse in this country.” The general assembly voted on October 29, 2017, not to run for parliamentary elections, by a narrow vote: thirty-one for, thirty-six against.43 Even ambivalent members said the movement just wasn’t mature enough, organizationally, for a national election campaign and inevitable strains it would bring. Inexperienced in politics, many members didn’t see any value in a campaign or, in the event of success, of serving as opposition members in the national legislature. “If we win parliamentary elections, what change would this bring to the people?” Mneimneh said.44 “We would be in the opposition and unable to deliver anything.”
As an organization, Beirut Madinati entered 2017 with a clear agenda to challenge the city municipality and focus on specific urban projects. Some of its activist members have mobilized to fight a major private development in Ramlet al-Baida, the only remaining public beach in Beirut.45 A newly elected leadership structure is working to build the organization and institutionalize its ideas of neighborhood engagement and local government advocacy. Some members are planning a spinoff to run for parliament anyway, in the hopes that they can build on their learning experience inside Beirut Madinati but not endanger the parent organization if their bid fails.
The Implications of Beirut Madinati
On the tangible plane, Beirut Madinati’s achievements remain modest, although important: it created a small but dynamic organization, it raised the profile of several urban planning issues in the Lebanese public discourse, and performed uniquely well for an independent movement in an Arab election. Its postelection triumphs lie in the intangible and less easily assessed: unlocked possibilities, a newfound sense of popular agency and power, and an organizational method that attempts to transcend the ideological divisions among Arab reform and opposition movements and chart a path to improve people’s lives through sustained, opportunistic assaults on poor government policies.46 At this early stage it is possible from Beirut Madinati’s performance to discern a few positive trends around organizational learning and diagnose a sharp, persistent problem with ideology and pure political content, which continues to hamper, and limit, anti-government activism.
Immediately after the election in May, Beirut Madinati’s achievements created a sense of possibility. “Beirut Madinati also introduced a new way of doing politics,” wrote Kim Ghattas, a longtime observer of Lebanese politics.47 Headlines proliferated in the vein of the normally acerbic Dagher’s blog post, which was uncharacteristically titled “The Example of Beirut Madinati: Change Is Possible.” Several other bloggers and normally salty Lebanese commentators wrote analyses along the same lines, arguing that the style and content of political discourse, along with the parameters, of the possible, had changed “for good . . . we are winning the narrative war.”48 Sami Attalah, head of the Lebanese Center for Policy Studies, speculated that the 2017 parliamentary elections would be contested more spiritedly than ever, after the trail blazed by Beirut Madinati in the municipal polls.49 The new municipal council abandoned the conciliatory rhetoric of the election period and acted, if anything, even more impetuously and secretively than before. But the impact of Beirut Madinati and You Stink echoed in the system, for instance in the adoption of a progressive platform by the Kataeb Party, a traditional Christian party with a warlord history that in 2016 refashioned itself as a champion of reform, devolution, and environmental causes.50 Kataeb members joined garbage protests and sympathetically attended Beirut Madinati open discussion events. Whether or not they were opportunistically availing themselves of a new potential base as their support slipped as a result of an alliance between its Christian rivals, the Kataeb was following an agenda blazed by Beirut Madinati. Such emulation was among the movement’s original goals.

The triumphalist postelection mood might have been overblown, or intentionally exaggerated for effect. Months later, several Beirut Madinati founders and members collaborated on a case study that soberly situated the group’s electoral success in a context of failing trust in the Lebanese government and roiling regional insecurity, typified by the war in Syria.51 The elections, they argued, had broken into the stale monopoly over power of the dominant ruling political parties, and could pave the way to the introduction of new entrants into the country’s political scene. But the author-activists also sagely observe that their success could provoke the ruling warlords to “amplify their rhetoric of fear,” fighting the upstarts by rallying their constituents along sectarian lines.52 By their own assessment, even a limited success against entrenched powers created new dangers as well as opportunities.
Partisans of Beirut Madinati invest high hopes in the organization’s model, approach, tactics, and strategy. They are contending with the regional stigma against politics, and developing an organizational structure that they believe can sustain them over the long term.53 They correctly understand their movement, and public support, as products of unique and specific circumstances in Lebanon, the Arab region, and the modern world. Unlike some of their more idealistic counterparts during the Arab uprisings, they do not see themselves standing outside history or local context. They believe that political power requires small causes embedded in a grand vision. Even those members of Beirut Madinati who opposed entering national politics in time for the May 2017 parliamentary elections did not do so because they want to remain apolitical, but because they believed the most effective way to propel an anti-sectarian political agenda was to focus on a small arena—Beirut city politics—and deliver results. They might be mistaken in their specific choices, but they have moved from the politics of protest into long-term policy work and the pursuit of power and different modes of governance. They are opposing the status quo and simultaneously holding themselves responsible for proposing an alternative. This is credible, sustainable opposition political work.
The Case for Explicit, Mobilizing Ideology
Arab authoritarians and governing cliques might not truly believe the ideologies they invoke, but these ideologies are useful identifiers and for many of their followers, effective mobilizing tools. Without easily understandable, undeniably important core ideological markers, movements that oppose power structures and channel popular frustrations will struggle to cross a threshold from protest movement to sustainable political party or mass movement. Beirut Madinati exemplifies this “hollow core” problem.54 Its members and founders often have bold and clear ideological convictions, but the movement itself seeks to be inclusive and nonideological, at the expense of a coherent, constructive unifying principle. One founder, Khoury, neatly if unintentionally summed up the problem: “We are trying to be a positive campaign, and asking voters to vote FOR something not AGAINST something. We are trying to keep positive relations with all stakeholders.”55 Of course, even the most successful politicians and movements don’t appeal to everyone, and while it’s possible to strive for civility while addressing fundamental civic concerns, it is impossible to engage in meaningful politics and at the same time “keep positive relations” with everybody. That fear of offense, exclusion and conflict characterizes many activist movements, and beyond a certain point paralyzes them.
Beirut Madinati eschewed the ideological debates of its time and place, even hesitating to make clear that it was an almost entirely secular movement. Its campaign was based on vague concepts of reform and accountability and transparency, which elided its internal, ideological, and political contradictions between leftists and liberals, between secular anti-sectarians and sectarian reformers, and other important cleavages. The slick name worked well during the campaign but in its aftermath carried a whiff of vagueness, marketing over substance. The overall packaging echoed Islamists around the region who, although from a different starting point, seek to downplay core ideologies and appeal to quality of life concerns, running for office with long, detail-rich policy platforms and parties whose names are comprised in mix-and-match fashion of the words justice, reform, development and freedom. Beirut Madinati, in its quest for virtue, still carried many of the vices of the society it wished to reform.
“We don’t care about all your municipal bullshit, when the whole country and state is falling down. There is a possibility to change the whole system. Our objective is to build a political alternative.”
Any effective long-term mobilization will require a core committed cadre, resources, and ideological clarity—whether unity of purpose emerges in a negative project (oppose the corrupt state), a positive project (build a nonsectarian system of good governance), or a to-do list. One alternative to Beirut Madinati experimented with an ideological approach, but fared poorly in the municipal elections—perhaps because despite its message it looked like another one-man show in the model of the existing warlord parties. Charbel Nahhas in the spring of 2015 founded a national political party called “Citizens within a State,” which openly campaigned for a secular, democratic system of government. It had a clear ideology, with a socialist economic platform, and overt national aspirations. It ran municipal slates throughout Lebanon. But the movement attracted very few members, funds, or voters, despite its sharp critique of the system, perhaps because of Nahhas’s plodding rhetorical style, history as a minister, and continuing close ties to government figures.56 He predicted Beirut Madinati would fail because it was afraid to attack Lebanon’s corrupt leaders directly. “They had a managerial paradigm. They play a game within the logic of the system,” Nahhas said.57 “They present themselves as an effective alternative to the badly performing team. They are challenging the team, not the system.” Nahhas put pithily a concern about Beirut Madinati’s approach that speaks as well to a wide array of anti-sectarian, secular reform activists in the Arab world who focus on narrow platforms for fear of alienating a conservative, sectarian, or religious public: “We don’t care about all your municipal bullshit, when the whole country and state is falling down. There is a possibility to change the whole system. Our objective is to build a political alternative.”
Inclusive Organizing, Embedding Contradictions
Observers of Beirut Madinati and You Stink before it were far more likely to foist unrealistic expectations on the social movements than the actual activists involved. Internally, as we have seen, many of Beirut Madinati’s architects were sanguine about the limitations of its approach, and the internal divisions it had papered over. The initiative’s pragmatism, and lack of ideology, were among its central features. Researcher Deen Sharp aptly distinguished Beirut Madinati from other popular movements, in the Arab world and in Europe (like Podemos and Syriza). Beirut Madinati, “for better or worse” defined a limited program, marketed a message of hope rather than protest, embraced opportunistic tactics, and positioned itself as an urban campaign.58 Sharp argues that Beirut Madinati exemplifies a new type of social movement, but questions whether it can achieve tangible social change.
The case of Beirut Madinati has great resonance for advocates of citizenship and alternative bases for building governance legitimacy and statehood in the Arab world. Beirut Madinati’s performance, building on the record of other civil society and people-power political movements in Lebanon and the Arab region, suggests some necessary if insufficient preconditions for systemic change. Popular citizens’ movements in the region will need a coherent and identifiable ideology in order to mobilize on a sustained basis and contest power. (Protest fatigue and a fuzzy ideological core hampered and ultimately divided revolutionaries in Egypt from 2011 to 2013, leaving them at a gross disadvantage to authoritarians from Islamist or secular military backgrounds.)59 It is dreary, difficult, and often quixotic to seek to change the policies or composition of an authoritarian government. Echoing activists themselves, some researchers caution against overestimating the potential of civil society, or underestimating the resilience of malignant governing systems. Lebanese elections, like the trappings of democracy in Putin’s Russia and other post-Communist authoritarian societies, have been engineered by an entrenched elite to maintain power, not as an exercise in accountability. “Carefully managed elections can also provide elites with a safety valve to protect themselves from wholesale change,” write Stephen Deets and Jennifer Skulte-Ouaiss in an analysis that compares Beirut Madinati to the experience of Eastern Europe after the fall of the Soviet Union in 1991 and the transition away from Communism.60 The system, they point out, possesses a powerful “combination of democratic stability and democratic dysfunction.”61
On the level of tactics, Beirut Madinati avoided many of the mistakes or limiting choices of their immediate past peers. While it had a “horizontal” and inclusive internal structure, despite its pretension to being leaderless, it also had a clear and nimble leadership structure during the campaign period. It did not waste time with the sort of debates that hobbled Egyptian revolutionaries and the Lebanese garbage protest movements, like whether to talk to and meet with governing powers. Beirut Madinati was willing to talk to anyone, correctly understanding that with confident political management it could explain the distinction between talking to the system and being co-opted by it. The activists also attempted to extricate themselves from a circular debate about legitimacy, authenticity and revolutionary purity, framing their mission as a quest for tangible results—in their case, quality of life and governance improvements for Beirut. Shrewdly, this framing will allow Beirut Madinati to claim credit in the future for small but tangible achievements that might result from pressure, lobbying and public campaigning—new parks, an improvement in public services, or land use.
Finally, although it is a work in progress, Beirut Madinati has advanced a conceptual and tactical discussion about how best to pursue an activist agenda in the aftermath of the Arab uprisings. To the questions of “protest or politics?” and “narrow issue-advocacy or broader electoral coalition-building?” Beirut Madinati has doubled down and answered, “both.” As a movement and organization it might well fail. But its roadmap tries to follow multiple paths simultaneously. Its next step proposes to build a citywide organization with permanent staff, and liaisons to the community as well as to the government. Beirut Madinati could accomplish a major feat if, under the guise of inclusive technocratic organizing, it propagates an ideology of secular, anti-sectarian state-building. If it can successfully muster the resources and personnel to develop an organization that plays a sustained watchdog function, encapsulates the notions of constituent services and community advocacy, and embodies anti-sectarian, anti-corruption, and consultative democracy in the guise of community planning, then Beirut Madinati will have smuggled radical political alternatives into the stultified realm of Lebanese politics. If, on the contrary, it pursues a solely incremental urban reform agenda and never matures into a full-fledged anti-sectarian political party, it will perhaps make a meaningful contribution to Lebanon’s already rich civic life, without producing fundamental change in its politics—joining the country’s ranks of illustrious NGOs.
Narrative and Other Qualitative Methods
The case of Beirut Madinati also brings to the foreground questions of analysts’ methods. A prevailing obsession with data and quantitative analysis often limits the ability of analysts, scholars, and participants to notice trends. A more narrative approach can inform analysis of political life, especially in contexts where there are few meaningful, easily measurable data points comparable to the constant churn of election results, opinion surveys, and household data available in open, democratic societies. Taken as a whole, the Arab uprisings and the continuing political efforts, like Beirut Madinati, suggest that political analysts should dispense with efforts at prediction, and should wholeheartedly embrace descriptive, narrative case studies, and other qualitative approaches. Quantitative analysis and other data-driven forms of analysis, which dominate some fields of social science and often seep into policy and political analysis, have their uses, especially when deployed with rich knowledge of historical context and local specifics. In fluid and opaque circumstances, however, it is important for researchers to embrace all effective methods. Ecumenical, descriptive case studies and contemporary narrative histories might provide the most important data available in politically stultified Arab countries, where ruling systems are spinning furiously to retain or reimpose control, where governance and quality of life have tumbled, and where popular movements and pressure groups have breached many thresholds in terms of organizing and mobilizing since the uprisings that began in 2010.
The framework and approaches that we have used over time to gauge citizens’ movements, reform, and revolutionary and pressure groups have proven insufficient. The target is murky to begin with. Scholars, analysts, and participants alike are trying to assess the prospective appeal, viability, and power of initiatives challenging autocratic states, with highly capable agencies of repression and copious resources. Public opinion is difficult to gauge. So too are the system’s weak points and the prospects for citizen engagement to cascade into effective challenges to power.
There are some useful frameworks that we use when we explore whether challenges to these autocratic systems are worth studying, whether as scholars or as policymakers who want to make sure we are looking carefully at spaces that might pose meaningful or enduring challenges to the status quo. That these challenges continue to surprise us is not only a testament to the failure of our imaginations but also to the poverty of our tools. Recent experience with the Arab uprisings, and I would suggest, with the rise of populist and right-wing leaders in the United States and Europe, suggest that we should more firmly embrace the tools of narrative, ethnography, social history, and narrow case study for their wealth of explanatory potential. No quasi-scientific tool can suffice to explain the unexpected emergence and appeal of a new movement or ideology, or sudden shifts in popular imagination that abruptly alter the boundaries of the possible. Descriptive tools can go a long way to remedy gaps in our understanding, especially if applied with an open acknowledgment of researcher bias. Analysts normatively in favor of political reform, or a certain basket of citizen rights, can openly state their preference to increase the likelihood that it won’t blind them to the conditions and qualities of the movements they study.
Finally, when we speak of change and reform in sclerotic authoritarian systems, we are often speaking about the possibility of a violent historical rupture. We ought to honestly reckon with the fear that popular, successful reformists generate in autocrats and their supporters, who have designed their systems expressly to break rather than bend when pushed. It is a form of self-defense, a built-in self-destruct switch that wires “après moi le déluge” into the system of rule. Arab citizens are well-aware that the threat is not idle, having watched Egypt’s security establishment and President Bashar al-Assad of Syria intentionally fuel violence and destruction to present any alternative to their continuing rule as toxic and untenable.
Conclusion: Further Questions
Lebanon is an important case; it is not an island. The same traits that make it a regional exception also make it relevant. It is an imperfect lab, but politics is not a pure science. Comparisons operate by analogy, and Lebanon offers a uniquely rich, and relevant, site for experimentation. Lebanon’s much-emulated experiments include the rise of Hezbollah and its entry into mainstream politics; the enduring viability of the corrupt clientilistic system of patronage politics; the endlessly effective deployment of the threat of security chaos as a bulwark against even the most minute reform; and the manipulation by a small ruling elite of sectarian identity politics as a tool to stave off all demands for accountability by constituents.
Beirut Madinati, and the groundswell of activism from which it rose, might also serve as a model—either for a new way forward for reformists, or as a cautionary tale about the perils of avoiding ideology and overt politics. Among opposition reform movements, difference and conviction need to be addressed, just as surely as issues of organization and corruption. Its founders and new members will labor onwards, perhaps successfully expanding their organization or spinning off new ones, perhaps joining preexisting groups or political parties, perhaps retreating from public life. But Lebanon’s political crisis is sure to continue. Its failures of governance and representation are part of a regional conundrum that at root is political and can only be addressed with a political solution that shifts the modes of governance and the distribution of power. Lebanon’s predicament differs from that of its Arab neighbors in degree and detail, not in kind. Its efforts to harness popular outrage and articulate a coherent identity for politically engaged reforms mark a vivid step forward in a regional struggle.
The Arab world’s experience since the most recent wave of revolts suggests that no change or reform of any sort is possible without challenging the status quo political system and administration of power. Brittle authoritarian systems around the region, including Lebanon, by design do not have feedback loops or release valves. It is nearly impossible to push for incremental change—to lobby for a new law, create different enforcement mechanisms, shift electoral processes, or change public contracting. Such shifts are the prerequisite of the actual holders of power, who are notoriously, and intentionally, opaque and unaccountable. Famously, even in relatively open systems like Lebanon’s where at least the identity of major players is known, dispute resolution barely exists and even straightforward negotiations usually devolve into stalemate, paralysis, or violence.
Lebanon’s most recent people-power success story enjoyed an initial burst of success, and despite its perhaps temporary stall over fundamental questions of political identity, it might well have an influential future. Beirut Madinati’s early record suggests a deep yearning for new, more accountable and modern civic political movements, and at the same time, a persistent struggle to overcome existing ideological divisions. Without a clear animating central idea and identity, change movements, whether reformist or revolutionary, will have difficulty challenging entrenched status quo forces.
About This Project
This policy report is part of “Arab Politics beyond the Uprisings: Experiments in an Era of Resurgent Authoritarianism,” a multi-year TCF project supported by the Carnegie Corporation of New York. Studies in this series explore attempts to build institutions and ideologies during a period of resurgent authoritarianism, and at times amidst violent conflict and state collapse. The project documents some of the spaces where change is still emerging, as well as the dynamic forces arrayed against it. The collected essays will be published by TCF Press in June 2017.
Notes
- Rami G. Khouri, “Talking Trash in Lebanon,” Al Jazeera America, Aug. 24, 2015.
- For a discussion of the different mass protests that erupted across the Arab World in 2010–11, see Fawaz A. Gerges, ed., Contentious Politics in the Middle East: Popular Resistance and Marginalized Activism Beyond the Arab Uprisings, (New York: Palgrave Macmillan, 2015).
- Erica Solomon, “Lebanon’s Political Elite to See Off Challengers,” Financial Times, May 9, 2016.
- Hassan M. Fattah, “Pro-Syria Party in Beirut Holds Huge Protest,” New York Times, March 9, 2005.
- If one counts all the refugees (mostly Palestinian and Syrian) residing in the country in addition to Lebanese citizens, the actual population is closer to six million. Population estimates for 2016 from UN Data, United Nations Statistics Division, “Lebanon Country Profile,”.
- Sami Nader, “Beirut Bombing Brings Lebanon’s Political Parties Together,” Al-Monitor, March 10, 2016.
- Sylvia Westall, “Syrian Refugees Set to Exceed a Third of Lebanon’s Population,” Reuters, July 3, 2014. Official UNHCR statistics note one million Syrian refugees in Lebanon, but that number does not reflect the actual population because the United Nations stopped registering Syrian refugees in Lebanon in early 2015. UNHCR population statistics available here.
- Nour Samaha, “Riot Police Break up Beirut Anti-Government Protests,” Al Jazeera, August 30, 2015.
- Hwaida Saad, “Clashes Break out during Protests over Trash Crisis in Lebanon,” New York Times, August 23, 2015.
- “Lebanon Rubbish Crisis: Thousands Attend Anti-Government Rally,” BBC, August 30, 2015,.
- Assad Thebian comments at “Who Stinks? Social Protests and Political Change in Lebanon,” panel discussion, Carnegie Middle East Center, November 10, 2015, Beirut, Lebanon.
- For a description of the groups that emerged along with You Stink in the summer of 2015, see “Social Movement Responding to the Lebanese Garbage Crisis,” Civil Society Knowledge Center. For details on the government garbage contract, landfills, and a timeline of the crisis, see “Waste Management Conflict (Starting January 25, 2014),” Civil Society Knowledge Center.
- David Kenner, “There’s Something Rotten in Lebanon,” Foreign Policy, August 25, 2015; and Elias Muhanna, “The Death of Ideology and Beirut’s #YouStink Protests,” Qifa Nabki, September 1, 2015. See also the response of a Lebanese activist and blogger to the Free Patriotic Movement’s bashing of YouStink’s key representative, Asaad Thebian: Elie Fares, “When the FPM Is in Full Blown Despair: Asaad Thebian Did Nothing Wrong,” August 31, 2015.
- Interviews with the author, Beirut, Lebanon, September 2015.
- Josh Wood, “Rally in Beirut Postponed Amid Fears ‘Thugs’ May Hijack the Protests,” The National, August 24, 2015.
- The unsubstantiated slur was widely circulated in Lebanese media and affected You Stink’s public standing. As an example of how widespread the accusation was, even a former cabinet minister and outspoken critic of the sectarian political system, who ran his own independent slate for municipal elections in 2016, claimed that the activists in You Stink were paid, although when asked he could offer no evidence. Charbel Nahhas, interview with the author, Beirut, Lebanon, July 20, 2016.
- Assad Thebian, interview with the author, Beirut, Lebanon, February 24, 2016.
- Protesters attracted ire when they carried a banner including multiple photographs of politicians including Hezbollah leader Hassan Nasrallah, and in the slogan, “All of them means all of them,” a reference to the entire corrupt political class. But in its statements and actions, You Stink sought to target officials responsible for the garbage crisis over waste collection issues alone, in order to maintain a focused campaign. See Samia Nakhoul, “Lebanon’s Rubbish Crisis Exposes Political Rot,” Reuters, September 7, 2015.
- For a mention of policy proposals by environmentalists to end the garbage crisis by environmentalists, see “Social Movement Responding to the Lebanese Garbage Crisis,” Civil Society Knowledge Center; and “Interview with Paul Abi Rached: A Glimmer of Hope in Lebanon’s Garbage Crisis,” Tara Expeditions Foundation, 2016.
- Thebian, interview with the author.
- Ziad Abu-Rish, “Garbage Politics,” Middle East Research and Information Project 45, no. 277 (2015).
- Mona Fawaz, interview with the author, Beirut, Lebanon, July 22, 2016.
- “The Program,” Beirut Madinati.
- Fawaz, interview, July 22, 2016.
- Beirut Madinati set up an app to process and track volunteers. As a primary means of communicating with supporters and prospective voters, it relied on postings distributed on overlapping platforms: the personal WhatsApp networks of members, the official website, a Facebook page updated daily, and a Twitter feed.
- Jad Chaaban, interview with the author, Beirut, Lebanon, February 29, 2016.
- “The Text of the Press Conference After the Second Phase of the Municipal Elections,” Lebanese Association of Democratic Elections, May 10, 2010.
- Yassmine Alieh, “$240 Million Budget at the Municipality of Beirut,” Lebanon Opportunities, January 26, 2017.
- Aurélie Daher, “Saudi Arabia Is Pissed: What Are the Risks for Lebanon?” LobeLog, March 11, 2016; Tom Perry, “Cash Crunch at Saudi Firm Casts Shadow over Lebanon’s Hariris,” Reuters, September 5, 2016; and Yakir Gillis, “Why Lebanon’s Power Struggle Is Fueled by a Loss of Saudi Support,” Newsweek, October 3, 2016.
- Chaaban, interview with the author by telephone, Beirut, Lebanon, June 9, 2016.
- For more on youth-led leaderless movements in the Arab world since the uprisings and their organizational challenges, see Vincent Durac, “Social Movements, Protest Movements, and Cross-Ideological Coalitions—the Arab Uprisings Re-Appraised,” Democratization 22, no. 2 (2015): 239–58.
- Beirut Madinati was heavily covered by national, regional, and international media outlets. For Beirut Madinati candidates hosted on political TV programs, see “Kalam Ennas Report: The Cost of Garbage,” LBCI Lebanon, September 8, 2016; “Nharkom Said, Keeping up with the Municipal Wlections in Beirut,” LBCI Lebanon, May 6, 2016, ; “Beirut’s Municipal Elections of 2016,” Al Jadeed Online, May 2, 2016; “Bi Mawdouiyeh: The Municipal Elections,” MTV Lebanon News, May 4, 2016; “Rana Khoury on Al Arabiya Speaks about Beirut Madinati Municipal List,” Al Arabiya, May 3, 2016. For Beirut Madinati coverage on national news channels, see “Beirut Madinati continues its Tour of Beirut’s Neighborhoods” (Arabic), LBC Group, Lebanon, April 23, 2016; “Beirut Madinati Pledges to Defend Each and Every Beiruti” (Arabic), LBC Group, Lebanon, April 22 2016; “In Beirut Vote, Old Parties Face New Challenges,” MTV Lebanon, Lebanon, May 5, 2016. For coverage in national, regional and international newspapers, see Karim El Mufti, “Beirut Madinati: Change at the Tip of Your Vote,” Executive Magazine, May 3, 2016; “Au Liban, des Élections Municipales Test Pour la Société Civile,” France24, May 9, 2016; Verina Al Amil, “Beirut Madinati: Discussions and Art and Sports Activities, Optimistic to the Highest Limits” (Arabic), An-Nahar, April 28, 2016; “Beirut Madinati: Citizens Adopt Campaign that Challenges Political Class in Municipal Elections” (Arabic), Huffington Post Arabic, May 5, 2015; Muhanad Al Hajj Ali, “Beirut Madinati: The Beginning of the Line” (Arabic), AlModon, May 6, 2016; Eva Al Shoufi, “Beirut Madinati: Not ‘We Are The People’” (Arabic), Al-Akhbar, May 9, 2016.
- Saad Hariri, “Speech on Ramadan Iftaar,” June 9, 2016.
- Ibrahim Mneimneh, interview with the author, Beirut, Lebanon, May 8, 2016.
- Thanassis Cambanis, “Beirut Upstarts Gain Traction in Lebanon’s Political Quagmire,” New York Times, May 10, 2016.
- For a discussion of the results by area and a rich technical analysis, see Ramez Dagher, “What Beirut’s Election Results Tell: Lebanon Can Hope for Change,” Moulahazat, May 11, 2016. Full results by district from the Lebanon’s Ministry of the Interior in Arabic are available online.
- Lebanon Ministry of the Interior, official election results (Arabic).
- The candidate list and biographies are available on Beirut Madinati’s website.
- Interviews with the author, Beirut Madinati Discussion Square at Ghassan Tueni Park, Beirut, Lebanon, September 8, 2016.
- Chaaban, interview with the author by telephone, Beirut, Lebanon, June 9, 2016.
- Fawaz, interview with Sima Ghaddar, Beirut, Lebanon, June 9, 2016.
- Mona El Hallak, interview with the author, Beirut, Lebanon, July 27, 2016.
- Mona Fawaz, interview with the author by telephone, Cambridge, Mass., November, 19, 2016.
- Mneimneh, interview with the author by telephone, Beirut, Lebanon, November 17, 2016.
- Sally Haydan, “Barricades on the Beach: Beirut’s Residents Fight for Their Waterfront,” Reuters, December 2, 2016.
- In a campaign post-mortem on his personal blog, Chaaban credited Beirut Madinati with restoring democracy and political discourse in Lebanon. Jad Chaaban, “On Beirut Madinati, Some Preliminary Thoughts and Reflections,” Development in a Polarized Society, June 7, 2016.
- Kim Ghattas, “Beirut’s Lovable Losers,” Foreign Policy, May 26, 2016.
- Joey Ayoub, Facebook post, May 9, 2016.
- Scott Preston, “Can Coalition of Reformers Snag Lebanese Parliament Seats?” Al-Monitor, November 15, 2016.
- Nazih Osseiran, “Kataeb Resign from Cabinet over ‘Deal’ Grievances,” The Daily Star, June 15, 2016; and Ramez Dagher, “Did Ashraf Rifi’s Resignation Inspire the Kataeb?” Moulahazat, June 19, 2016.
- Jad Chaaban, Diala Haidar, Ryaan Ismail, Rana Khoury, and Mirna Shidrawi, “Beirut’s 2016 Municipal Elections: Did Beirut Madinati Permanently Change Lebanon’s Electoral Scene?,” Case Analysis, Arab Center for Research and Policy Studies, Doha, Qatar, September 2016.
- Jad Chaaban, Diala Haidar, Ryaan Ismail, Rana Khoury, and Mirna Shidrawi, “Beirut’s 2016 Municipal Elections: Did Beirut Madinati Permanently Change Lebanon’s Electoral Scene?” Case Analysis, Arab Center for Research and Policy Studies, Doha, Qatar, September 2016, p. 14.
- Thanassis Cambanis, “The Urban Mechanics of Beirut,” The Boston Globe, June 19, 2016.
- For more on the concept of the hollow core structure in elite networks, see Edward O. Laumann et al., “Inner Circles or Hollow Cores? Elite Networks in National Policy Systems,” Journal of Politics 52, no. 2 (1990): 356–90.
- “Interview with Beirut Madinati Candidate, Rana Khoury,” So Beirut, undated, https://www.sobeirut.com/features/59/meet-beirut-madinati. Emphasis in the original. After the campaign, Khoury expanded her ideas about political messaging. See Rana Khoury, “On positive political rhetoric and creating a space for love,” TEDxLAU, November 16, 2016.
- In the elections, Nahhas won 6,920 votes.
- Nahhas, interview with the author.
- Deen Sharp, “Beirut Madinati: Another Future Is Possible,” September 27, 2016, Middle East Institute.
- These revolutionary fissures have been dissected at length elsewhere, and are the focus of my narrative study of the activist struggle in Egypt from 2011 to 2013. See Thanassis Cambanis, Once Upon a Revolution: An Egyptian Story (New York: Simon & Schuster, 2015).
- Stephen Deets and Jennifer Skulte-Ouaiss, “Jumping Out of the ‘Hobbesian Fishbowl’ and into The Fire: Lebanon, Elections, and Chronic Crisis,” Demokratizatsiya: The Journal of Post-Soviet Democratization 24, no. 4 (2016): 530.
- Ibid., 518.