Over the past year, scenes of civil unrest have played out in the deteriorating inner-ring suburb of Ferguson and the traditional urban ghetto of inner-city Baltimore. The proximate cause of these conflicts has been brutal interactions between police and unarmed black men, leading to protests that include violent confrontations with police, but no single incident can explain the full extent of the protesters’ rage and frustration. The riots and protests—which have occurred in racially-segregated, high-poverty neighborhoods, bringing back images of the “long, hot summers” of the 1960s—have sparked a national conversation about race, violence, and policing that is long overdue.
Something important, however, is being left out of this conversation: namely, that we are witnessing a nationwide return of concentrated poverty that is racial in nature, and that this expansion and continued existence of high-poverty ghettos and barrios is no accident. These neighborhoods are not the value-free outcome of the impartial workings of the housing market. Rather, in large measure, they are the inevitable and predictable consequences of deliberate policy choices.
To address the root causes of urban violence, police-community tensions, and the enduring legacy of racism, the genesis of urban slums and the forces that sustain them must be understood. As a first step in that direction, this report examines the trends in the population and characteristics of neighborhoods of extreme deprivation. Some of the key findings include:
- There was a dramatic increase in the number of high-poverty neighborhoods.
- The number of people living in high-poverty ghettos, barrios, and slums has nearly doubled since 2000, rising from 7.2 million to 13.8 million.
- These increases were well under way before the Great Recession began.
- Poverty became more concentrated—more than one in four of the black poor and nearly one in six of the Hispanic poor lives in a neighborhood of extreme poverty, compared to one in thirteen of the white poor.
- To make matters worse, poor children are more likely to reside in high-poverty neighborhoods than poor adults.
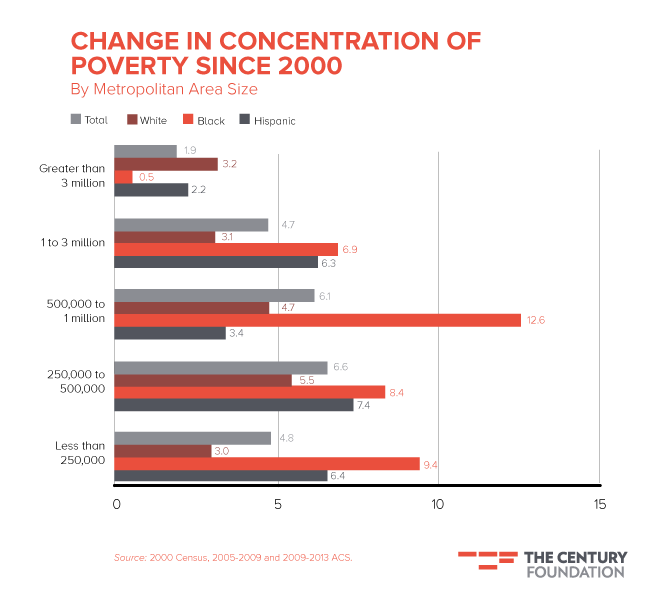
- The fastest growth in black concentration of poverty (12.6 percentage points) since 2000 was not in the largest cities, but in metropolitan areas with 500,000 to 1 million persons.
This report discusses these trends in the context of the policy choices that helped to construct this architecture of segregation, and makes suggestions on how it can be overcome.
The Return of High-Poverty Neighborhoods
High-poverty ghettos and barrios, after being a major concern in the 1960s, 1970s, and 1980s, receded from the public consciousness. In the 1990s, economic trends and public policies aided the poor. The Earned Income Tax Credit reduced taxes for low-income Americans. The minimum wage was increased and unemployment dropped to 4 percent for a sustained period, leading to real wage increases. In this context, the number of persons living in high-poverty neighborhoods—defined as census tracts where the federal poverty rate was 40 percent or more—dropped by 25 percent, from 9.6 million to 7.2 million.1
Since 2000, however, that progress has been squandered as there has been a rapid re-concentration of poverty. While the initial phases of this trend have been previously reported,2 the full extent of this development has been obscured because the available data from the American Community Survey (ACS) spanned pre- and post-recession years. The latest neighborhood-level data, however, allows us to see the full effect of the financial panic and the ensuing Great Recession on the concentration of poverty. (See Appendix A and B for an explanation of the methodology, definitions, and data used in this report.)
Number and Population of High-Poverty Neighborhoods
After the dramatic decline in concentrated poverty between 1990 and 2000,3 there was a sense that cities were “back,” and that the era of urban decay—marked by riots, violent crime, and abandonment—was drawing to a close.4 Unfortunately, despite the relative lack of public notice or awareness, poverty has re-concentrated.
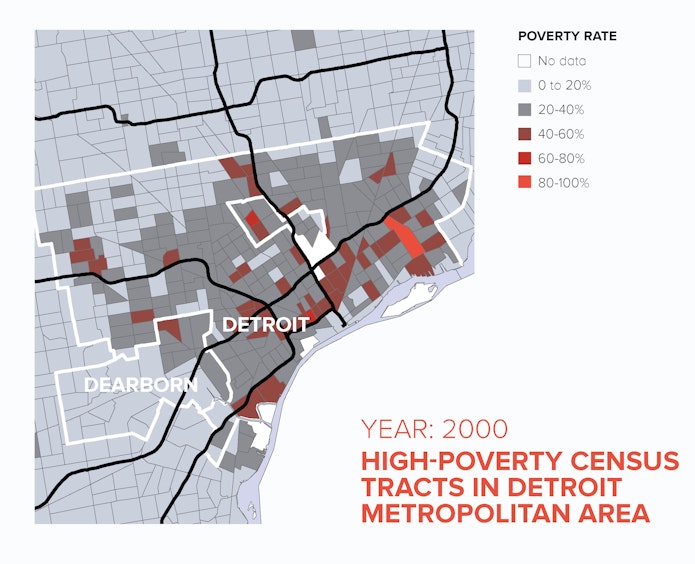
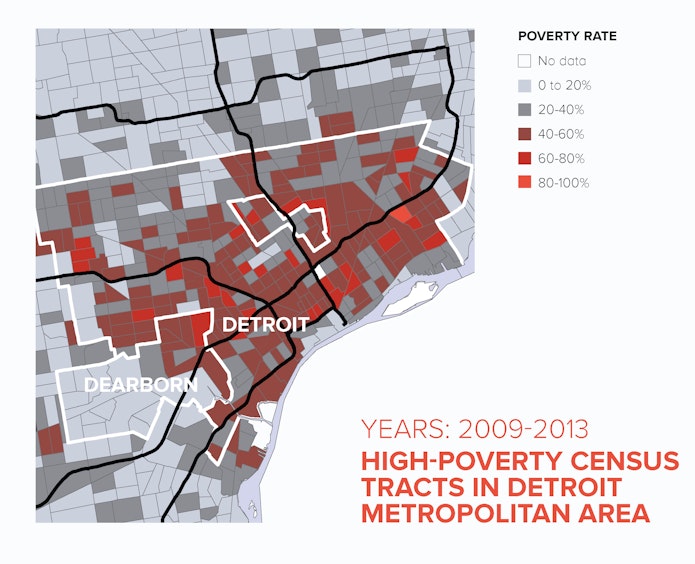
In Detroit, for example, the number of high-poverty census tracts more than tripled, from 51 to 184 (see Figure 1).5 The contrast between 2000 and 2009–13 could not be more dramatic, as a huge swath of neighborhoods transform to high-poverty tracts. Further, in contrast to 2000, when high-poverty and borderline tracts were found within the confines of the Detroit city limits, in 2009–13, they spill out from the central city into adjacent inner-ring suburbs. In other words, the footprint of concentrated poverty has grown, and the suburbs, or at least the inner-ring of older suburbs, are no longer immune to its effects.
Figure 1 Compare neighborhood poverty rates in the Detroit metropolitan area from 2000 to 2009-2013.
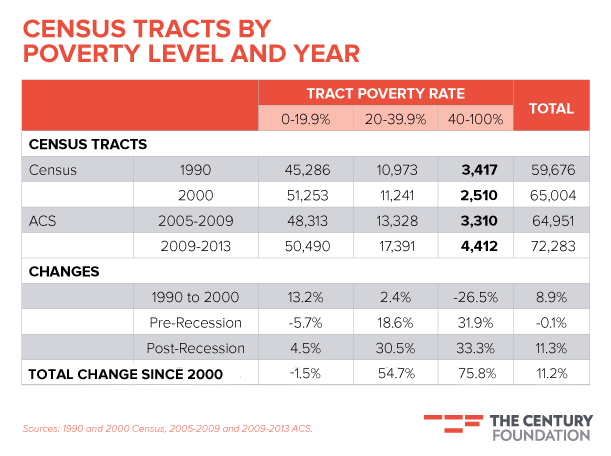
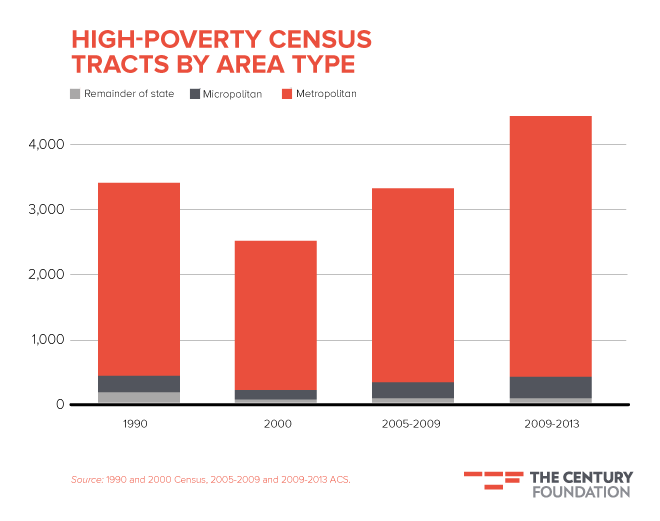
Detroit may be an extreme case, but it is still indicative of a larger trend. Nationwide, the number of high-poverty neighborhoods and the population living in them has risen at an alarming pace. After declining by more than one-fourth, from 3,417 to 2,510 between 1990 and 2000, the number of high-poverty census tracts has risen steadily (see Table 1). In the 2005–09 ACS data, before the financial crisis took hold, high-poverty census tracts increased by nearly one-third, to 3,310—nearly matching the 1990 figure. By 2009–13, an additional 1,100 tracts had poverty rates of 40 percent or more, bringing the total to 4,412.6The overall increase in high-poverty census tracts since 2000 was 76 percent. It is notable that the number of “borderline” neighborhoods (those with poverty rates in the range of 20 to 40 percent) also increased, both before and especially after the financial crisis.
Table 1
As shown in Figure 2, the vast majority of these census tracts (3,971, or 90 percent) are located in the nation’s metropolitan areas—typically including one or more central cities of 50,000 or more persons and their associated suburbs. A small but growing number (335, or 7.6 percent) of these neighborhoods are located in what the Census Bureau calls “micropolitan areas,” defined as a core city of 10,000 to 50,000 combined with nearby towns and suburbs.7 A small number may be found outside of either metro- or micropolitan areas in rural areas and small towns. While there is clearly poverty in small towns and rural areas, it is uncommon to find neighborhoods (census tracts) in those places that match the high-level of poverty found in metropolitan ghettos and barrios.
Figure 2
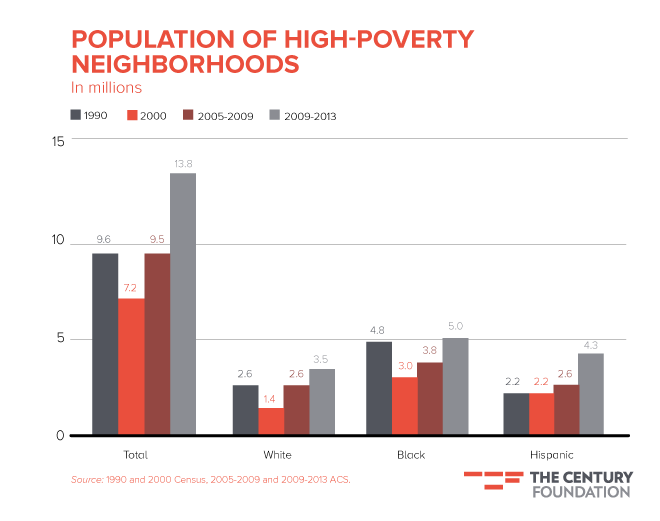
The total population of these high-poverty neighborhoods has also grown. As shown in Figure 3, since the 2000 low, the number of persons living in neighborhoods where the poverty rate is 40 percent or more has grown by 91 percent. The Great Recession, however, is not solely responsible for this increase. Even before the financial crisis and the subsequent recession, the population of these areas had returned to almost the 1990 level, increasing 32 percent, to 9.5 million. The population of high-poverty neighborhoods increased by another 4.3 million, to 13.8 million—the highest number of high-poverty neighborhood residents ever recorded.
Figure 3
The figure also reveals that, since 2000, the number of people living in these neighborhoods has been increasing for the major racial and ethnic subgroups, including non-Hispanic whites, blacks, and Hispanics.8 In fact, the growth is fastest for non-Hispanic whites, rising 145 percent, from 1.4 million in 2000 to 3.5 million in the most recent data. Nevertheless, the minority residents of high-poverty areas are still more numerous than non-Hispanic whites. Blacks and Hispanics in high-poverty ghettos and barrios increased from 3.0 to 5.0 million and 2.2 to 4.3 million, respectively.
Concentration of Poverty
While the number and population of high-poverty neighborhoods have grown, most poor people—regardless of racial or ethnic group—do not live in high-poverty neighborhoods. Those who do have to shoulder the “double disadvantage” of having poverty-level family income while living in a neighborhood dominated by poor families and the social problems that follow.9
The size of this problem can be measured by examining the concentration of poverty, defined as the percentage of an area’s poor residents living in high-poverty zones. While the concentration of poverty is typically correlated with poverty overall, it need not be so. For example, during an economic downturn, people who live outside typical poverty areas may lose jobs and become poor, which could actually decrease the percentage of the poor living in high-poverty areas. The concentration of poverty is really about the spatial organization of poverty, and is conceptually distinct from poverty measured at the individual or family level.
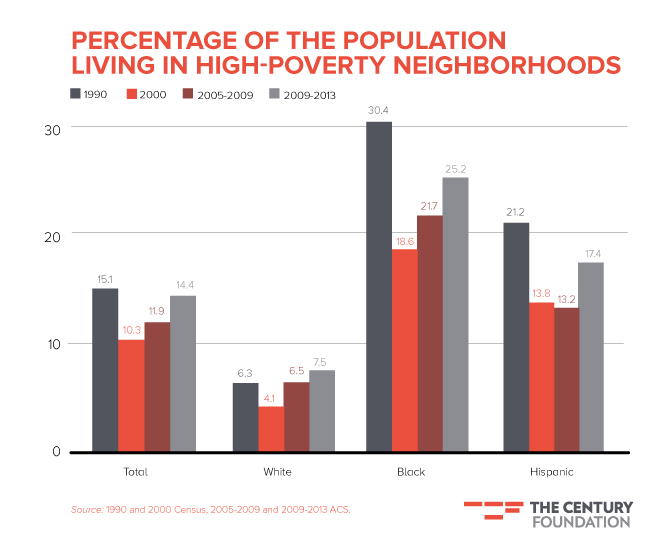
Figure 4
After the sharp decline in the concentration of poverty in the 1990s, it started rising again in the early 2000s, before the Great Recession. Nationwide, 10.3 percent of the poor were concentrated in high-poverty neighborhoods in 2000, but that figure increased to 11.9 percent and 14.4 percent in the pre-and post-recession periods, respectively, as shown in Figure 4. Concentration of poverty is highest for blacks, with one-fourth of the black poor residing in high-poverty tracts, although that level is still less than in 1990. Poverty concentration also increased among Hispanics, but only since the recession began. Non-Hispanic white poor, despite more than doubling in number, are still least likely to live in high-poverty areas. Indeed, a black poor person is more than three times as likely and a Hispanic poor person is more than twice as likely to reside in a neighborhood with a poverty rate of 40 percent or more than a white poor person.
Regional Variation
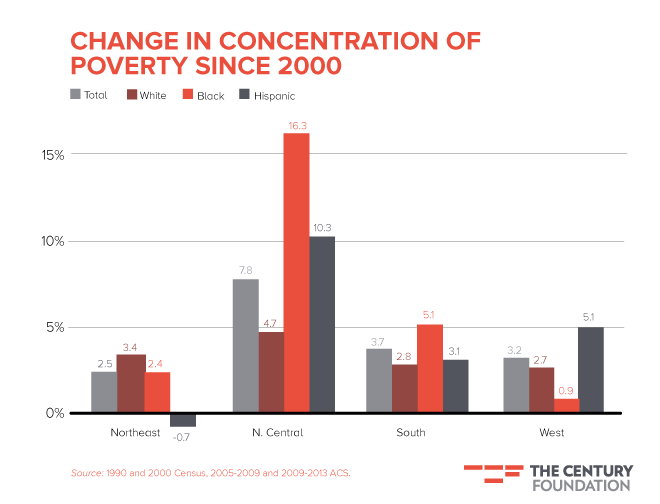
The increase in concentration of poverty was not limited to one region, although the Midwest was particularly hard hit. Figure 5 shows the percentage point change in concentration of poverty since 2000 by race/ethnicity and region. The Northeast had the smallest overall increases, followed by the West and South. The Midwest (“North Central” in Census Bureau parlance) had the largest increases, both overall and for non-Hispanic whites, blacks, and Hispanics.
Figure 5
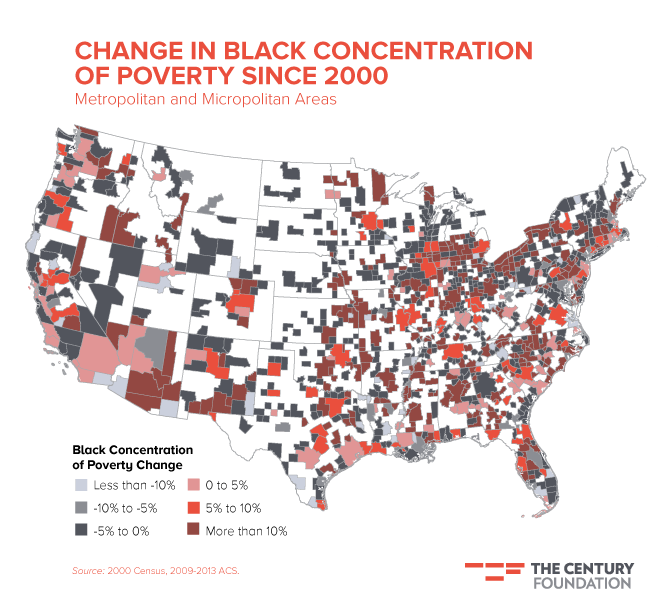
Figure 6 maps the changes in black concentration of poverty since 2000 in nearly one thousand U.S. metropolitan and micropolitan areas. The dark red shading indicates an increase of ten percentage points or more in black concentration of poverty, while the light gray shading indicates decreases of ten percentage points or more. While every region contains a mixture of increases and decreases, large increases in black concentration of poverty dominate the map, particularly in the Midwest region.
Figure 6
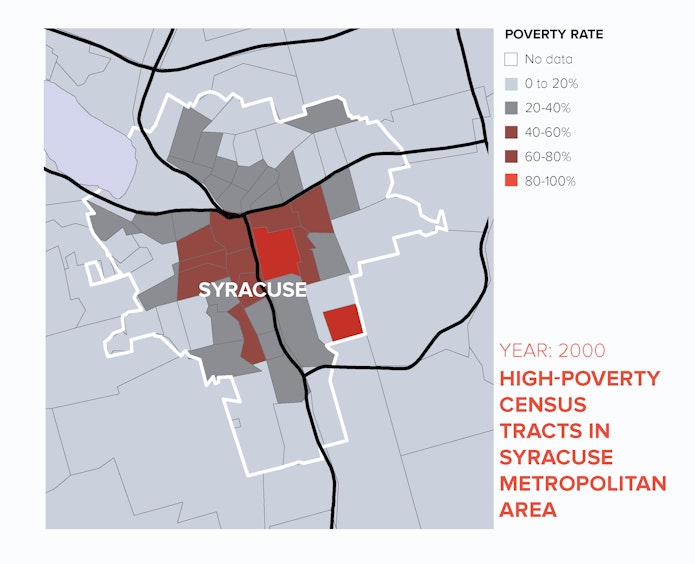
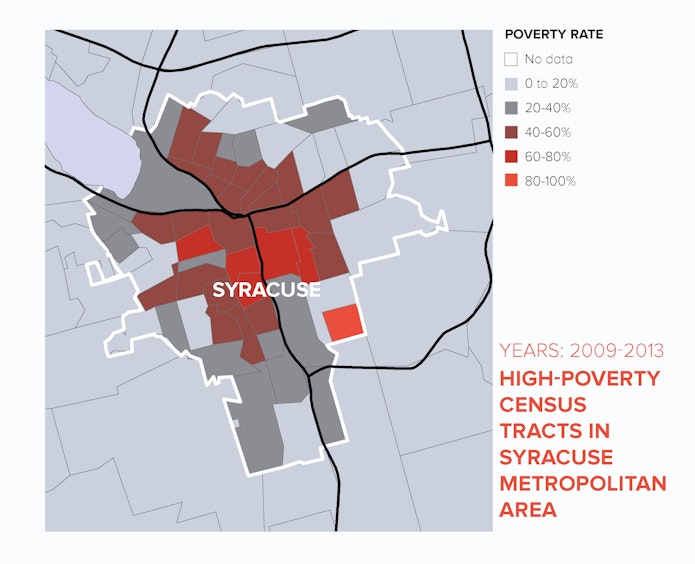
While concentration of poverty is often associated with the nation’s largest metropolitan areas, the phenomenon grew fastest in small to mid-size metropolitan areas, as shown in Figure 7. Since 2000, concentration of poverty in the thirteen metropolitan areas with more than 3 million persons grew by less than two percentage points overall and by only half a percentage point among blacks. Whereas concentration of poverty used to be a big city problem, the fastest growth in black concentration of poverty (12.6 percentage points) since 2000 was in metropolitan areas with 500,000 to 1 million persons—places like Syracuse, New York; Dayton, Ohio; Gary, Indiana; and Wilmington, Delaware. In Syracuse, for example, the number of high-poverty tracts more than doubled, rising from twelve to thirty, as shown in Figure 8. As a result, Syracuse now has the highest level of poverty concentration among blacks and Hispanics of the one hundred largest metropolitan areas.
Figure 7
Figure 8 Compare neighborhood poverty rates in the Syracuse metropolitan area from 2000 to 2009-2013.
The fastest rate of growth in concentrated poverty for whites (5.5 percentage points) and for Hispanics (7.4 percentage points) was in even smaller metropolitan areas: those with 250,000 to 500,000 person, such as Flint, Michigan; Lubbock, Texas; and Reading, Pennsylvania.
Highly Concentrated Metropolitan Areas
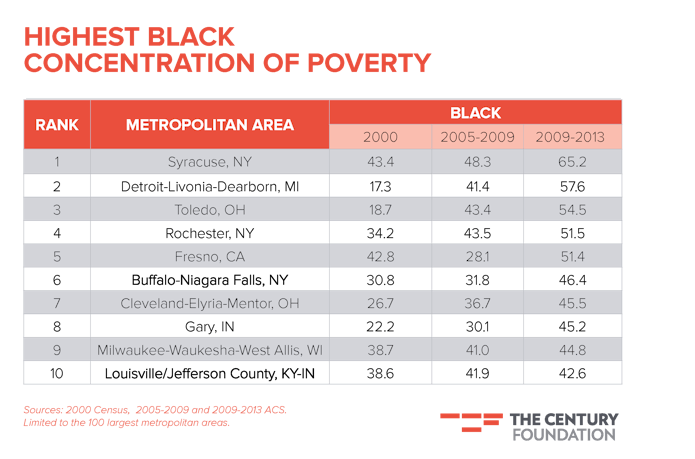
The specific metropolitan areas with the highest concentration of poverty varies by racial/ethnic group. Starting with the African-American poor, the most concentrated metropolitan area is the aforementioned Syracuse, where nearly two-thirds of the black poor lived in high-poverty neighborhoods in the most recent data. Detroit, which had a marked decline in black concentration of poverty between 1990 and 2000, saw an increase of nearly forty percentage points, with more than half of that increase occurring before the financial crisis, rising from 17.3 percent in 2000 to 41.4 percent in the ACS 2005–09 data. It rose further to 57.6 percent in the post-recession data. The top ten list is dominated by Northeast and Midwest mid-sized metropolitan areas (See table 2). Indeed, none of the thirty largest metropolitan areas makes this list; Cleveland, ranked thirty-second with a population of just over 2 million, is the largest. All ten of these metropolitan areas had an increase in black concentration of poverty since 2000, as did three-fourths of the one hundred largest metros. With one exception (Fresno, California), the increase in concentration of poverty began prior to the advent of the Great Recession.
Table 2
Not all metropolitan areas had increases in black concentration of poverty. Notable declines in concentration of black poverty since the 2000 Census include those in the media centers of New York (–5.6 percentage points), Los Angeles (–2.5), and Atlanta (–3.1), as well as Washington, D.C. (–1.1). Given the contrary trend in these “nerve center” metropolitan areas, it is perhaps not surprising the historic re-concentration of poverty since 2000 has largely escaped public attention—at least until the recent racial conflicts and civil unrest resurfaced urban poverty as a major policy concern.10
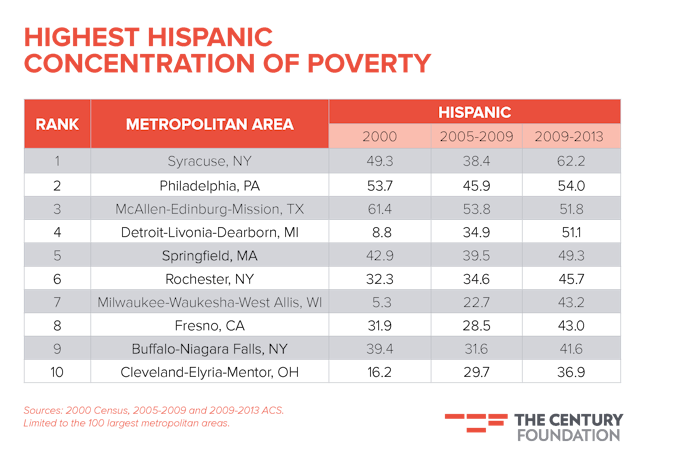
The list of ten metropolitan areas with the highest concentration of Hispanic poverty, shown in Table 3, includes seven of the same areas in the previous list: Syracuse, Detroit, Rochester, Milwaukee, Fresno, Buffalo, and Cleveland. The pattern is less consistent, but seven of these ten metropolitan areas experienced substantial increases in Hispanic concentration of poverty since 2000. Philadelphia’s Hispanic concentration has been consistently high, and McAllen, Texas, actually saw a decline.
Table 3
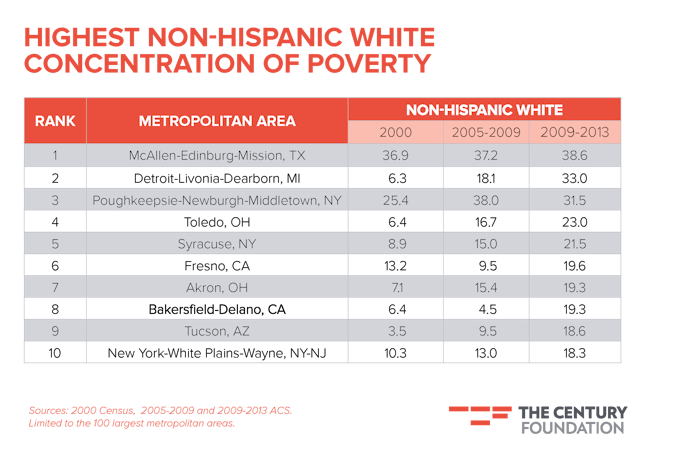
Concentration of non-Hispanic white poverty, in contrast, is highest in a somewhat different list of metropolitan areas as shown in Table 4. Detroit, again, and McAllen stand out with more than one-third of their white poor living in high-poverty areas. Detroit, Fresno, and Syracuse are the only metropolitan areas on all three lists, but the concentration of white poverty is much lower in Fresno than in Detroit or Syracuse. Smaller metropolitan areas with fewer than 1 million persons dominate the list, but ironically New York, the largest, is also included.
Table 4
Children and Concentration of Poverty
One of the primary concerns about high-poverty neighborhoods is the potential impact on child and adolescent development.11 Indeed, William Julius Wilson stressed the lack of positive role models within the social milieu of urban ghettos.12 High-poverty neighborhoods produce high-poverty schools, and both the school and neighborhood contexts affect student achievement.13
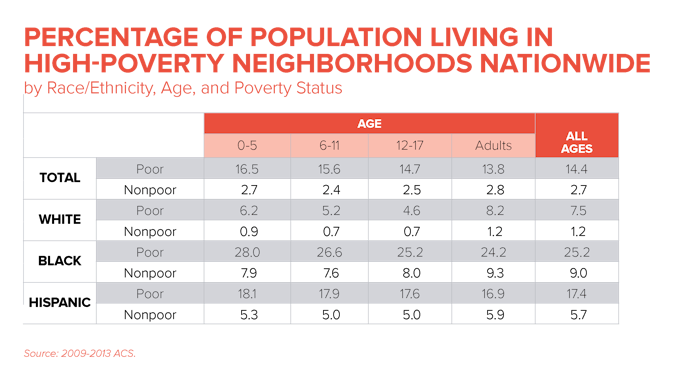
Unfortunately, poor children are more likely to live in high-poverty neighborhoods than poor adults. Table 5 shows the percentage of persons living in high-poverty neighborhoods nationwide by race/ethnicity, poverty status, and age. The gap is largest for poor children under 6 years of age, by 16.5 percent compared to 13.8 percent for poor adults. The gap in high-poverty neighborhood residence is even larger for the black poor, with 28 percent of black poor children less than 6 years old residing in concentrated poverty compared to 24.2 percent of black poor adults. For Hispanics, the comparable figures are 18.1 percent and 16.9 percent. Whites, however, show the opposite pattern, with white poor children less likely to live in high-poverty neighborhoods than white poor adults.
Table 5
Not surprisingly, non-poor persons are far less likely to live in areas of poverty concentration than poor persons regardless of age. In contrast to poor children, non-poor children are less often found in high-poverty areas than non-poor adults, regardless of racial/ethnic group. A cause for concern, however, is that non-poor blacks are more likely to reside in a high-poverty zone than poor whites of any comparable age. For example, 7.9 percent of non-poor black children less than 6 years old live in a high-poverty census tract compared to 6.2 percent of poor white children in that age group.
Immigration and Concentration of Poverty
Many inner-city neighborhoods with varying degrees of poverty have become destinations for immigrants, legal and illegal alike, seeking affordable housing and access to transportation networks that are found in the urban cores. It is a fair question to ask whether immigration is responsible, in whole or in part, for the surge in concentrated poverty since 2000.
A close examination of the census tract data from the ACS yields a definitive, if somewhat counterintuitive answer. First, there was a large increase in the number of immigrants in high-poverty neighborhoods—90 percent—but this was about the same as the overall increase. As a result, foreign born as a percent of the total population of high-poverty areas was unchanged at about 17 percent. Concentration of poverty among the foreign-born poor is virtually identical to the concentration for the native-born poor, 14.5 percent compared to 14.4 percent. Thus, immigrants contributed to the increase in the population of high-poverty areas, but not disproportionately relative to the native born.
However, foreign-born persons are certainly poorer on average than native-born persons—18.7 percent versus 14.9 percent. From this, one might be tempted to conclude that the increasing presence of foreign-born persons increases census-tract poverty levels and therefore that their presence might increase the number of high-poverty neighborhoods. In fact, the opposite is true. While the foreign born are poorer on average than the native-born, they do not sort themselves out along economic lines nearly as thoroughly as the native born. Immigrants cluster more on linguistic and cultural affinities, and less on individual, family, or household income. As a result, their presence in neighborhoods cuts against the grain of native-born spatial inequality,14increasing the poverty rate in better-off neighborhoods, but decreasing the poverty rate in neighborhoods with a high level of poverty among the native born.
Removing immigrants from the cross-sectional poverty distribution would actually increase the number of high-poverty neighborhoods from 4,412 to 4,656. The number of native-born persons residing in high-poverty neighborhoods would then rise about 5 percent, from 11.4 million to 12.0 million. Thus, the presence of immigrants actually has a moderating effect on the concentration of poverty.
Public Policy and the Concentration of Poverty
Recent economic troubles have clearly contributed to the sharp re-concentration of poverty since 2000. But another huge factor, in good economic times and bad, has been rampant suburban and exurban development. Suburbs have grown so fast that their growth was cannibalistic: it came at the expense of the central city and older suburbs.15 In virtually all metropolitan areas, suburban rings grew much faster than was needed to accommodate metropolitan population growth, so that the central cities and inner-ring suburbs saw massive population declines. The recent trend toward gentrification is barely a ripple compared to the massive surge to the suburbs since about 1970. Moreover, taxpayers funded all the new infrastructure needed to facilitate suburban expansion—roads, schools, water and sewer, and so on—even as existing infrastructure was abandoned and underutilized in the urban core.16
The population movements were also highly selective. Through exclusionary zoning and outright housing market discrimination, the upper-middle class and affluent could move to the suburbs, and the poor were left behind.17 Public and assisted housing units were often constructed in ways that reinforced existing spatial disparities.18 Now, with gentrification driving up property values, rents, and taxes in many urban cores, some of the poor are moving out of central cities into decaying inner-ring suburbs.
Ferguson is a prime example of how concentration of poverty is moving from the inner-city to the suburbs. As recently as 1990, Ferguson was 75 percent white, but by 2010 it was about two-thirds black. The poverty rate shot up from 7 percent to 22 percent over that period. Three out of ten neighborhoods in Ferguson now have poverty rates of more than 40 percent.19
It is unfortunate that well-meaning people who are reading the news and consuming the coverage of the events in Ferguson, Baltimore, and elsewhere are not getting the full picture. They are seeing places like Ferguson up close, but they are not seeing the larger set of forces that created Ferguson. Consider the fact that almost all of the high-poverty neighborhoods in the St. Louis metropolitan area are in the City of St. Louis, East St. Louis, and a handful of inner-ring suburbs such as Ferguson. Meanwhile, there are five hundred more suburbs that are part of the St. Louis metropolitan area that have exactly zero high-poverty neighborhoods. These richer suburbs have used exclusionary zoning to keep out affordable housing, so the poor and low-income people can only live in the central city and dying suburbs that are being abandoned as wealthier people move further and further out to the fringes for larger houses, bigger bathrooms, and walk-in closets.20The whole process is legally enforced through zoning, and underwritten by the mortgage interest deduction and all the subsidies that go into building roads, sewers, and schools for the new suburbs.
Given that the housing stock lasts for decades, these policies build a durable architecture of segregation that ensures that racial segregation and the concentration of poverty is entrenched for years to come.
Nick Kristof, in a recent New York Times column, quoted Joe Stiglitz’s conclusion that “Inequality is a choice.”21 Concentration of poverty is also a choice, whether we want to admit it or not. Concentration of poverty is the product of larger structural forces, political decisions, and institutional arrangements that are too often taken for granted. Our governance and development practices ensure that significant segments of our population live in neighborhoods where there is no work, where there are underperforming schools, and where there is little access to opportunity.
The police in these areas are then asked to patrol the tense boundary between poverty zones and “decent” neighborhoods. There is no excuse for police brutality, nor for over-zealous policing of poor, minority communities. But it is all too easy for those of us in the safety and security of gentrified neighborhoods and wealthy suburban enclaves to condemn police excesses without acknowledging our own complicity in creating the situation.
No matter how we got here, we have to deal with the situation as it now exists. The problems of urban policing certainly must be addressed. But also, to ameliorate the tensions, we have to try to stabilize low-income areas, improve inner-city schools, and expand economic opportunities for those currently living in disadvantaged neighborhoods. And perhaps more importantly, we have to find a way to stop creating so many high-poverty neighborhoods in the first place. We must work to change the development paradigm that creates high-poverty neighborhoods.
Our highly dispersed and profoundly unequal distribution of housing is not inevitable; indeed, it is not the norm around the world. The two main changes that need to occur are simple to state, but hard to bring about. First, the federal and state governments must begin to control suburban development so that it is not cannibalistic: new housing construction must be roughly in line with metropolitan population growth.
Second, every city and town in a metropolitan area should be required to ensure that the new housing built reflects the income distribution of the metropolitan area as a whole. To some, this suggestion may seem like a massive intervention in the housing market. In fact, exclusionary zoning is already a massive intervention in the housing market that impedes a more equitable distribution of affordable housing.
Over decades, these two changes would result in less differentiation among places, more in-fill development, higher density, more efficient public transportation, and fewer failing schools. If we are serious about breaking down spatial inequality, we have to overcome our political gridlock and chart a new course toward a more geographically inclusive society.
In this context, it is encouraging that the Supreme Court has ruled in favor of the use of “disparate impact” claims in fair housing litigation and that HUD has issued new rules requiring local government and agencies to “affirmatively further fair housing.”22 These developments suggest the possibility of renewed national action to address segregation and the concentration of poverty. Perhaps, given these positive developments, we can finally find a way to stop building the architecture of segregation.
Download Report as a PDF
Download Appendices A and B
This work was support by The Century Foundation and the School of Arts and Sciences at Rutgers University–Camden. The author received helpful comments and suggestions from Marie Chevrier, Natasha Fletcher, Straso Jovanovich, Lucy Muirhead, Jason Renker, Christopher Wheeler,and Zachary David Wood and production support from Abigail Grimshaw.
Cover Photo Credit: Flickr, Barbara Eckstein, http://bit.ly/1DvM0oU
Notes
- Paul A. Jargowsky, “Stunning Progress, Hidden Problems: The Dramatic Decline of Concentrated Poverty in the 1990s,”
Living Cities Census Series (Washington D.C.: Brookings Center on Urban and Metropolitan Policy, May 2003). - Alemayehu Bishaw, “Areas with Concentrated Poverty: 2006-2010,” American Community Survey Reports (Washington, D.C.: U.S. Census Bureau, December 2011); Paul A. Jargowsky, Concentration of Poverty in the New Millennium: Changes in the Prevalence, Composition, and Location of High-Poverty Neighborhoods, A Report of the Century Foundation and the Rutgers Center for Urban Research and Education (New York, NY: Century Foundation, 2013); Paul A. Jargowsky, “Concentration of Poverty: An Update,” The Century Foundation: Blog of the Century, April 9, 2014, http://tcf.org/blog/detail/concentration-of-poverty-an-update; Elizabeth Kneebone, Carey Nadeau, and Alan Berube, The Re-Emergence of Concentrated Poverty: Metropolitan Trends in the 2000s (Metropolitan Policy Program at Brookings, 2011).
- Jargowsky, “Stunning Progress, Hidden Problems: The Dramatic Decline of Concentrated Poverty in the 1990s”; G. Thomas Kingsley and Kathryn L. S. Pettit, “Concentrated Poverty: A Change in Course,” Neighborhood Change in Urban America Brief (Washington, D.C.: The Urban Institute, 2003).
- Roberta Brandes Gratz and Norman Mintz, Cities Back from the Edge: New Life for Downtown (John Wiley & Sons, 2000); Paul S. Grogan and Tony Proscio, Comeback Cities: A Blueprint for Urban Neighborhood Revival (Basic Books, 2000).
- This neighborhood map, and the ones that follow below, are based on the 2000 census tract grid. The ACS data for 2009-2013 are interpolated to that grid using tools developed by Brian Stults John R. Logan, Zengwang Xu, and Brian J. Stults, “Interpolating U.S. Decennial Census Tract Data from as Early as 1970 to 2010: A Longitudinal Tract Database,” The Professional Geographer 66, no. 3 (July 3, 2014): 412–20. Maps are projected using ArcGIS Albers Equal Areas Conic USGS.
- The total number of census tracts also increased, to accommodate population growth. However, the growth in high-poverty tracts was far faster than the growth of census tracts overall. Moreover, virtually all of the growth in census tracts occurred in suburban areas as tracts experiencing rapid population growth were split, not in poverty zones in the urban core, which in most cases were losing population.
- W. H. Frey et al., “Tracking Metropolitan America into the 21st Century: A Field Guide to the New Metropolitan and Micropolitan Definitions,” Living Cities Census Series (Washington, DC: Metropolitan Policy Center, Brookings Institution, November 2004), http://trid.trb.org/view.aspx?id=748101.
- The Census Bureau considers race (white, black, and so on) as a separate construct from Hispanic ethnicity. In other words, Hispanics may be of any race. In sub-group analyses, I cross the race and ethnicity variables to use categories more in keeping with common perceptions: non-Hispanic whites; African-Americans, that is, blacks; and Hispanics, regardless of race. While there could be a slight overlap of blacks and Hispanics, particularly in areas with a large Puerto Rican population, the ACS does not provide data on poverty status for non-Hispanic blacks. Other race categories, such as Asians, Native Americans, and Hawaiians have small samples in most census tracts, so they are omitted from this analysis.
- Brett Drake and Mark R. Rank, “The Racial Divide among American Children in Poverty: Reassessing the Importance of Neighborhood,” Children and Youth Services Review 31, no. 12 (December 2009): 1264–71.
- In contrast, concentrated poverty and the “social pathologies” of the inner city ghetto in the 1980s and 1990s were the subject of much public and academic debate, including William Julius Wilson’s seminal work, The Truly Disadvantaged: The Inner-City, the Underclass and Public Policy (Chicago: University of Chicago Press, 1987); Ken Auletta’s book The Underclass (New York: Random House, 1982); a widely discussed series in The Washington Post, later published as a book by Leon Dash, When Children Want Children (New York: William Morrow, 1989); and a controversial Bill Moyers report on out-of-wedlock childbearing on the CBS News Special Report, “The Vanishing Family: Crisis in Black America” (1986).
- Julia Burdick-Will et al., “Converging Evidence for Neighborhood Effects on Children’s Test Scores: An Experimental, Quasi-Experimental, and Observational Comparison,” in Whither Opportunity: Rising Inequality, Schools, and Children’s Life Chances, ed. Greg J. Duncan and Richard J. Murnane (New York: Russell Sage Foundation, 2011), 91–115; Tama Leventhal and Jeanne Brooks-Gunn, “The Neighborhoods They Live in: The Effects of Neighborhood Residence on Child and Adolescent Outcomes,” Psychological Bulletin 126, no. 2 (2000): 309–37; Patrick Sharkey, “The Acute Effect of Local Homicides on Children’s Cognitive Performance,” Proceedings of the National Academy of Sciences 107, no. 26 (June 29, 2010): 11733–38; Patrick Sharkey, “The Intergenerational Transmission of Context,” American Journal of Sociology 113, no. 4 (January 1, 2008): 931–69.
- William Julius Wilson, The Truly Disadvantaged: The Inner-City, the Underclass and Public Policy (Chicago: University of Chicago Press, 1987).
- Paul A. Jargowsky and Mohamed El Komi, “Before or after the Bell? School Context and Neighborhood Effects on Student Achievement,” in Neighborhood and Life Chances: How Place Matters in Modern America, ed. Harriet B. Newburger, Eugenie L. Birch, and Susan M. Wachter (University of Pennsylvania Press, 2011), 50–72; Ann Owens, “Neighborhoods and Schools as Competing and Reinforcing Contexts for Educational Attainment,” Sociology of Education 83, no. 4 (2010): 287–311.
- Paul A. Jargowsky, “Immigrants and Neighbourhoods of Concentrated Poverty: Assimilation or Stagnation?” Journal of Ethnic and Migration Studies 35, no. 7 (August 1, 2009): 1129–51.
- Paul A. Jargowsky, “Sprawl, Concentration of Poverty, and Urban Inequality,” in Urban Sprawl: Causes, Consequences, and Policy Responses, ed. Gregory Squires, 2002, 39–72; Gregory Squires, Urban Sprawl: Causes, Consequences & Policy Responses (The Urban Institute, 2002).
- Myron Orfield, Metropolitics: A Regional Agenda for Community and Stability (Washington, DC: Brookings Institution Press, 1996); David Rusk, Cities without Suburbs (Washington, DC: Woodrow Wilson Center Press, 1993); David Rusk, “Growth Management: The Core Regional Issue,” in Reflections on Regionalism, 2000, 78–106.
- Gregory D. Squires et al., “Housing Affordability in the Milwaukee Metropolitan Area: A Matter of Income, Race, and Policy,” Journal of Affordable Housing & Community Development Law 9, no. 1 (October 1, 1999): 34–73; Jargowsky, “Sprawl, Concentration of Poverty, and Urban Inequality”; Douglas S. Massey, Jonathan Rothwell, and Thurston Domina, “The Changing Bases of Segregation in the United States,” The ANNALS of the American Academy of Political and Social Science 626, no. 1 (November 1, 2009): 74–90; Jonathan T. Rothwell and Douglas S. Massey, “Density Zoning and Class Segregation in U.S. Metropolitan Areas,” Social Science Quarterly 91, no. 5 (December 1, 2010): 1123–43.
- Yana Andreeva Kucheva, “Subsidized Housing and the Concentration of Poverty, 1977–2008: A Comparison of Eight U.S. Metropolitan Areas,” City & Community 12, no. 2 (2013): 113–33; Kirk McClure, “Deconcentrating Poverty With Housing Programs,” Journal of the American Planning Association 74, no. 1 (2008): 90–99; Ann Owens, “The New Geography of Subsidized Housing: Implications for Urban Poverty,” Doctoral dissertation, Harvard University, 2012; Shannon Van Zandt and Pratik C. Mhatre, “Growing Pains: Perpetuating Inequality Through the Production of Low-Income Housing in the Dallas/Fort Worth Metroplex,” Urban Geography 30, no. 5 (July 1, 2009): 490–513.
- Calculated from the 2008–12 ACS file, using census tracts as proxies for neighborhoods. When tracts cross the boundary of Ferguson, only the census tract part (Summary Level 80) within the City of Ferguson is included. Summary Level 80 is not available in the 2009-2013 file.
- R. Pendall, “Local Land Use Regulation and the Chain of Exclusion,” Journal of the American Planning Association 66, no. 2 (2000): 125–42; Rachel E. Dwyer, “Expanding Homes and Increasing Inequalities: U.S. Housing Development and the Residential Segregation of the Affluent,” Social Problems 54, no. 1 (February 1, 2007): 23–46.
- “‘Inequality Is a Choice,’” The New York Times, May 2, 2015.
- Adam Liptak, “Justices Back Broad Interpretation of Housing Law,” The New York Times, June 25, 2015, http://www.nytimes.com/2015/06/26/us/justices-back-broad-interpretation-of-housing-law.html; Reuters, “U.S. Issues New Rule to Promote Racial Integration in Housing,” The New York Times, July 8, 2015, http://www.nytimes.com/reuters/2015/07/08/us/08reuters-usa-housing.html.
