
Executive Summary
American higher education has a stratification problem. The country’s most selective, well-resourced private and public universities predominantly enroll students from families with privileged backgrounds, while the remaining students, attending the bulk of public colleges, face affordability challenges, as millions of Americans forgo higher education due to high prices.
Two key tools that have the power to remedy stratification aren’t being used effectively. State grant aid and institutional grant aid programs—which together totaled nearly $100 billion in aid last year—fall behind the Pell Grant in their effectiveness at reducing costs for students.1 In some ways, state grant aid and institutional grant aid actually redistribute resources from the education sector’s bottom to its top. It would be reasonable to expect that college tuition, as with most goods and services, would be priced as low as it could be, meaning that high prices signal high value. But in many corners of higher education today, tuition starts out as overpriced and then is adjusted down through grants—a model of funding known as “high-tuition, high-aid” or “tuition discounting.” In college-president-speak, “We feel we’ve increased the value proposition to get [families] to be willing to pay more.”2
But on the college applicant side, higher prices get easily confused with higher value, and the large discounts offered (to nearly everyone) get confused with shouldn’t-miss opportunities. “High-tuition, high-aid” is an experiment in psychology in which millions of families participate every year, and the results are less promising than one would hope: many families experience sticker shock at the initial price and thus turn away from higher education before they know what aid they could qualify for, and concurrently, a large share of the aid spent by states and colleges winds up being used to compete for students who appreciate but perhaps don’t really need the help.
In the current policy landscape it’s more important than ever to get grant aid to the students who need it most. At a time when student loans are set to become more burdensome for families, the good news is that grant aid is abundant; but unfortunately, it is not adequately directed toward addressing need.3 This report provides new analysis into the distributions of state and institutional financial aid, finding that a large share of these funds are handed out to compete for high-income students, contributing to an increasingly complex system yet failing to narrow affordability gaps for low-income students. For example, the report finds:
- A high share of state and institutional grant dollars go to students without financial need for them, even while low-income students have unmet need that they must take out loans or seek work to fill.
- More than half of students from the top quartile by income receive grants in excess of need (56 percent), versus virtually none (0.2 percent) among students in the bottom quartile. In other words, students in the top quartile are 280 times more likely to receive grants in excess of need as are students in the bottom quartile. Overall, an estimated 10 percent of grant aid is provided in excess of need, including at least $10 billion per year in state and institutional grant aid.
- Similarly, the share of white students who receive grants in excess of need (19 percent) is about threefold that of Hispanic students and Black students (5 percent).
- Merit-based grants comprise an increasing share of state grants, rising 17 percentage points since 1982, a trend that results in less aid going to those with the greatest need.
- State grants disproportionately benefit students at highly selective public colleges, with an average of $3,693 going to students at highly selective public colleges, compared to $842 going to students at open admission public four-year colleges.
- Institutional grants at public universities flow in high amounts to out-of-state students, who are not in the state constituency. At public four-year institutions, out-of-state students receive larger institutional grants by a factor of two-to-one, on average, compared to in-state students.
- A student at a public four-year institution is actually less likely (42 percent) to receive financial help from their college if they have an Expected Family Contribution (EFC) of $0, compared to those with higher EFCs (47 percent).
In some states, programs are working better than others to help students with financial need. The Century Foundation provides states with an interactive data tool to understand how net price is shaped for their residents, broken by family income, first-generation status, race and ethnicity, and institution type.
Making college more affordable for families that truly need aid matters more than ever now that Congress has made student loan debt more difficult to repay and has put ticking time-bombs in state budgets through its public benefit cuts.
State and institutional grant aid programs total $100 billion a year: can they move the needle on affordability more? They can, but only through concerted, sustained efforts to build a better college financing system.
Introduction: With More Aid Than Ever, Why Isn’t College More Affordable?
The United States funds higher education very differently today than it did forty years ago. The burden of public college costs, for example, has dramatically shifted from government support to students and families: whereas families’ tuition money comprised 21 percent of public colleges’ revenue in the early 1980s, it made up 39 percent last year, nearly doubling.4 As tuition prices at public institutions have risen, so have prices at private institutions. In many areas, high tuition has gone from “niche” to “norm.”
This shift makes grant aid—money that does not need to be repaid—increasingly essential to offset costs. The most well-known grant for college is the federal Pell Grant, but students receive grants from other sources, too. Through state grant programs such as New York’s Excelsior Scholarship, California’s Cal Grant, and Florida’s Bright Futures Scholarship, state governments provide students with vouchers on the condition that they stay in-state.5 Through institutional grant programs such as the University of North Carolina’s Morehead-Cain Scholarship and Howard University’s Karsh STEM Scholarship, colleges functionally waive tuition and may even offset expenses such as books and meals, depending on the award amount.6 States operated more than 400 grant programs in 2023, while institutional programs likely number in the tens of thousands.7
While tuition revenue grew 3.6 times faster than inflation over the past forty years,8 lawmakers and college leaders significantly increased the financial aid they offer to families over that period, especially state and institutional aid:9
- Total federal grant aid grew 1.5 times faster than inflation.10
- Total state grant aid grew 3.7 times faster than inflation.11
- Total institutional grant aid grew 12.8 times faster than inflation.12
Figure 1 depicts the long-term rise of state and institutional grants, with institutional grants eclipsing federal grants in total amount for most years since the 1990s. Today, state and institutional grants’ total is just shy of $100 billion.
FIGURE 1
When students receive their financial aid letters and cost estimates, the “aid” side of the ledger is often impressive, these days more than ever. In 1995–96, on average, for every $1.00 in tuition an undergraduate was charged, they received $0.38 in total grants; in 2019–20, that ratio had risen to $0.54, an increase of 42 percent in aid relative to tuition.13 More recent figures reflecting a sample of private nonprofit institutions show that, on average, across these institutions, more than half of the tuition prices that they charge are offset by institutional grants alone.14 Grants are so widespread that only one-quarter of in-state public college students actually pay full price.15
That would sound like a reason to celebrate—but the story is complicated. Such growth in institutional aid has only been possible through a growth in tuition prices.16 Similarly, every dollar in a state grant is a dollar that the state didn’t allocate toward state appropriations, pushing tuition upward at public institutions, which enroll the majority of students.
It would be reasonable to expect that college tuition, like most goods and services, is priced as low as it could be, meaning that high prices signal high value. But in many corners of higher education today, tuition is priced up and then adjusted down through grants, increasingly following the “high-tuition, high-aid” model. And the federal government has been only a minor player in that movement: today, the vast majority of grant aid is non-federal.17
Grant Aid Amounts Are High, But So Are Net Price Burdens
How does the aid boom impact “net price,” the cost of attendance after factoring in grants? After all grants are taken into account, students appear to be receiving a large discount: the median in-state full-time undergraduate in 2019–20, for example, paid $8,300 to attend community college ($12,200 in sticker price), paid $15,300 to attend a public four-year institution ($24,200 in sticker price), and paid $19,900 to attend all other sectors ($35,900 in sticker price).18
But the relative burden of these deeply discounted net prices varies greatly depending on family income. As Figure 2 shows, the median net price for full-time enrollment equals 15 percent of annual income among those in the richest quartile, but 88 percent of annual income among the poorest quartile.
FIGURE 2
In other words, a family in that bottom quartile would have only a small slice of their income left over after covering costs, even after factoring in federal, state, and institutional grants.19 It was not always like this: similar estimates show that gaps by income were only half as large, as recently as the early 2000s.20
Looking at the data shows similar stark gaps by race and first-generation student status. Among students enrolled full-time, unmet need is 41 percent of income for the median Black student, 35 percent for the median Hispanic student, and 38 percent for the median first-generation college student.21 Net price relative to income is a major reason why students from high-poverty schools and high-minority schools are substantially less likely to enroll in a four-year college than those from low-poverty and low-minority schools, a signal that the state of family finances continues to divide college enrollment.22
Overall, analysis for this report estimates that about 10 percent of all grant aid is in excess of need.23 But that is not the same for all students: among undergraduates, the share is virtually zero for federal grant recipients and 27 percent for students who do not receive federal grants.24 In other words, aid in excess of need comes largely from state and institutional grant aid, not the Pell Grant or other federal aid.25 As a lower bound, conservative estimate, at least $10 billion in state and institutional grant aid is provided in excess of need every year.26
Two seemingly contradictory things are true at once: the amount of financial aid available has never been higher, and yet, adults who have never enrolled in college cite cost as the most frequent barrier to pursuing a degree.27 If a student doesn’t get all the aid they’re eligible for, they can’t enroll—and even if they do get all the aid they can, they may still be unable to afford it without turning to loans, which Congress just made less affordable through the repeal of the Saving on a Valuable Education (SAVE) repayment plan. Grant aid is abundant, but it’s not adequately addressing need.
If higher tuition is the cost of higher aid, is the tradeoff worth it? It’s debatable. In one study, high school graduates who perceived college as unaffordable were 20 percentage points less likely to enroll within three years of graduation compared to those who deemed it affordable.28 And some students get turned off from college before aid enters the picture: in one survey, a striking 81 percent of high school seniors reported being discouraged from applying to colleges due to the high sticker price (that is, the published costs before financial aid is considered).29 Another analysis suggests that a 10 percent increase in sticker price can generate a decrease in applications of 1–2 percentage points—even at institutions that would have met the full demonstrated need of their in-state residents.30 The “high-tuition” side of “high-tuition, high-aid” is harming interest in college, perhaps more than the “high-aid” side can help it.
Few consumers of higher education have a good understanding of the complex dynamics of college pricing; as a result, some people don’t enroll in college who might have otherwise. In one study, half of adults who had never enrolled in college stated they would be more likely to pursue a bachelor’s degree after learning more about the true cost of college.31 Efforts to simplify financial aid letters are helping,32 and better access to information helps correct misconceptions. However, informational interventions don’t change the math of affordability.
It’s more important than ever to get grant aid to students who need it most, because the uphill climb low-income families have long faced when pursuing college has gotten steeper over the past six months. Congress’s recent changes to the federal student loan program will increase payments for millions of future borrowers by an estimated $3,000 on average and eliminate pathways to forgiveness, making it more imperative than ever to help students minimize borrowing.33 When student loans are riskier, grants are even more vital: not just the Pell Grant, but state and institutional grants, too. And, if history is a guide, that same bill may cause states to increase tuition at public institutions due to its cuts to public benefits, particularly Medicaid and the Supplemental Nutrition Assistance Program (SNAP).
Despite headwinds, the system can be improved. The following sections of this report details the root causes of the “high-tuition, high-aid” model, how its shortcomings affect college affordability, and directions for states to move forward.
The Psychology of High-Tuition, High-Aid
How did higher education slide into “high-tuition, high-aid”? To understand this, it helps to look not only from the view of the college, but also from the view of the student.
Many colleges compete for the most academically promising students, in the hopes that they enroll and help boost rankings.34 And states, too, compete for the best students, in the hopes that these promising individuals remain in the state and contribute positively to the economy. This competition among states, and competition among colleges, motivates program design decisions that siphon aid away from students who need it the most. The more that competition is present, the more the system caters to the wealthy rather than those in need. (And colleges certainly don’t mind if they enroll students whose parents can afford to make donations.)
This all amounts to a kind of market failure. Competition among colleges should push prices down, not up; but, as the next section shows, because applicants’ decisions between colleges get made on the cost after aid, colleges wind up pushing sticker prices up and then compete on net price. That would be comical if it weren’t concerning: it benefits only the students the colleges compete for, a group that skews wealthy, and hurts everyone else.
Monopoly Money Has Warped Higher Education, For the Worse
Consumers of most products—whether it’s a college degree or a flatscreen television—assume that high prices signal high value. But that’s not always true, especially in the college context: the explosion of institutional aid indicates how colleges create their own demand by restricting access (raising tuition) and then making students feel like they are being given an especially good deal (via institutional aid). In their own way, states do the same with state grants. Colleges and states that do not engage in the “high-tuition, high-aid” model may find themselves at a competitive disadvantage in a market where the perception of prestige—created by costly tuition sticker prices—carries such immense weight.
To help see why colleges continue to do this, consider the experience of shopping in a department store. A jacket that’s 75 percent off feels like too good a deal to pass up, so shoppers will frequently buy it that same day. Only when they return a month later and see that it’s still 75 percent off do they realize it must not be the high-end jacket they thought it was.
That type of loss aversion is a real factor in student’s financial aid packages. Imagine being a student receiving the two award letters in Table 1.
TABLE 1
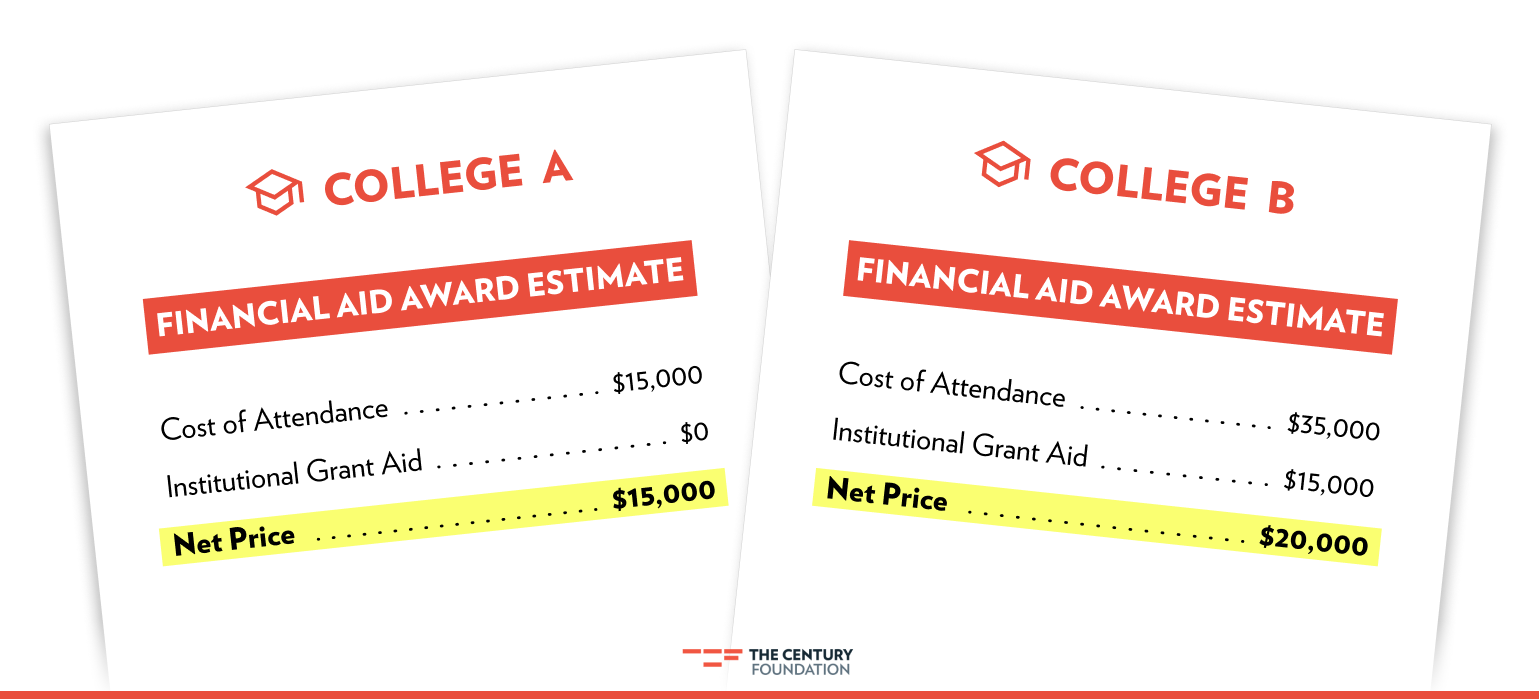
All else equal, most students would likely pick College B. Though saying “yes” to College A requires less money out of pocket than saying “yes” to College B, it requires the student to say “no” to $15,000 in institutional grant aid. Does the education actually cost $20,000 per year more at College B? Is it $20,000 better? There’s no way for them to know, but many students assume so. And $15,000 is more than most students have ever been offered in their lives.
Importantly, students and families don’t know about this financial maneuvering, which is part of a strategy known as enrollment management that hinges on artificial prices. Every grant award, especially if it is awarded on the basis of merit, feels earned, perhaps even special: scholarships make students feel wanted.35 A student at George Washington University may think the exclusive-sounding Presidential Academic Scholarship was only offered to a select few, not realizing half of their prospective classmates receive it, too.36 “High-tuition, high-aid” is an experiment in psychology as much as one of economics.
What’s particularly scary is that colleges know the exact amount of money to put on that letter to make it a difficult question.37 Per the Wall Street Journal’s reporting:
Using econometric modeling, EAB knows that a $23,000 discount on a $50,000 sticker price has a 24% chance of luring a young woman with middle-of-the-road grades to a nearby private college in the Midwest. Bumping the scholarship up to $28,000 yields a 47% likelihood.38
If the resulting net price is more than the family can pay out of pocket, then the college may add student loans, even Parent PLUS loans, to the letters. Some public universities have gone all-in on that strategy: Penn State is not the largest university in the country, but one might think so based on its students and alumni’s total debt level of outstanding Parent PLUS loans, the nation’s largest ($1.4 billion as of 2022).39
That’s the story at selective colleges, where most students who apply have a “College A” and a “College B” they’re considering. The remaining slice of colleges enroll many students who primarily choose between “College A” and “No College.” These are the colleges that drive the fact that the typical student enrolls in a college that’s just seventeen miles from their home.40 These students could be turned off once they hear College B’s sticker price—which was jacked up in order to create the $15,000 discount.
A Self-Sustaining Cycle
Now, consider a different set of award letters, in Table 2. It’s the same as in Table 1, except that in this case, the student is eligible for a $2,500 state grant, which can be taken to either College A or College B.
TABLE 2
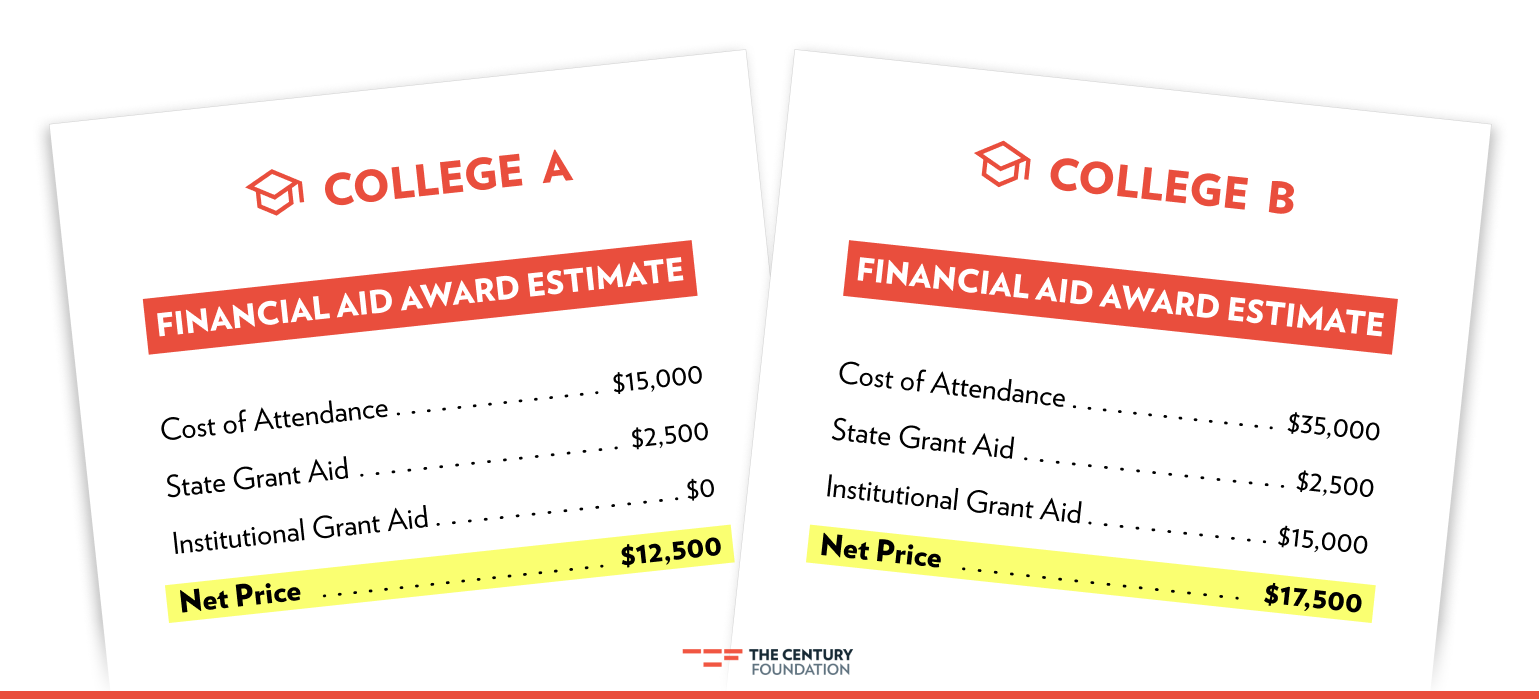
Assuming the student still experiences the loss aversion of the $15,000 institutional grant, and still equates high prices with high value, they will choose College B. Now the state grant is bound for College B—which means the institutional grant aid has essentially lassoed the state grant. That’s a critical loss for College A, because grant aid doesn’t just help students get in; it also helps them persist toward a degree and ultimately graduate. That, in turn, boosts College B’s rankings, which heavily weight graduation rates.
On the one hand, the student has “voted with their feet” for College B. But College B is also using the combination of higher tuition and institutional aid to improve their prestige in the long-term. That comes with immense advantages over peer institutions like College A, in many ways: alumni donations, faculty hiring, and recruiting students from wealthy families who can pay full price. The disconnect between high tuition and high value is one reason why many of the colleges that top economic mobility rankings are not those that top U.S. News rankings.41
In this way, “high-tuition, high-aid” is making the nation’s higher education landscape more stratified. Colleges and universities that do not engage in the model may find themselves at a competitive disadvantage in a market where the perception of prestige carries such weight—the situation is rightfully called a “prisoner’s dilemma.”42 The president of College A likely wonders if they should go along with their fellow prisoners.
The Factors that Shape Students’ State and Institutional Aid
Knowing that aid can be a powerful tool for recruitment and affordability, it makes sense to ask: Do state and institutional grants reach those who need it?
As the bedrock of college financial aid since the 1970s, the Pell Grant can serve as a benchmark for comparing other programs. Eligibility rules for the federal Pell Grant program are written in statute, creating a high level of public transparency. As a fully need-based grant on a sliding scale, the Pell Grant program provides more assistance to those with fewer resources. The Pell Grant is also a federal entitlement, meaning no student who qualifies is turned away.
But at the national level, state and institutional grants fall behind federal grants in their effectiveness at improving college affordability. As Figure 3 shows below, the distribution of Pell Grant aid at public four-year institutions is progressive by income, with more going to lower-income families, but the same is not equally true for state and institutional grants.43
FIGURE 3
While the distribution of total aid in Figure 3 is progressive, it is less progressive than it would be if state and institutional programs tracked with the Pell Grant more closely.
If affordability is the goal, state and institutional grants are working inefficiently. One way we know this is through the share of students who receive grants in excess of “federal need”; that is, their cost of attendance minus their expected family contribution (EFC).44 To a far greater extent than for federal grants, some state and institutional grants (as well as private grants) go to those who do not need them. It is a consequence of policy decisions about who qualifies for grant aid and for how much.
Across all sectors, only 10 to 15 percent of undergraduate students receive grants whose totals exceed their need, but it is highly skewed toward upper-income students. (See Figure 4, below.) More than half (56 percent) of students from the top quartile by income receive grants in excess of need, versus virtually none (0.2 percent) among students in the bottom quartile.45
FIGURE 4
The fact that more than half of students in the top quartile by income receive grants in excess of need is compelling evidence that state and institutional aid is being used for purposes other than increasing affordability, and that a significant amount of aid is being misallocated.
Differences by race are especially apparent along this metric: about three times as many white students (19 percent) receive grants in excess of need as do Hispanic students and Black students (5 percent).46 There is also wide variation by state, with average amounts of grants in excess of need north of $1,700 in four states’ public four-year sectors—Louisiana, South Carolina, West Virginia, and Wyoming—compared to $206 in California and $8 in Puerto Rico.47
Other research has found that, from 2001–17, public four-year colleges directed nearly $32 billion in institutional aid toward students without demonstrated financial need, and that $1 in $3 spent in institutional grants from public research universities and land-grant universities in 2014–15 went to students without financial need.48 In a world in which all students’ financial needs were met, it would not be a problem for a fraction of lucky students to receive more than they need. However, that is not the reality we live in.
Need versus Merit
For state and institutional grant aid programs, is affordability the goal? Less so than it used to be.
Need-based grants, which are awarded on the basis of financial need, are—unsurprisingly—more efficient at reaching students who need grant aid. By contrast, merit-based grants are awarded without attention paid to financial need.49 While Pell students at public institutions are about equally likely as non-Pell students to receive a state merit-based grant, they are 3.5 times as likely as non-Pell students to receive a need-based grant. (See Figure 5, below.) In other words, lower-income students do not lack “merit,” but every dollar delivered on a merit basis to a student who didn’t need it could have helped another student who did need it but didn’t receive it.
FIGURE 5
A major problem, then, is the balance of need versus merit. State lawmakers and university administrations are authorizing less aid on the basis of need than they used to, compared to merit aid. The share of state grants awarded on the basis of need has decreased by 17 percentage points since 1982, dropping from 91 percent to 74 percent.50 (There is important variation by state, where twenty-two states award nearly all aid based on need, while twelve states and Washington, D.C. allocated less than half of their aid on this basis.51)
State lawmakers and university administrations are authorizing less aid on the basis of need than they used to, compared to merit aid.
It’s a similar story for the role of need in institutional aid, too. One analysis of 339 public universities’ aid in the 2000s and 2010s found that their growth in merit aid for students without need outpaced increases in need-based aid, dubbing it a “merit aid arms race.”52
One analysis of 339 public universities’ aid in the 2000s and 2010s found that their growth in merit aid for students without need outpaced increases in need-based aid, dubbing it a “merit aid arms race.”
When the concept of “merit” is operationalized in terms of test scores and GPA, without any context for what the student had to overcome to attain those marks, it largely rewards students who have already benefitted from well-funded K–12 schools and who could afford tutoring and application-boosting extracurriculars. Due to the longstanding links between wealth, housing, and property taxes funding local schools, schools in communities with more high-income families and more white families enjoy more academic support, more experienced teachers, or smaller class sizes for better academic outcomes.53 And yet, many state financial aid programs set minimum GPAs in their eligibility requirements, and college rankings incentivize institutions to use their grant aid to attract these high-scoring students.
Previous research has detailed that other policy design choices, including full-time enrollment requirements and a requirement to enroll immediately after high school, hamper state grant aid programs’ ability to help low-income students.54 Much like eligibility criteria based on merit, these rules can have the effect of shutting out hardworking, lower-income students for whom affordability challenges may be especially acute. (For a review of this literature on state and institutional financial aid programs, see the appendix to this report.)
Gaps in State Aid Across Institution Types
Alongside the question of who receives state grants is the question of where the students take those grants. Like Pell Grants, state grants tend to be portable from one college to another, acting as a voucher.
But lawmakers’ decisions about which colleges are eligible to receive them and which students qualify has knock-on effects on where the money goes. For example, one study finds that, among Ohio’s low-income in-state college students, there is a gap of 54 percentage points in the share of students who receive need-based state grants between the public four-year sector (63 percent) and the public two-year sector (9 percent).55 And within public four-years, institution type matters: the average student at a highly selective institution receives three times more in state grants ($3,693) than the average student at an open admission four-year college ($842).56
Figure 6, below, shows a version of Figure 3, broken out for two groups of colleges by selectivity. The amounts for Pell Grants are largely the same, and it is not surprising that very selective colleges show more institutional aid, given their higher tuition prices. But the difference in amounts for state grants raises indicates that, on average, states tilt toward favoring students attending very selective schools.
FIGURE 6
In some states, state grant programs target low-income students and those attending less prestigious colleges; in others, the grants go more to high-income students and those at more selective institutions. The distribution of state grant dollars across institutions raises questions not only about which students are “deserving” of state support, but also which institutions. A state grant benefits the college that receives it: it helps close students’ affordability gaps, helping them graduate. That means cutting appropriations across the board (as states did in the Great Recession) and putting the money into state grants that largely flow to the most selective institutions is, functionally, a redistribution of resources from higher education’s bottom to its top.
Cutting appropriations across the board (as states did in the Great Recession) and putting the money into state grants that largely flow to the most selective institutions is, functionally, a redistribution of resources from higher education’s bottom to its top.
Gaps in Institutional Aid Across Student Types
The money for institutional grants can come from various sources within an institution’s cash flow: tuition money paid by other students, endowment returns, state appropriations, or funds provided by a donor. Institutional grants are minimal at community colleges and open admission four-year institutions (see Figure 6, above). But at selective four-year schools, they comprise the lion’s share of grant aid.
Institutional aid helps a college enroll the students it wants most, and too often, enabling low-income students to enroll isn’t the top budget priority: at most public four-year college types, higher-income students receive roughly equal institutional grant aid as lower-income students.57 Rather, competition among institutions for higher-paying out-of-state students may be the top priority. Within each stratum of selectivity at public four-year institutions, out-of-state students—who are, by definition, not the primary constituency of public state institutions—receive higher amounts of institutional grant aid compared to in-state students.58 (See Figure 7, below.)
FIGURE 7
Large amounts of institutional financial aid, if targeted at out-of-state students, can act as a kind of “affordability mirage.” Those students may receive more aid, but they also are paying higher tuition rates than in-state students. It is little surprise, then, that certain flagship state universities enroll more students from out-of-state than in-state.59
And even among in-state students, higher-income students enjoy more institutional grant aid. A student at a public four-year institution is actually less likely (42 percent) to receive financial help from their college if they have an EFC of $0, compared to those with higher EFCs (47 percent).60 Despite public four-year institutions’ vital role as engines of upward mobility, their institutional aid could better serve low-income students.
A Tool for States: Opening the Black Box of Net Price and Aid Distributions
This report has shared a number of national statistics on financial aid and net price, including concerning trends about existing systems favoring high-income students. But the problem isn’t equal in every state: some systems do a better job than others at targeting aid to those who need it most.
State leaders may wonder how the trends play out for the students and colleges they represent. Unfortunately, states do not all publish rigorous information about the demographics of aid recipients, and even those that do publish statistics don’t all report them in comparable ways. And the data that institutions report to the U.S. Department of Education don’t break down who receives financial aid.61
The lack of clarity makes it difficult to tell how effectively these programs are advancing college affordability, hindering public accountability. To connect the public with national- and state-level data, The Century Foundation has built a tool—the Financial Aid Distributions Tool—that coalesces data from the National Postsecondary Student Aid Study-Administrative Collection (NPSAS-AC), the most powerful data source available for looking within each of these fifty “black boxes.” State lawmakers and their constituents can use this tool to examine who receives financial aid in their state and how it shapes net price. The tool informs many of the statistics in this report.62
FIGURE 8
Open Financial Aid Distributions tool in a new tab. >
The tool shares state-by-state data on who receives federal, state, and institutional grants and how these shape net price, with breakouts by income, first-generation status, race/ethnicity, and institutional characteristics.
The data in the tool reveal where aid is (and isn’t) well-targeted to reduce costs for low-income students.63 For example:
- Arkansas’ in-state public four-year students who have EFCs of $0 average less grant support ($1,571) than their peers with higher EFCs ($2,338).64 That gap contributes to $0-EFC students at Arkansas’ in-state public four-years facing a net price that’s 88 percent of their income, compared to 20 percent for other students.65
- In the case of New Jersey, state and institutional grants move in opposite directions. State grant aid for New Jersey’s in-state public four-year students is quite progressive, averaging $5,733 to students from the bottom quartile by family income, for example, compared to $412 for those from the top quartile.66 But the state’s public four-years provide larger average institutional grants to those from the top quartile ($1,833, on average) than those from the bottom quartile ($736, on average).67
- Two neighboring states—Minnesota and Wisconsin—demonstrate well-targeted state grant aid. In both states, an in-state public four-year student from the bottom quartile by income averages at least eleven times as large a state grant as someone from the top quartile by income.68
States can use this tool to understand how the trends discussed in this report play out for their systems.
An Urgent Imperative to Better Target Grant Aid
The “high-tuition, high-aid” model is a form of fighting fire with fire, and the evidence shows that this approach is leaving too many people burned. Over the years, state and institutional grant aid programs have increasingly become focused on luring students with less need for aid to specific colleges rather than making colleges affordable to students with need.
Simply put, the wrong incentives are driving large shares of state and institutional grant aid. Competition for high-income students is pushing up tuition prices and leaving behind underserved communities.
While public colleges hold immense market power, they are increasingly adopting the model of private institutions. Absent change, existing tuition-setting patterns and financial aid structures may only work for a slimmer and slimmer slice of society, leaving behind low-income communities and communities of color. That risks causing public trust in higher education to decline further, if a college degree becomes increasingly the purview of the rich and well-resourced.
The $100 billion in state and institutional grants awarded every year is a powerful force that can be better harnessed. Analysis for the report estimates that students receive at least $10 billion in state and institutional grants per year in excess of their need, virtually all of which is received by students who do not receive the Pell Grant. That amount alone, if redistributed, could prove game-changing for low-income students–including those who must pay almost all their annual income to cover their unmet need and must often turn to student debt.
To create a fairer system of higher education, a fundamental shift must occur, directing resources to actually reduce what families pay out of pocket and through student debt. There is a role for states to play, to design aid programs to better support low-income families and less-resourced institutions. There is a role for institutions to play, to better orient their financial aid budgets towards access and affordability. And there will be a role for the federal government, too, although recent actions by Congress and President Trump will only make it more difficult for students to afford college.
The trends highlighted in this report play out differently in every state, and not all to the same degree; there can also be variation among colleges within the same state. States need to understand the current dynamics for their students and colleges, so that they can better meet the financial needs of low-income families and improve affordability for all.
States can start by conducting audits on the grant aid that they and their public colleges award, including trends analyzed in this report:
- variations in net price as a share of annual income,
- grants above what high-income families need to cover college costs,
- growth in merit-based grants versus need-based grants,
- disparities in state grants between selective institutions and open admission colleges,
- institutional grant aid to out-of-state students, and
- unmet need among applicants who applied and then did not enroll in any college.
TCF’s Financial Aid Distributions Tool can serve as a starting point for states’ information-gathering and help them identify critical gaps. That information can guide action to reverse the long-term trend of widening gaps in the cost burden of college.
Conclusion: Tackling The Real Cost Drivers
It is vital that lawmakers advance well-grounded solutions for the problem of high net price.
It is not guaranteed that they will. This spring, the House Judiciary Committee started probing the eight Ivy League institutions, alleging that they were “collectively raising tuition prices … engaging in perfect price discrimination by offering selective financial aid packages to maximize profits.” They aver that there exists a collusive price-fixing scheme across the Ivy League, and this summer they subpoenaed Harvard, Penn, and Brown.69
Linking a desire for more affordable college to the Trump administration’s perverse assault on those same Ivy League institutions will not solve what is a genuine issue for American families, an issue for which bipartisan reform is still possible if it’s done right and in good faith.
These lawmakers correctly identify a problem, stating “the market is not functioning properly,” but they get the cause wrong. Institutions simply don’t need a coordinated scheme in order to follow the incentives in front of them today, nor is the pattern limited to the Ivy League. Linking a desire for more affordable college to the Trump administration’s perverse assault on those same Ivy League institutions will not solve what is a genuine issue for American families, an issue for which bipartisan reform is still possible if it’s done right and in good faith.
Making higher education truly affordable for all requires sustained efforts by states and colleges to adequately address need and requires a collective effort to restrain from the seemingly never-ending rise of tuition. But if they can direct the money better, they may then find just how far a hundred billion can take them.
The authors thank Jessica Thompson, Kayla Elliott, Bill DeBaun, Stephen Burd, and Angela Hanks for their feedback on an earlier draft of this report. The code for the original analysis in this report and the interactive data tool can be found at this GitHub repository.
Appendix: Review of literature on state and institutional financial aid programs.
Notes
- This total is derived from the College Board’s Trends in Student Aid report and includes all sectors of U.S. higher education captured by the original data sources, which include the Integrated Postsecondary Education Data System (IPEDS) and the annual surveys of the National Association for State Student Grant and Aid Programs (NASSGAP). See Table SA-1 in Jennifer Ma, Matea Pender, and Meghan Oster, “Trends in College Pricing and Student Aid 2024,” College Board, October 2024, https://research.collegeboard.org/media/pdf/Trends-in-College-Pricing-and-Student-Aid-2024-ADA.pdf.
- Melissa Korn, “Prizes for Everyone: How Colleges Use Scholarships to Lure Students,” Wall Street Journal, April 17, 2018, https://www.wsj.com/articles/prizes-for-everyone-how-colleges-use-scholarships-to-lure-students-1523957400.
- Elizabeth Guevara, “This New Student Loan Plan Will Cost Some Borrowers Thousands More,” Investopedia, August 20, 2025, https://www.investopedia.com/new-student-loan-repayment-plan-costs-more-11793023.
- See Figure 2.6: Net Tuition as a Percentage of Total Education Revenue, U.S., FY 1980–2024 in “State Higher Education Finance (SHEF) Report: 2024,” State Higher Education Executive Officers Association, May 2025, https://shef.sheeo.org/report/?report_page=distribution-of-revenue#student-share.
- “Excelsior Scholarship Program,” New York State Higher Education Services Corporation, n.d., accessed July 2025, https://www.hesc.ny.gov/find-aid/nys-grants-scholarships/excelsior-scholarship-program; “Cal Grant Programs,” California Student Aid Commission, n.d., accessed July 2025, https://www.csac.ca.gov/cal-grants; “Bright Futures Scholarship Program,” Florida Department of Education, n.d., accessed July 2025, https://www.floridabrightfutures.gov/.
- “About Morehead-Cain,” Morehead-Cain Foundation, n.d., accessed July 2025, https://www.moreheadcain.org/about/; “Karsh STEM Scholars,” Howard University, n.d., accessed July 2025, https://karshstemscholars.howard.edu/.
- A query of the National Association of State Student Grant Aid Programs (NASSGAP) Annual Survey shows 434 grant or scholarship programs active in 2023. See “Program Finder,” National Association of State Student Grant Aid Programs, n.d., accessed July 2025, https://www.nassgapsurvey.com/survey/program_finder/program_finder.asp. Since there are more than 6,000 institutions and most institutions have more than one grant program, there may be tens of thousands of institutional grant programs.
- Net tuition and fees totaled $4.2 billion in 1980 (or $16.4 billion in 2023 USD) and totaled $76.1 billion in 2023. Source: “All unadjusted SHEF metrics, 1980–2024,” State Higher Education Executive Officers Association, n.d., accessed June 2025.
- During this period, enrollment did not grow nearly as much as tuition. Between 1980 and 2023, total fall semester enrollment rose from 12,096,895 to 19,039,584, or a 57 percent increase. See Table 303.10 in “Digest of Education Statistics,” National Center for Education Statistics, n.d., accessed June 2025, https://nces.ed.gov/programs/digest/d24/tables/dt24_303.10.asp.
- From $17.5 billion in 1980–81 to $44.3 billion in 2023–24, in constant 2023 USD. See note on Figure 1.
- From $3.2 billion in 1980–81 to $15.2 billion in 2023–24, in constant 2023 USD. See note on Figure 1.
- From $6.0 billion in 1980–81 to $82.8 billion in 2023–24, in constant 2023 USD. See note on Figure 1.
- Author’s analysis of data from the National Postsecondary Student Aid Study: Undergraduates via NCES Datalab, table retrieval codes bqioia and cduuwi.
- “NACUBO Study Finds Private Colleges and Universities Are Offering Record Financial Aid to Students,” National Association of College and University Business Officers, June 24, 2025, https://www.nacubo.org/Press-Releases/2025/NACUBO-Study-Finds-Private-Colleges-and-Universities-Are-Offering-Record-Financial-Aid-to-Students.
- Phillip Levine, “Ignore the sticker price: How have college prices really changed?” Brookings Institution, April 12, 2024, https://www.brookings.edu/articles/ignore-the-sticker-price-how-have-college-prices-really-changed/.
- Consider that, if tomorrow every college in America increased tuition by a million dollars and gave every student a million dollars in grants, it would look like an aid avalanche, but families would still have to pay the same amount.
- In 2023–24, federal grants totaled $44.3 billion, state grants totaled $15.2 billion, institutional grants totaled $82.8 billion, and private grants totaled $18.7 billion. Federal grants comprise 28 percent of the total across these four categories, or 31 percent if private grants are excluded. Federal Work-Study and federal education tax benefits are not included in these calculations. Source: Jennifer Ma, Matea Pender, and Meghan Oster, “Trends in College Pricing and Student Aid 2024,” College Board, October 2024, https://research.collegeboard.org/media/pdf/Trends-in-College-Pricing-and-Student-Aid-2024-ADA.pdf.
- Source: Author’s analysis of data from the National Postsecondary Student Aid Study: 2019–20 via NCES Datalab, data retrieval codes caomiq. Data reflect students enrolled in-state full-time who applied for federal aid.
- Of course, the family could turn to student loans, but that comes with its own risks.
- See “Equity Indicator 4b(ii)” (page 171) in Margaret W. Cahalan, Nicole Brunt, Terry Vaughan III, Erick Montenegro, Stephanie Breen, Esosa Ruffin, and Laura W. Perna, “Indicators of Higher Education Equity in the United States: 2024 Historical Trend Report,” Pell Institute for the Study of Opportunity in Higher Education and the Alliance for Higher Education and Democracy at the University of Pennsylvania, 2024, https://www.pellinstitute.org/wp-content/uploads/2024/05/PELL_2024_Indicators-Report_f.pdf#page=172.
- Source: Author’s analysis of data from the National Postsecondary Student Aid Study: 2019–20 via NCES Datalab, data retrieval code rkryvk. Data reflect students enrolled full-time who applied for federal aid whose income is at least $1.
- For example, among graduates from the high school graduating class of 2023, the shares who immediately enrolled in a four-year college were 28 percent at high-poverty schools versus 59 percent at low-poverty schools, and were 33 percent at high-minority schools versus 47 percent at low-minority schools. (National Student Clearinghouse Research Center, “High School Benchmarks,” September 12, 2024. https://nscresearchcenter.org/high-school-benchmarks/.)
- For this back-of-the-envelope calculation, the average was taken for total grants and grants in excess of need using the National Postsecondary Student Aid Study: 2019–20 via NCES Datalab, table retrieval codes lwgfkb and amncps. The ratios roughly match for both undergraduate students (10 percent) and graduate students (11 percent). The inclusion of graduate students here is a minor divergence from the overall analysis in this report.
- Ibid.
- Other contributing sources include private and employer aid.
- Since 10 percent of all grants are awarded above need, and since Pell Grants comprise virtually none of those grants-above-need, then the share of state and institutional grants provided above need must be north of 10 percent, and thus the corresponding dollar amount is at least $10 billion (one-tenth of $100 billion).
- “Cost of College: The Price Tag of Higher Education and Its Effect on Enrollment,” Lumina Foundation, April 2024, https://www.luminafoundation.org/wp-content/uploads/2024/04/Cost.of_.College.pdf#page=6.
- “College Affordability Views and College Enrollment,” NCES 2022-057, U.S. Department of Education, 2022, https://nces.ed.gov/pubs2022/2022057.pdf.
- “The New Normal: 2022 Niche Senior Enrollment Survey,” Niche.Com, 2022, https://www.niche.com/about/wp-content/uploads/2022/09/2022-Niche-Senior-Enrollment-Survey.pdf.
- Phillip B. Levine, Jennifer Ma, and Lauren C. Russell, “Do College Applicants Respond to Changes in Sticker Prices Even When They Don’t Matter?” Education Finance and Policy 18, no. 3 (2022): 365–94, https://doi.org/10.1162/edfp_a_00372.
- “Cost of College: The Price Tag of Higher Education and Its Effect on Enrollment,” Lumina Foundation, April 2024, https://www.luminafoundation.org/wp-content/uploads/2024/04/Cost.of_.College.pdf#page=7.
- Stephanie Hughes, “How much will college cost? A new initiative wants to make it clear,” Marketplace, September 27, 2023, https://www.marketplace.org/story/2023/09/27/how-much-will-college-cost-a-new-initiative-wants-to-make-it-clear.
- Shahar Ziv, “GOP Plan Would End SAVE And Hike Student Loan Bills By $3,000 A Year On Average,” Forbes, May 12, 2025, https://www.forbes.com/sites/shaharziv/2025/05/12/gop-plan-would-end-save-and-hike-student-loan-bills-by-3000-a-year-on-average/; “Preliminary Economic Analysis of Budget Reconciliation Proposal on Student Loan Repayment,” Student Borrower Protection Center, April 28, 2025, https://protectborrowers.org/wp-content/uploads/2025/04/Economic-Analysis-of-EW-Recon-Markup_04-29-2025.pdf.
- Higher rankings then attract more applicants in the future, help draw donations, and serve as a magnet for faculty talent.
- Melissa Korn, “Prizes for Everyone: How Colleges Use Scholarships to Lure Students,” Wall Street Journal, April 17, 2018, https://www.wsj.com/articles/prizes-for-everyone-how-colleges-use-scholarships-to-lure-students-1523957400.
- Ibid.
- Stephen Burd, “Crisis Point: How Enrollment Management and the Merit-Aid Arms Race Are Derailing Public Higher Education,” New America, 2020, https://www.newamerica.org/education-policy/reports/crisis-point-how-enrollment-management-and-merit-aid-arms-race-are-destroying-public-higher-education/.
- Melissa Korn, “Prizes for Everyone: How Colleges Use Scholarships to Lure Students,” Wall Street Journal, April 17, 2018, https://www.wsj.com/articles/prizes-for-everyone-how-colleges-use-scholarships-to-lure-students-1523957400.
- Peter Granville, “Parent PLUS Borrowers: The Hidden Casualties of the Student Debt Crisis,” The Century Foundation, May 2022, https://tcf.org/content/report/parent-plus-borrowers-the-hidden-casualties-of-the-student-debt-crisis/.
- Nick Hillman, “How Far Do Students Travel for College?,” The Institute for College Access and Success, October 2023, https://ticas.org/wp-content/uploads/2023/11/HIllman-Geography-of-Opportunity-Brief-2_2023.pdf.
- Raj Chetty, John N. Friedman, Emmanuel Saez, Nicholas Turner, and Danny Yagan, “Mobility Report Cards: The Role of Colleges in Intergenerational Mobility,” Opportunity Insights, December 2017, https://opportunityinsights.org/wp-content/uploads/2021/12/mrc_summary.pdf.
- Liam Knox, “‘Merit Scholarship’ or Enrollment Incentive?” Inside Higher Ed, December 11, 2023; Stephen Burd, “Too Much Merit Aid for Those Not in Need,” New America, April 28, 2016, https://www.newamerica.org/weekly/too-much-merit-aid-for-those-not-in-need/.
- Figure 3 focuses on public four-year institutions since it is the best sector for analyzing the dynamics of both state and institutional grant aid across income. Public four-year institutions receive large amounts of state grant aid and distribute large amounts of institutional grant aid. By contrast, private institutions tend not to receive large amounts of state grant aid, and community colleges tend not to distribute large amounts of institutional grant aid.
- Or, more recently, their Student Aid Index (SAI).
- Author’s analysis of data from the National Postsecondary Student Aid Study: 2019–20 via NCES Datalab, data retrieval code xrtupd. Data reflect students enrolled in-state full-time who applied for federal aid.
- Author’s analysis of data from the National Postsecondary Student Aid Study: 2019–20 via NCES Datalab, data retrieval code lynqnc. Data reflect students enrolled in-state full-time who applied for federal aid.
- Author’s analysis of data from the National Postsecondary Student Aid Study: 2019–20 via NCES Datalab, data retrieval code tohtyd. Data reflect students enrolled in-state full-time who applied for federal aid.
- Stephen Burd, “Crisis Point: How Enrollment Management and the Merit-Aid Arms Race Are Derailing Public Higher Education,” New America, February 13, 2020, https://www.newamerica.org/education-policy/reports/crisis-point-how-enrollment-management-and-merit-aid-arms-race-are-destroying-public-higher-education/; Stephen Burd, “Too Much Merit Aid for Those Not in Need,” New America, April 28, 2016, https://www.newamerica.org/weekly/too-much-merit-aid-for-those-not-in-need/.
- Many programs are both need-based and merit-based. Figure 5 reflects need-based grants with or without a merit component, and merit-based grants without a need component (“merit-only”).
- Ma, Jennifer, Matea Pender, and Meghan Oster, “Trends in College Pricing and Student Aid 2024,” College Board, 2024, https://research.collegeboard.org/media/pdf/Trends-in-College-Pricing-and-Student-Aid-2024-ADA.pdf#page=49.
- Ibid.
- Stephen Burd, “Crisis Point: How Enrollment Management and the Merit Aid Arms Race Are Derailing Public Higher Education,” New America, February 2020, https://d1y8sb8igg2f8e.cloudfront.net/documents/Crisis_Point_2020-02-10_FINAL.pdf.
- “Closing America’s Education Funding Gaps,” The Century Foundation, July 22, 2020, https://tcf.org/content/report/closing-americas-education-funding/.
- For example, see the following: Williams, Brittani, 2024, “Who Deserves State Financial Aid? Eligibility Criteria for Students Entering College,” The Education Trust, https://edtrust.org/wp-content/uploads/2014/09/State-Financial-Aid-V7.pdf; “Aiding Attainment: Leveraging State Financial Aid for Success and Success, State Aid Scenarios,” Education Strategy Group, 2024, https://edstrategy.org/wp-content/uploads/2024/09/Aiding-Attainment-Student-Scenarios.pdf; Tiffany Jones, Jaime Ramirez-Mendoza, and Victoria Jackson, 2020, “A Promise Worth Keeping: An Updated Equity-Driven Framework for Free College Programs,” The Education Trust, https://edtrust.org/wp-content/uploads/2014/09/A-Promise-Worth-Keeping_An-Updated-Equity-Driven-Framework-for-Free-College-Programs_October_2020.pdf; Sandy Baum, Kristin Blagg, Leonardo Restrepo, and Fanny Terrones, “Race, Ethnicity, and the Design of State Grant Aid Programs,” The Urban Institute, 2023, https://www.urban.org/sites/default/files/2023-02/Race%2C%20Ethnicity%2C%20and%20the%20Design%20of%20State%20Grant%20Aid%20Programs%20Fact%20Sheet.pdf.
- Sandy Baum, Kristin Blagg, Leonardo Restrepo, and Fanny Terrones, “Race, Ethnicity, and the Design of State Grant Aid Programs,” The Urban Institute, 2023, https://www.urban.org/sites/default/files/2023-02/Race%2C%20Ethnicity%2C%20and%20the%20Design%20of%20State%20Grant%20Aid%20Programs%20Fact%20Sheet.pdf.
- Author’s analysis of data from the National Postsecondary Student Aid Study: 2019–20 via NCES Datalab, data retrieval code nglqsg. Data reflect students enrolled in-state full-time who applied for federal aid. Zero values are included in the calculation of averages.
- Source: Author’s analysis of data from the National Postsecondary Student Aid Study: 2019–20 via NCES Datalab, data retrieval code savbyy. Data reflect students enrolled full-time who applied for federal aid. The exception is that, at very selective public four-year institutions, Pell Grant recipients receive higher average institutional grant awards ($5,989) than do non-Pell students ($3,238).
- Author’s analysis of data from the National Postsecondary Student Aid Study: 2019–20 via NCES Datalab, data retrieval code pmtxyr. Data reflect students enrolled full-time who applied for federal aid. Zero amounts are included in the calculation of averages.
- Stephen Burd, “The Out-of-State Student Arms Race,” New America, May 2015, https://static.newamerica.org/attachments/3120-out-of-state-student-arms-race/OutOfStateArmsRace-Final.b93c2211cdfb4c3da169d668fbb67cc1.pdf. Note that some states have sought to address this through fines: see Scott Jaschik, “N.C. A&T Fined $2M for Admitting Too Many Out-of-Staters,” Inside Higher Ed, November 21, 2022, https://www.insidehighered.com/news/quick-takes/2022/11/21/nc-fined-2m-admitting-too-many-out-staters.
- Author’s analysis of data from the National Postsecondary Student Aid Study: 2019–20 via NCES Datalab, data retrieval code alrmrv. Data reflect students enrolled full-time who applied for federal aid. Among in-state students, the shares receiving institutional grant aid are 43 percent for those with an EFC of $0 and 46 percent for those with an EFC above $0.
- That is, the Integrated Postsecondary Education Data System (IPEDS).
- The data exports underlying this tool reflect undergraduate students, filtered for two characteristics: enrolled full-time and having applied for federal financial aid via the Free Application for Federal Student Aid (FAFSA). These two filters ensure that average aid amounts for a certain group are not skewed downward by students who enroll part-time and receive prorated aid amounts, and ensure that the shares of students receiving aid are not skewed downward by students who enrolled without applying financial aid. As a result, the visualizations make “apples-to-apples” comparisons: discrepancies in financial aid are attributable to the decisions of those overseeing program design and administration, not the decisions of the students. Our data tool also allows users to toggle a filter for in-state students on and off.
- The following are derived from TCF’s Financial Aid Distributions Tool, which uses data from the National Postsecondary Student Aid Study: 2019–20 via NCES Datalab. These queries reflect in-state students enrolled full-time who applied for federal aid. The NCES Datalab table retrieval codes are provided in the individual footnotes.
- Table retrieval code otqfia.
- Table retrieval code czvxuy.
- Table retrieval code ybymor.
- Table retrieval code lvqeve.
- Table retrieval code ybymor. Specifically, a Minnesota in-state public four-year student from the bottom quartile by income averages $3,236, versus $275 for the top quartile by income; and a Wisconsin in-state public four-year student from the bottom quartile by income averages $2,430, versus $165 for the top quartile by income.
- Steven Moity, “House Panel Subpoenas Harvard in Tuition-Pricing Inquiry,” The New York Times, June 26, 2025, https://www.nytimes.com/2025/06/26/us/politics/harvard-subpoena-house-judiciary.html; Hailey Fuchs, “House Judiciary Committee subpoenas Penn, Brown in price-fixing probe,” Politico, July 1, 2025, https://www.politico.com/live-updates/2025/07/01/congress/house-judiciary-penn-brown-00435108.