
The COVID-19 pandemic unleashed record levels of unemployment and unemployment claims, with 9.5 million Americans filing applications by the end of March alone, and millions more in the months that followed. With no end to the pandemic in sight, and a cutoff of nearly all federal unemployment benefits by year’s end looming on the horizon, inaction by Congress could mean that millions of American families will enter the New Year with little or no means of support.
Congress initially responded to this sudden wave of unemployment with an aggressive package of relief for jobless Americans, including a $600 Pandemic Unemployment Compensation (PUC) per week supplement for each benefit recipient through July 31, Pandemic Unemployment Assistance (PUA) for gig workers and others not eligible for regular benefits, as well as 100 percent federal funding for benefits for the long-term unemployed through Pandemic Emergency Unemployment Compensation (PEUC) and Extended Benefits (EB). As many as 40 million Americans (one in four workers) received a payment from one of these programs.1 Ever since the $600 per week PUC benefit expired at the end of July, the debate in Congress and attention among the media mostly focused on the value of this benefit rather than the expirations of other unemployment benefits. Under the terms of the CARES Act, both PEUC and full federal funding for EB benefits will expire on December 26, 2020. This report details the high stakes of this looming cutoff that will threaten the last economic lifeline for millions of American families.
Based on the number of people already on federal and state benefits, we estimate that 12 million workers will be on one of the two main CARES Act programs—PUA and PEUC—when funding expires on December 26. This cutoff threatens to pull the rug out from under an economy that has already seen millions of workers lose their state unemployment benefits this fall. Most workers began collecting state unemployment benefits in March or April, and since these benefits typically max out at twenty-six weeks, these workers’ benefits are already coming to an end. Three million workers already ran out of state jobless benefits in September, and based on these trends, more than 4 million more workers likely ran out by the end of October (official tallies are not released until November 20). Long-term unemployment surged in October, with the share of all jobless workers out of work for twenty-six weeks or more shot up from 19.1 percent to 32.5 percent.2 As the pandemic recession grinds on, Black workers and communities of color are at particularly high risk. While white workers were laid off at higher numbers than usual at the start of the pandemic, the share of unemployment insurance (UI) claimants who were Black soared by 40 percent from April to September—just as the benefits began to be cut off.3 The consequences of the cutoff of benefits at the end of December will be severe for these families:
- An estimated 7.3 million workers will see their PUA benefits expire on December 26, and 945,000 will run out of PUA before December. PUA benefits are only payable through December 26, and last thirty-nine weeks in all states and forty-six weeks in a subset of high unemployment states (Alaska, California, Connecticut, Delaware, District of Columbia, Illinois, Michigan, Nevada, New Jersey, New York, Ohio, Oregon, Rhode Island and Washington). PUA eligibility started the week ending February 9, but most eligible for PUA lost employment in March and will be reaching the end of their benefits at the end of December.
- An estimated 4.6 million workers will see their PEUC benefits prematurely expire on December 26. Moreover, an additional 3.5 million will have already run out of PEUC benefits before the December 26 cutoff.4 (PEUC provides thirteen additional weeks of benefits to only those running out of state benefits; workers receiving PUA are not eligible.)
- Only 2.9 million of those running out of PEUC will be able to collect EB in 2021—but states will have to pick up half of the cost at a time when their trust funds are depleted. Those workers running out of PEUC benefits can claim EB benefits, a program first authorized in 1970 that provides between six and twenty weeks of benefits, depending on the state’s unemployment rate and law. State law provisions are frequently tied to federal funding and the percent of workers collecting regular state benefits.
- A total of more than 16 million workers will have lost CARES Act benefits by the end of the year. In addition to the 12 million workers who will see their CARES Act benefits expire on December 26, an estimated 4.4 million workers will have already exhausted CARES Act benefits before this cutoff—and all of these workers will be heading into 2021 with little or no aid available to them.
The past few months have seen a steady economic recovery, but the economy is still short 10.1 million jobs as compared to before the pandemic.5 Despite exciting progress toward a COVID-19 vaccine, the pandemic is currently spreading exponentially across the United States and will continue to hamper the economic recovery. There are simply not enough jobs being created to support all of the workers running out of aid before the end of 2020. Without unemployment benefits and with savings badly depleted, families will be at high risk for food insecurity and loss of their homes, and many may be unable to pay for health care during some of the darkest days of the pandemic. The nation’s entire economy will suffer. While there are major political challenges to reaching a stimulus relief deal before the holidays, jobless workers cannot wait until January. The stakes are simply too high.
Who Will Lose Benefits at the CARES Act Cutoff on December 26, 2020?
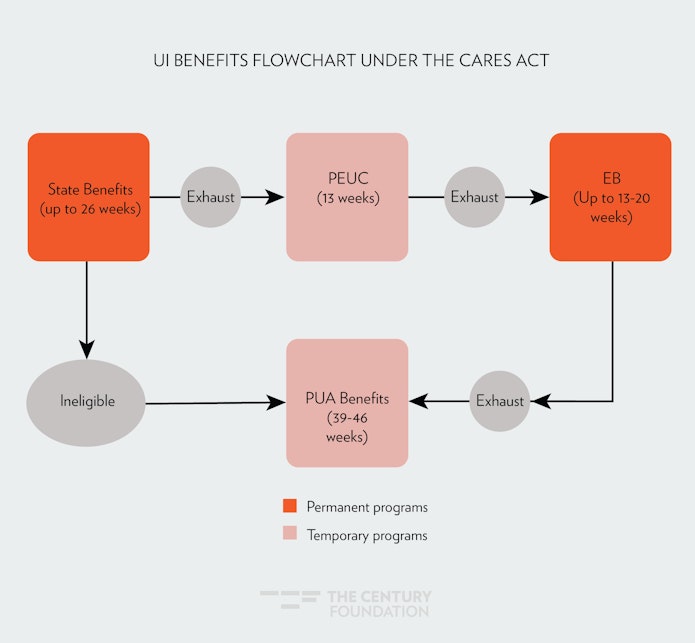
Workers rendered jobless during the pandemic accessed various unemployment benefits through a system of state and federal programs, some of which were created specially to respond to the pandemic. Figure 1 illustrates the interactions between these critical programs for jobless workers (which are explained in detail in the next section of the report). The path that jobless workers face to access these benefits is as follows:
- The first line of defense for workers is state unemployment benefits, typically up to twenty-six weeks, but as few as twelve weeks in some situations and up to thirty in others.6
- If a worker exhausts these benefits, they can get thirteen weeks of PEUC.
- For those not eligible for state benefits in the first place, the PUA program is available. However, those on PUA cannot then transfer to either PEUC or EB benefits.
- EB is a permanent program that is only available in a legally defined high-unemployment state. After PEUC is exhausted, workers can go on to the EB program, but those on PUA cannot.
- In states such as Florida that have very short durations of benefits, workers who are still unemployed after receiving state benefits, PEUC, and EB (which would amount to thirty-one weeks in Florida) could apply for the PUA program.7
Figure 1
One particularly problematic aspect of the CARES Act was the inclusion of a hard cutoff of benefits. Individuals who have received less than thirteen weeks of PEUC or less than thirty-nine weeks of PUA won’t be able to draw down that full set of weeks,8 but would instead see their benefit payments halt before their full benefit is exhausted. Previous laws, such as the American Recovery and Reinvestment Act of 2009, had a soft cutoff, which allowed individuals already receiving benefits to continue doing so until their full term was exhausted, but stopped any additional workers from qualifying. The important difference here is that a soft cutoff creates a gentle downward slope for workers and the economy, while a hard cutoff creates a cliff.
Using data from the number of workers that accessed state UI programs earlier in 2020, and the rate of exhaustion in different states, we are able to estimate the number of workers who will still be on PEUC benefits as of December 26. As a matter of reference, 22.8 million workers entered into the state UI programs during the period from March to June 2020, and in all cases these workers would not have benefit entitlements past December 2020. A large number of layoffs were temporary, and many workers have been called back to work or found other jobs. A record 3 million workers exhausted state jobless benefits in the month of September alone. By the end of September, the number of workers continuing to claim state UI benefits had dropped to 10.8 million. Based on current trends, our model estimates that another 7 million workers will exhaust their state jobless benefits in the fourth quarter alone.
PUA is a more straightforward proposition, as those who entered the program can largely collect continuously through December, but the data has been less accurate. Unpublished Department of Labor data indicate just over 13.4 million unique individuals received PUA benefits through September 2020, but the continued claims for PUA benefits had dropped to 9.3 million workers by October 17. This sharp drop reflects not only workers finding jobs but also potentially some misreporting earlier in the pandemic.9
Table 1 illustrates the number of workers who are likely to be still receiving PEUC or PUA benefits and thus face a hard cutoff of benefits on December 26. These amounts break down as follows:
- Pandemic Emergency Unemployment Compensation (PEUC). We estimate that 4.65 million workers will still be in active PEUC benefit status as of December 26. Overall, just over 70 percent of state benefit exhaustees have made it onto PEUC benefits; Table 1 assumes this trend will continue and also bakes into the findings that some will find work before Christmas. Nonetheless, this is an extremely high number of workers being cut off of a federal extension program in a single week. As a point of comparison, 1.3 million workers were left in the lurch the last time Congress let emergency aid benefits expire at the end of 2013.10 The largest share of affected workers are in California (1.3 million), Texas (464,000), and New York (365,000), but several other states are projected to have more than 150,000 workers on PEUC facing a cutoff (Georgia, Illinois, Massachusetts, Michigan, and Pennsylvania).
- Pandemic Unemployment Assistance (PUA). While a significant share of PUA recipients will exhaust their PUA benefits (or find work) before the end of December, PUA claims are still likely to be extremely high at the end of December. We estimate that 7.3 million workers will be on PUA at the end of December, and thus lose what is likely to be their only income source. More than 1 million workers in California and New York each could see their benefits cut off, as well as more than 300,000 each in Massachusetts, Michigan, Ohio, Pennsylvania, and Texas.
- Extended Benefits (EB). Only eighteen states are projected to still have the EB program in place at the end of December, leaving many workers without additional income support after PEUC expires. These states are Alaska, California, Connecticut, District of Columbia, Georgia, Hawaii, Illinois, Louisiana, Massachusetts, Nevada, New Jersey, New Mexico, New York, North Carolina, Oregon, Pennsylvania, Rhode Island, and Washington. The loss of temporary 100 percent funding in the CARES Act for EB will cost workers in several states that have tied their state EB law to federal funding and will restrict the program back to 1980s levels: this includes states such as Kentucky and Delaware, as well as many other states where the insured unemployment rate (IUR) has dropped as workers cycle off of state UI. Of those who are predicted to have their PEUC benefits cut off on December 26, 2.9 million are expected to continue on EB. However, the states will have to contribute 50 percent of the costs of these benefits—a major financial stress at the time when state unemployment funds (and state budgets) are in distress due to the pandemic and decline in tax revenues.
Map 1. Workers Subject to Immediate December 26 Cutoff of CARES Act Benefits

Table 1
|
Workers Subject to Immediate December 26 Cutoff of CARES Act Benefits |
|||||
| State | On PEUC | On PUA | Total | May Remain on EB | Net |
| Alabama | 9,413 | 36,115 | 45,528 | 45,528 | |
| Alaska | 10,682 | 8,326 | 19,008 | 10,682 | 8,326 |
| Arizona | 64,191 | 167,651 | 231,842 | 231,842 | |
| Arkansas | 23,247 | 43,581 | 66,828 | 66,828 | |
| California | 1,259,193 | 1,612,317 | 2,871,510 | 1,259,193 | 1,612,317 |
| Colorado | 77,288 | 44,904 | 122,192 | 122,192 | |
| Connecticut | 42,174 | 29,824 | 71,998 | 42,174 | 29,824 |
| Delaware | 9,208 | 5,641 | 14,849 | 14,849 | |
| District of Columbia | 15,508 | 9,186 | 24,694 | 15,508 | 9,186 |
| Florida | 129,778 | 294,199 | 423,977 | 423,977 | |
| Georgia | 183,648 | 146,674 | 330,322 | 183,648 | 146,674 |
| Hawaii | 34,371 | 59,989 | 94,360 | 34,371 | 59,989 |
| Idaho | 5,090 | 6,063 | 11,154 | 11,154 | |
| Illinois | 152,500 | 122,857 | 275,357 | 152,500 | 122,857 |
| Indiana | 53,967 | 112,869 | 166,835 | 166,835 | |
| Iowa | 26,893 | 9,741 | 36,634 | 36,634 | |
| Kansas | 19,215 | 49,555 | 68,770 | 68,770 | |
| Kentucky | 53,924 | 33,763 | 87,688 | 87,688 | |
| Louisiana | 58,307 | 90,789 | 149,096 | 58,307 | 90,789 |
| Maine | 13,908 | 11,158 | 25,066 | 25,066 | |
| Maryland | 65,260 | 126,224 | 191,485 | 191,485 | |
| Massachusetts | 162,215 | 314,369 | 476,584 | 162,215 | 314,369 |
| Michigan | 189,644 | 346,074 | 535,718 | 535,718 | |
| Minnesota | 61,390 | 24,736 | 86,126 | 86,126 | |
| Mississippi | 26,161 | 17,744 | 43,905 | 43,905 | |
| Missouri | 44,404 | 27,744 | 72,148 | 72,148 | |
| Montana | 7,789 | 19,711 | 27,500 | 27,500 | |
| Nebraska | 8,883 | 9,275 | 18,158 | 18,158 | |
| Nevada | 96,896 | 105,210 | 202,107 | 96,896 | 105,210 |
| New Hampshire | 10,725 | 8,803 | 19,528 | 19,528 | |
| New Jersey | 122,254 | 298,274 | 420,529 | 122,254 | 298,274 |
| New Mexico | 28,537 | 22,957 | 51,494 | 28,537 | 22,957 |
| New York | 365,774 | 1,126,393 | 1,492,167 | 365,774 | 1,126,393 |
| North Carolina | 46,511 | 95,535 | 142,046 | 46,511 | 95,535 |
| North Dakota | 7,557 | 5,391 | 12,947 | 12,947 | |
| Ohio | 58,535 | 429,864 | 488,399 | 488,399 | |
| Oklahoma | 51,275 | 24,460 | 75,735 | 75,735 | |
| Oregon | 45,671 | 67,866 | 113,537 | 45,671 | 67,866 |
| Pennsylvania | 152,139 | 479,740 | 631,880 | 152,139 | 479,740 |
| Puerto Rico | 54,305 | 150,143 | 204,448 | 204,448 | |
| Rhode Island | 14,764 | 46,010 | 60,773 | 14,764 | 46,010 |
| South Carolina | 36,878 | 40,209 | 77,087 | 77,087 | |
| South Dakota | 3,384 | 959 | 4,344 | 4,344 | |
| Tennessee | 63,295 | 53,253 | 116,548 | 116,548 | |
| Texas | 464,456 | 311,176 | 775,633 | 775,633 | |
| Utah | 11,017 | 4,380 | 15,397 | 15,397 | |
| Vermont | 6,923 | 4,950 | 11,873 | 11,873 | |
| Virgin Islands | 1,595 | 816 | 2,411 | 2,411 | |
| Virginia | 64,702 | 132,574 | 197,276 | 197,276 | |
| Washington | 81,160 | 88,398 | 169,557 | 81,160 | 88,398 |
| West Virginia | 17,753 | 29,554 | 47,307 | 47,307 | |
| Wisconsin | 27,647 | 29,121 | 56,767 | 56,767 | |
| Wyoming | 4,041 | 2,027 | 6,069 | 6,069 | |
| US Total | 4,646,048 | 7,339,145 | 11,985,193 | 2,872,304 | 9,112,889 |
|
Source: Author’s analysis of Department of Labor data. |
|||||
As extreme as the figures above are, they underestimate the problem. Many more workers will have depleted their CARES Act benefits even before the December 26 deadline, especially when it comes those who were laid off in the earliest stages of the current economic crisis. As a matter of perspective, there were 2.8 million workers on PEUC benefits as of September 26, and these individuals will have utilized the full thirteen weeks of PEUC even before the cutoff.11 Based on exhaustions of PEUC and PUA already, and projections going forward, Table 2 outlines the state-by-state breakdown of exhaustions even before December 26. We estimate that 4.4 million workers will exhaust CARES Act benefits before December 26: 3.5 million from PEUC and 950,000 from PUA. (Notably, in Table 2, some states show PUA exhaustions before December 26 as the forty-six week PUA benefits in high unemployment states should carry all recipients to the deadline.) Some of these workers may still have EB eligibility going into January, but in states with shorter durations, such as North Carolina, workers will have likely already exhausted EB benefits even before the end of the year. For this reason, the latest stimulus package passed by the House of Representatives includes a new extension entitled Pandemic Emergency Unemployment Extension Compensation that would provide another thirteen weeks to those who exhausted either PEUC or PUA benefits.12
Table 2
| Workers Exhausting CARES Act Benefits before December 26, 2020 | |||
| State | PEUC | PUA | Total |
| Alabama | 65,620 | 7,363 | 72,983 |
| Alaska | 6,356 | 0 | 6,356 |
| Arizona | 22,210 | 40,453 | 62,663 |
| Arkansas | 21,610 | 11,844 | 33,454 |
| California | 689,773 | 0 | 689,773 |
| Colorado | 27,754 | 12,045 | 39,800 |
| Connecticut | 30,169 | 0 | 30,169 |
| Delaware | 5,716 | 0 | 5,716 |
| District of Columbia | 8,020 | 2,883 | 10,903 |
| Florida | 462,737 | 61,575 | 524,312 |
| Georgia | 41,308 | 45,096 | 86,405 |
| Hawaii | 8,885 | 17,676 | 26,561 |
| Idaho | 6,983 | 2,000 | 8,983 |
| Illinois | 67,101 | 0 | 67,101 |
| Indiana | 23,209 | 27,376 | 50,585 |
| Iowa | 27,024 | 2,316 | 29,339 |
| Kansas | 17,068 | 11,217 | 28,285 |
| Kentucky | 6,584 | 7,655 | 14,239 |
| Louisiana | 7,717 | 23,525 | 31,242 |
| Maine | 11,365 | 3,157 | 14,522 |
| Maryland | 17,702 | 39,149 | 56,851 |
| Massachusetts | 104,272 | 93,754 | 198,026 |
| Michigan | 96,476 | 104,595 | 201,072 |
| Minnesota | 57,769 | 8,242 | 66,011 |
| Mississippi | 19,358 | 5,113 | 24,471 |
| Missouri | 33,790 | 9,033 | 42,823 |
| Montana | 5,973 | 5,587 | 11,560 |
| Nebraska | 3,570 | 2,006 | 5,577 |
| Nevada | 43,700 | 0 | 43,700 |
| New Hampshire | 1,665 | 2,650 | 4,314 |
| New Jersey | 116,003 | 0 | 116,003 |
| New Mexico | 12,965 | 6,541 | 19,506 |
| New York | 379,935 | 0 | 379,935 |
| North Carolina | 198,868 | 22,277 | 221,145 |
| North Dakota | 6,348 | 1,105 | 7,453 |
| Ohio | 47,136 | 0 | 47,136 |
| Oklahoma | 20,907 | 7,414 | 28,322 |
| Oregon | 33,023 | 0 | 33,023 |
| Pennsylvania | 94,036 | 141,452 | 235,488 |
| Puerto Rico | 24,107 | 38,471 | 62,578 |
| Rhode Island | 13,394 | 0 | 13,394 |
| South Carolina | 49,751 | 10,873 | 60,623 |
| South Dakota | 662 | 297 | 958 |
| Tennessee | 41,394 | 15,046 | 56,439 |
| Texas | 336,927 | 98,654 | 435,581 |
| Utah | 10,972 | 803 | 11,775 |
| Vermont | 4,085 | 1,587 | 5,672 |
| Virgin Islands | 690 | 188 | 878 |
| Virginia | 72,192 | 40,091 | 112,283 |
| Washington | 29,133 | 0 | 29,133 |
| West Virginia | 7,369 | 6,560 | 13,928 |
| Wisconsin | 30,136 | 7,590 | 37,726 |
| Wyoming | 2,209 | 341 | 2,550 |
| US Total | 3,473,723 | 945,600 | 4,419,324 |
| Source: Author’s analysis of Department of Labor data. | |||
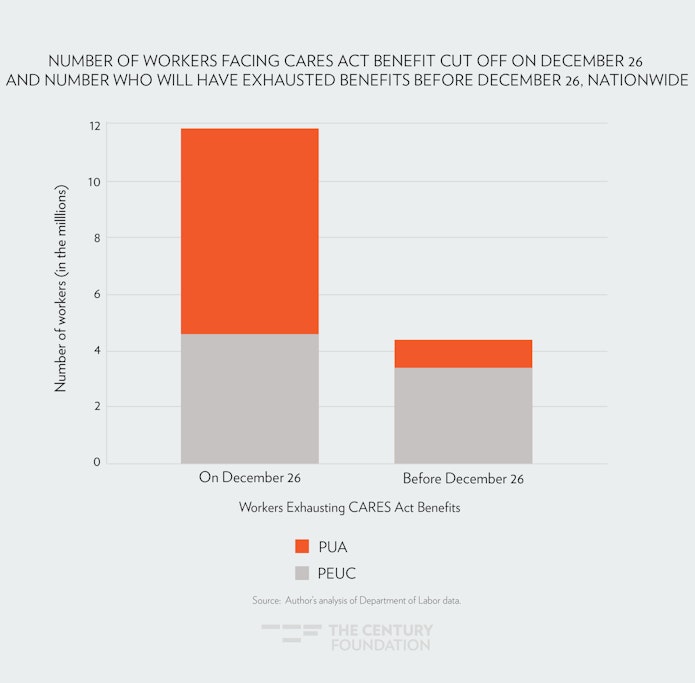
Figure 2 illustrates how large an impact the December 26 cutoff of CARES Act benefits will have nationwide, relative to the number of workers who had exhausted their benefits before the cutoff. Twelve million workers will be summarily dismissed from the unemployment rolls on December 26, 2020; before that, only 5.4 million workers had exhausted their CARES Act payments.
FIGURE 2
How the Programs Expiring on December 26, 2020 Work
There are multiple benefit programs created by the CARES Act that will be expiring on December 26, 2020.13 The key provisions are outlined below.
Pandemic Emergency Unemployment Compensation (PEUC)
- Who is eligible. PEUC benefits are payable to any individual who has received but has exhausted all of their regular state benefits (which have a maximum of between twelve and thirty weeks, depending on the state). While the program has “pandemic” in the title, benefits are payable regardless of whether job loss can be attributed directly to COVID-19. Each eligible worker can receive up to thirteen weeks of PEUC benefits (no matter the length of their state benefits), payable at the same amount they qualified for on regular UI.14
- Key dates. PEUC benefits are payable to any workers who exhausted their state benefits after July 1, 2019, and are payable for weeks of unemployment after April 4, 2020. However, no weeks of PEUC benefits can be paid after the week ending December 26. Thus even if a worker has ten weeks remaining in their benefit account as of December, they are subject to a hard cutoff of their PEUC payments.
- Take Up of Benefits. While all individuals exhausting state benefits are eligible for PEUC benefits, it is not automatic. States are required to provide all individuals exhausting regular UI with written notification of their eligibility.15 But this Department of Labor guidance also requires workers to “file an application for PEUC benefits.”16 States have struggled to process the extremely high number of PEUC claims and multiple CARES Act programs, and PEUC (the last to be implemented) is no exception. By the end of September, 5.8 million workers had exhausted their state unemployment benefits during the pandemic, but only 3.8 million were collecting PEUC benefits. Table 3 displays state-by-state take up, comparing the number of workers enduring state UI exhaustion to the number of workers filing for PEUC. While the national average is nearly 66 percent, the PEUC take up is lower for many states such as Texas and Washington. For example, workers in Texas report as long as a month delay between filing and receiving PEUC benefits.17 Some states are greater than 100 percent because some workers exhausting benefits before March or in the first few weeks of October may already be on PEUC.
Map 2. PEUC Take Up

Table 3
| Workers Exhausting State UI Benefits versus Workers Entering PEUC, by State, as of September 2020 | |||
| State | State Exhaustions: March–September | PEUC Continued Claims October 10, 2020 | Take Up |
| Alabama | 137,247 | 52,661 | 38.4% |
| Alaska | 15,613 | 8,654 | 55.4% |
| Arizona | 25,453 | 37,909 | 148.9% |
| Arkansas | 53,330 | 19,378 | 36.3% |
| California | 1,308,243 | 992,254 | 75.8% |
| Colorado | 79,325 | 49,759 | 62.7% |
| Connecticut | 66,703 | 43,443 | 65.1% |
| Delaware | 11,479 | 10,487 | 91.4% |
| District of Columbia | 23,386 | 16,623 | 71.1% |
| Florida | 131,568 | 120,422 | 91.5% |
| Georgia | 124,741 | 9,177 | 7.4% |
| Hawaii | 30,768 | 24,244 | 78.8% |
| Idaho | 20,981 | 5,976 | 28.5% |
| Illinois | 165,688 | 150,021 | 90.5% |
| Indiana | 38,267 | 39,113 | 102.2% |
| Iowa | 47,835 | 25,092 | 52.5% |
| Kansas | 32,601 | 21,036 | 64.5% |
| Kentucky | 35,758 | 2,416 | 6.8% |
| Louisiana | 53,289 | 17,435 | 32.7% |
| Maine | 22,037 | 13,822 | 62.7% |
| Maryland | 60,213 | 38,140 | 63.3% |
| Massachusetts | 171,395 | 140,556 | 82.0% |
| Michigan | 162,847 | 180,342 | 110.7% |
| Minnesota | 115,556 | 68,327 | 59.1% |
| Mississippi | 35,743 | 16,007 | 44.8% |
| Missouri | 82,370 | 48,107 | 58.4% |
| Montana | 13,483 | 4,901 | 36.3% |
| Nebraska | 11,798 | 3,697 | 31.3% |
| Nevada | 99,305 | 75,042 | 75.6% |
| New Hampshire | 6,354 | 4,012 | 63.1% |
| New Jersey | 187,021 | 148,516 | 79.4% |
| New Mexico | 27,479 | 22,361 | 81.4% |
| New York | 542,291 | 600,921 | 110.8% |
| North Carolina | 372,720 | 135,312 | 36.3% |
| North Dakota | 14,915 | 5,503 | 36.9% |
| Ohio | 82,757 | 78,608 | 95.0% |
| Oklahoma | 45,252 | 24,215 | 53.5% |
| Oregon | 41,688 | 42,518 | 102.0% |
| Pennsylvania | 178,312 | 160,796 | 90.2% |
| Puerto Rico | 72,436 | 17,780 | 24.5% |
| Rhode Island | 26,519 | 18,381 | 69.3% |
| South Carolina | 98,164 | 70,088 | 71.4% |
| South Dakota | 2014 | 581 | 28.8% |
| Tennessee | 109,244 | 49,239 | 45.1% |
| Texas | 430,128 | 24,969 | 5.8% |
| Utah | 25,407 | 8,930 | 35.1% |
| Vermont | 9,090 | 7,715 | 84.9% |
| Virgin Islands | 1955 | 21 | 1.1% |
| Virginia | 163,854 | 86,841 | 53.0% |
| Washington | 108,802 | 5,914 | 5.4% |
| West Virginia | 22,523 | 14,308 | 63.5% |
| Wisconsin | 44,983 | 50,359 | 112.0% |
| Wyoming | 5,139 | 2,582 | 50.2% |
| National | 5,796,069 | 3,815,511 | 65.8% |
| Source: Author’s analysis of Department of Labor data. | |||
Federal–State Extended Benefits (EB)
- Who is eligible. The Extended Benefits program is a permanently authorized extension capped at thirteen to twenty weeks, and available to workers who run out of their benefits when their state is experiencing a period of high unemployment.18 (Unlike PEUC, the EB entitlement is capped at half of the total weeks of regular UI a worker is qualified for. Thus, if a worker qualifies for twelve weeks of regular UI, they only get six weeks of EB tier 1.)19 The CARES Act stipulates that workers exhausting state benefits must defer their EB eligibility until after they exhaust their PEUC benefits.20 In other words, EB comes after PEUC. On a standard basis, 50 percent of these benefits would be paid for by state trust funds and 50 percent by the federal government, but the CARES Act provided for 100 percent federal funding through December 26. Moreover, the EB program won’t be lasting long, because it is principally tied to the insured unemployment rate (IUR), which is on the decline even in those states that meet the law’s thresholds.
- Triggers. After reforms in the 1980s, the rules for a state triggering extended benefits became very narrow, to the point of neutering the program’s effectiveness.21 States only automatically trigger if the equivalent of 5 percent of the state’s workforce is receiving state UI. This is a high bar that has not been reached at the national level since 1983.22 Unhelpfully, the IUR declines as workers run out of their state benefits, reducing access to additional benefits just when they are needed the most.23 The law does give states an optional trigger to pay thirteen weeks of benefits when the total unemployment rate (TUR) reaches 6.5 percent over a three-month period (seasonally adjusted) and an additional seven weeks in high unemployment benefits when that rate is 8 percent (in each case, the rate must be 10 percent higher than the same period in one of the prior two years).24 However, only eleven states (Alaska, Connecticut, Kansas, Minnesota, New Hampshire, New Jersey, North Carolina, Rhode Island, Vermont, Oregon and Washington) have the TUR trigger under permanent law.25 An additional twelve states, including some of the largest in the country (California, Delaware, District of Columbia, Georgia, Illinois, Kentucky, Michigan, New York, Nevada, Ohio, South Carolina, and Texas) have provisions that only utilize the TUR trigger when 100 percent federal funding is available.26
- Take Up and Cycle Off. As of the week ending October 24, there were only 551,000 workers claiming extended benefits. The program will have limited utility leading up to and after December. While forty-eight states were triggered onto EB as of August 15, fifteen states triggered off between August 22 and November 14. We project that an additional fifteen states will trigger off by the end of December, leaving just eighteen states triggered on when PEUC expires. (See Table 4 for projected end of year status.) While there is a three-week grace period between the time that the relevant level falls below the trigger status and workers’ benefits are cut off, it is a hard cutoff that can take effect before a worker receives the state’s maximum EB weeks.
Table 4
|
End of Year Extended Benefits Status |
||||
| State | Triggered “ON” for EB as of 12/26 | 5% IUR | 6% IUR | 6.5% TUR |
| Alabama | ||||
| Alaska | Yes | ✔ | ✔ | |
| Arizona | ||||
| Arkansas | ||||
| California | Yes | ✔ | ✔ | |
| Colorado | ||||
| Connecticut | Yes | ✔ | ✔ | |
| Delaware | ||||
| District of Columbia | Yes | ✔ | ✔ | |
| Florida | ||||
| Georgia | Yes | ✔ | ||
| Hawaii | Yes | ✔ | ||
| Idaho | ||||
| Illinois | Yes | ✔ | ||
| Indiana | ||||
| Iowa | ||||
| Kansas | ||||
| Kentucky | ||||
| Louisiana | Yes | ✔ | ||
| Maine | ||||
| Maryland | ||||
| Massachusetts | Yes | ✔ | ||
| Michigan | ||||
| Minnesota | ||||
| Mississippi | ||||
| Missouri | ||||
| Montana | ||||
| Nebraska | ||||
| Nevada | Yes | ✔ | ✔ | |
| New Hampshire | ||||
| New Jersey | Yes | ✔ | ||
| New Mexico | Yes | ✔ | ✔ | |
| New York | Yes | ✔ | ||
| North Carolina | Yes | ✔ | ||
| North Dakota | ||||
| Ohio | ||||
| Oklahoma | ||||
| Oregon | Yes | ✔ | ||
| Pennsylvania | Yes | ✔ | ||
| Rhode Island | Yes | ✔ | ||
| South Carolina | ||||
| South Dakota | ||||
| Tennessee | ||||
| Texas | ||||
| Utah | ||||
| Vermont | ||||
| Virgin Islands | ||||
| Virginia | ||||
| Washington | Yes | |||
| West Virginia | ||||
| Wisconsin | ||||
| Wyoming | ||||
| US Total | ||||
| Source: Author’s analysis of Department of Labor data. | ||||
Pandemic Unemployment Assistance (PUA)
- Who is eligible. PUA benefits are payable to a wide range of workers who are not eligible for regular UI but still are displaced by the pandemic, including the self-employed, part-time workers, and those forced out of work by a COVID-19 infection or the lack of child care. In addition, those that exhaust state benefits, PEUC, and EB without finding a job can collect PUA.
- Timeline. All workers can claim thirty-nine weeks of benefits starting the week February 9, and forty-six weeks for those who are in a high unemployment period under EB through the optional TUR trigger and a state unemployment rate of 8 percent. (As of November 1, this includes Alaska, California, Connecticut, Delaware, Illinois, Nevada, New Jersey, New York, Ohio, Oregon, Rhode Island, and Washington.) PUA recipients in these states will receive benefits continuously through December 26, as will workers who began collecting in March after COVID-19 lockdowns caused many to lose work. Regardless, any workers with PUA benefits remaining in their account cannot claim benefits after the week ending December 26. In other words, someone starting PUA starting the week ending September 7 would collect fifteen weeks of PUA through December 26, but would miss out on twenty-four weeks of benefits spelled out as the standard entitlement.
The Urgent Need for Action
The stakes of the expiration of jobless benefits are high, starting first and foremost with the major consequences of long-term unemployment. Involuntary job loss has harmful effects on the outcomes of workers, and these effects are intensified when jobless spells are longer than six months. Long-term unemployment can have detrimental effects on workers’ future work opportunities, financial well-being, and health. As joblessness spells drag on, workers’ skills erode, they become discouraged, and they’re more likely to face discrimination by potential employers.27 Not only are the long-term unemployed more likely to face subsequent periods of unemployment,28 they face the risk of dropping out of the labor force indefinitely.29 The longer a bout of unemployment stretches on, the changes of finding a job dwindles and workers are more likely to receive—and accept—offers for wages lower than that of their previous job.30 The length to re-employment and negative wage effects are magnified when macroeconomic conditions are weak.31
There is a documented effect of long-term unemployment on household stability. Workers who are unemployed for substantial periods of time lower their consumption,32 draw down savings to make ends meet,33 and increase borrowing.34 A 2010 survey indicates that 24 percent of workers facing prolonged unemployment had missed a mortgage or rent payment, while other research has found that one in ten unemployed people had declared personal bankruptcy.35 In addition to effects on financial stability, long-term unemployment negatively impacts mental and physical health. Workers who are out of work for more than six months face increased rates of depression and anxiety36 and greater incidence of suicide.37 They are more likely to skip dental visits and delay necessary medical care, and less likely to refill prescriptions.38 They also face increases in mortality, which researchers have argued is potentially driven by income loss, risky health behavior, and/or loss of employer-sponsored health insurance.39 These damaging impacts of long-term unemployment are exacerbated by the loss of income support when workers exhaust their unemployment benefits. For this reason, Congress has historically provided federal support for extended benefits when large numbers of Americans are facing long-term unemployment and keeps these benefits in place until well into a cycle of recovery.40
Prolonged unemployment is more typical and more harmful for Black workers. In times of economic downturn, Black unemployment rates tend to spike earlier and recede more slowly than that of white workers.41 Between September 2018 and September 2019, when labor markets were much tighter than they are today, the average length of unemployment for Black jobless workers was 25.5 weeks—five weeks longer than for their white peers.42 Black workers were 16 percent more likely than white workers to be unemployed for at least six months during the peak of the Great Recession.43 Because long-term unemployment has lasting negative effects on earnings and labor participation, racial wealth gaps will persist. Though they are more likely to be unemployed, Black workers are less likely to get unemployment benefits.44 Eligibility restrictions and inaccessible application processes have excluded Black workers from the UI system for decades,45 and the obstacles to moving between programs after exhausting state benefits only further impairs Black workers and widens racial economic gaps.
Extended jobless benefits are also a critical piece of the macroeconomic recovery. Unemployment insurance benefits have been proven over and over again to be one of the best dollar-for-dollar stimulus programs.46 Jobless pay takes the place of paychecks in the economy as dollars efficiently flow from workers into the pockets of local businesses struggling with the dimensions of the pandemic. The Economic Policy Institute estimated the July cutoff of the $600-per-week federal supplement to unemployment benefits may have shaved 5 million jobs off of the recovery.47 The hard cutoff of benefits for 9 million workers will shave off more than $2.5 billion in spending per week, and that gap will only grow as the limited coverage from EB also fades away.48
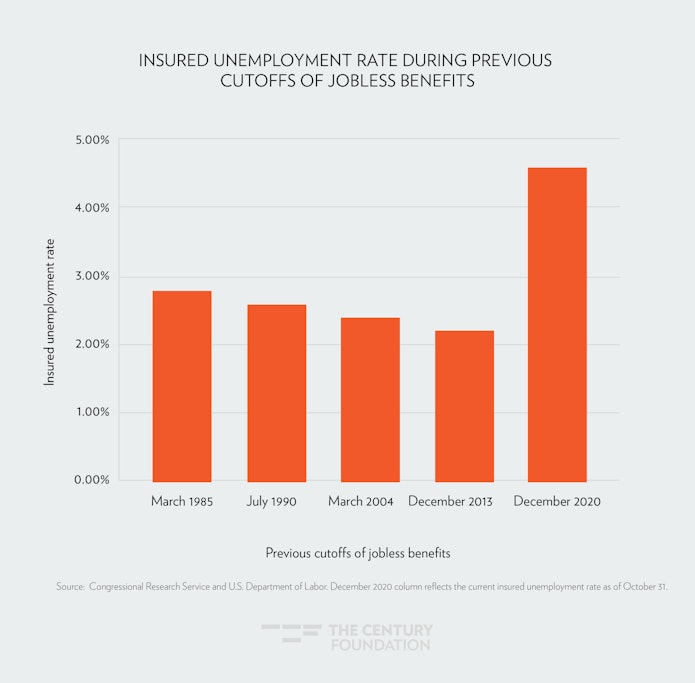
If benefits are cut off in December, it would be the earliest cutoff of extended benefits in any recent recession. In the previous four recessions, extended benefits were available to workers until at least three years after the start of the recession, recognizing the length of time needed to create jobs for all of those who had lost work during the downturn. In the July 1981 recession, extended benefits were available until March 1985; in the July 1990 recession, extensions kept going until February 1994; and even the mild 2001 recession included benefits through March 2004.49 During the Great Recession, up to ninety-nine weeks of benefits were available, and extensions were available to those who exhausted state benefits between December 2007 and December 2013. Critically, by this time, the share of workers on the core state benefits program had dropped substantially, to nearly half the current level, and thus the need for extended benefits had abated. Figure 3 compares the current insured unemployment rate to previous cut offs of extended benefits, and this stark difference indicates just how grave this early cut off would be to workers and the economy.
Figure 3
Conclusion
Congress has stared down major expirations of jobless benefits multiple times during the Great Recession and previous economic cycles. Policy makers have been more comfortable with enacting temporary extended benefits programs with more predictable costs rather than improving the automatic stabilizers in EB. The risk of such an approach, however, are huge cliffs like the one facing the nation on December 26. With the stakes of the benefit cutoff perhaps higher than they have ever been before, there also seems to be a grave danger that unemployed Americans could be left behind during a lame duck session taking place in the overhang of a contested presidential election. But the numbers—and families behind them—leave no excuses for inaction.
Appendix
Methodology
The estimates are based on reported data from states to the U.S. Department of Labor on first payments, continued claims and exhaustions for the different CARES Act programs. Using this data, the we conduct a flow analysis based on observed take up, exhaustion, and survival rates. Estimates are derived on the state level, with state exhaustion rates as a key metric (equal to the sum of exhaustions for the past twelve months divided by the sum of first payments for twelve months but with a starting period lagged by six months). Under this method, November exhaustions are projected as the exhaustion rate times the first payments for the month of May. September exhaustion rates were used but then corrected if current claims data indicate an earlier exhaustion rate is prevailing. Based on observed data, 72 percent of state exhaustions are predicted to enter into PEUC benefits during the same month they exhaust. Among those flowing onto PEUC benefits in the fourth quarter, 7 percent are predicted to leave the program each month for employment. Among those beginning PEUC before September, 70 percent of these claimants are estimated to exhaust PEUC benefits three months later (similar to the overall EUC exhaustion rate of 64 percent in 2010). Note for PEUC estimates, some states are not reporting continued claims (Florida, Georgia, and Kentucky). We use estimated values derived from their monthly disbursements for PEUC payments (ETA 2112). Thus our model predicts higher utilization of PEUC than the weekly data.
For the PUA program, month-to-month data is less accurate. Thus, the total number of first payments into the PUA program of 13.4 million was expected to produce 7.1 million exhaustions over a nine month program (a 50 percent nine-month exhaustion rate adjusted for the start times of PUA claimants). Applying this predicts that 76 percent of the 9.3 million on PUA as of October 17 would exhaust on or before December 26. This rate is used to create state-by-state estimates for those on PUA on December 26, who were already on PUA on October 17. In those states without a forty-six-week PUA program, 25 percent are assumed to have started before March 28 and thus exhaust before December 26. After October 17, initial claims into PUA for the rest of October and November are assumed to have a 50 percent payment rate before December 26.
To estimate the number of states that will trigger off by the end of December, rendering still-jobless workers when PEUC expires, ineligible for additional weeks when they exhaust their state weeks, we project the initial claims, state benefit exhaustions, re-employment rate, insured unemployment rate, and the total unemployment rate for each state the weeks between the weekly UI report released November 12, 2020.
To estimate initial claims, we take the three-week moving average of the change in total national initial claims and multiply that by the total national initial claims in the previous week. Then we take the ratio of state to national claims from the previous week and multiply it by the projected total claims of the current week. Based on our analysis of the adjusted exhaustion rate we estimate that 45 percent of workers will become re-employed within twenty-six weeks, so for our re-employment estimates, we estimate 3 percent of continuing claims are discontinued each week due to workers becoming re-employed. To project the insured unemployment rate, we take the sum of the continuing claims in the previous week and 25 percent of the initial claims in the previous week and subtract the estimated exhaustions and re-employed workers, then we divide that by the total covered employment in the state. To estimate the total unemployment rate, we follow the same method as we do for projecting initial claims.
Notes
- Anneken Tappe, “1 in 4 American workers have filed for unemployment benefits during the pandemic,” CNN, May 28, 2020, https://www.cnn.com/2020/05/28/economy/unemployment-benefits-coronavirus/index.html.
- “The Employment Situation—October 2020,” Bureau of Labor Statistics, November 6, 2020, https://www.bls.gov/news.release/pdf/empsit.pdf.
- Unemployment Insurance Data Explorer, The Century Foundation, accessed November 14, 2020, https://tcf-ui-data.shinyapps.io/ui-data-explorer/ (Share of UI claimants who were black increased from 15 percent in April to 21 percent in September).
- If not noted otherwise, data in this report comes from the author’s analysis of data publicly available at U.S. Department of Labor Employment and Training Administration.
- Ben White, “Trump’s celebrated economic rebound fizzles out,” Politico, October 2, 2020, https://www.politico.com/news/2020/10/02/september-jobs-numbers-unemployment-rate-425068.
- “Policy Basics: How Many Weeks of Unemployment Compensation Are Available?” Center on Budget Policies and Priorities, November 8, 2020, https://www.cbpp.org/research/economy/policy-basics-how-many-weeks-of-unemployment-compensation-are-available.
- In this case, the EB, PEUC, and state benefits would be deducted from the maximum PUA entitlement. See Section 2102(a)(3)(A)(i) of the CARES Act, The Coronavirus Aid, Relief, and Economic Security Act, 15 U.S. Code § 9021 (2020), https://www.law.cornell.edu/uscode/text/15/9021.
- The Coronavirus Aid, Relief, and Economic Security Act, 15 U.S. Code § 9025 (2020).
- Ben Casselman, Patricia Cohen, Conor Dougherty, and Nelson D. Schwartz, “A Lifeline to the Jobless Has Problems With Fraud, and With Math,” New York Times, September 11, 2020, https://www.nytimes.com/2020/09/11/business/economy/pandemic-unemployment-assistance-fraud.html.
- Brad Plumer, “Unemployment benefits for 1.3 million expire Saturday. Here’s why.” Washington Post, December 23, 2013, https://www.washingtonpost.com/news/wonk/wp/2013/12/20/unemployment-benefits-for-1-3-million-workers-expire-next-week-heres-what-you-should-know/.
- “Unemployment Insurance Weekly Claims News Release,” U.S. Department of Labor, October 15, 2020, https://www.dol.gov/sites/dolgov/files/OPA/newsreleases/ui-claims/20201958.pdf.
- U.S. Congress, House of Representatives, The Heroes Act, H.R. 6800, 116th Congress, 2nd session, introduced in House September 28, 2020, https://appropriations.house.gov/sites/democrats.appropriations.house.gov/files/SUPP_SEP_01_ALL_xml.2020.9.28.1753.pdf.
- The CARES Act provisions pay benefits through any week ending before December 31, and since UI is paid out in weeks, payments will go through December 26 in most states, and December 27 in New York. Assistant Secretary John Pallasch, “UNEMPLOYMENT INSURANCE PROGRAM LETTER No. 17-20,” U.S. Department of Labor Employment and Training Administration, April 10, 2020, https://wdr.doleta.gov/directives/corr_doc.cfm?DOCN=8452.
- “Attachment III to UIPL No. 17-20—Statutory Language of Title II, Subtitle A, Section 2107 of the Coronavirus Aid, Relief, and Economic Security (CARES) Act of 2020,” U.S. Department of Labor Employment and Training Administration, April 10, 2020, https://wdr.doleta.gov/directives/attach/UIPL/UIPL_17-20_Attachment_3.pdf.
- “Attachment I to UIPL No. 17-20—Implementing and Operating Instructions for the Pandemic Emergency Unemployment Compensation (PEUC) Program,” U.S. Department of Labor Employment and Training Administration, April 10, 2020,https://wdr.doleta.gov/directives/attach/UIPL/UIPL_17-20_Attachment_1.pdf.
- Ibid.
- “[TEXAS] Is PEUC available after the 26 weeks of unemployment?,” Reddit, accessed October 30, 2020, https://www.reddit.com/r/Unemployment/comments/javujx/texas_is_peuc_available_after_the_26_weeks_of/.
- “Federal–State Extended Benefits Act of 1970,” U.S. Department of Labor https://www.govinfo.gov/app/details/COMPS-2966
- 20 CFR § 615.7, https://www.law.cornell.edu/cfr/text/20/615.7.
- Assistant Secretary John Pallasch, “UNEMPLOYMENT INSURANCE PROGRAM LETTER No. 17-20,” U.S. Department of Labor, Employment and Training Administration, April 10, 2020, https://wdr.doleta.gov/directives/corr_doc.cfm?DOCN=8452.
- Julie M. Whittaker and Katelin P. Isaacs, “Extending Unemployment Compensation Benefits During Recessions, Congressional Research Service, October 1, 2014, https://crsreports.congress.gov/product/pdf/RL/RL34340
- “Unemployment Insurance Weekly Claims Data,” U.S. Department of Labor Employment and Training Administration, https://oui.doleta.gov/unemploy/claims.asp.
- Moreover, not only must the state IUR reach 5.0 percent, it must be 20 percent higher than the level during the past two years. “Background Paper on Extended Benefits:Restoring Our Unemployment Insurance Safety Net for Workers and Communities Impacted by Long Term Unemployment,” National Employment Law Project, March 2001, https://www.nelp.org/wp-content/uploads/2015/03/Background-Paper-on-The-Federal-Extended-Benefits.pdf.
- “Extended Benefits In The Federal-State Unemployment Compensation Program,” Code of Federal Regulation, Title 20 § 615.11 https://www.law.cornell.edu/cfr/text/20/615.11.
- “Comparison of State Unemployment Insurance Laws, 2019,” U.S. Department of Labor, https://oui.doleta.gov/unemploy/comparison/2010-2019/comparison2019.asp.
- “TRIGGER NOTICE NO. 2020 – 43,” U.S. Department of Labor, November 8, 2020, https://oui.doleta.gov/unemploy/trigger/2020/trig_110820.html.
- Alan B. Krueger, Judd Cramer, and David Cho, “Are the Long-Term Unemployed on the Margins of the Labor Market?” Brookings Institution, Spring 2014, https://www.brookings.edu/bpea-articles/are-the-long-term-unemployed-on-the-margins-of-the-labor-market/.
- Ann Huff Stevens, “Persistent Effects of Job Displacement: The Importance of Multiple Job Losses,” Journal of Labor Economics 15, no. 1 (1997): 165–88, http://www.jstor.org/stable/2535319.
- Kalman Rupp and David Stapleton, “Determinants of the Growth in the Social Security Administration’s
Disability Programs–An Overview,” Social Security Bulletin 58, no. 4 (1995): 43–70, https://www.ssa.gov/policy/docs/ssb/v58n4/v58n4p43.pdf; Austin Nichols, Josh Mitchell, and Stephan Lindner, “Consequences of Long-Term Unemployment,” Urban Institute, July 2013, https://www.urban.org/sites/default/files/publication/23921/412887-Consequences-of-Long-Term-Unemployment.PDF. - Josh Bivens, “Long-Term Unemployment Has Not Damaged the Productivity of Workers,” Economic Policy Institute, September 29, 2014, https://www.epi.org/publication/long-term-unemployment-scarring/; Daniel S. Hamermesh, “What Do We Know About Worker Displacement in the U.S.?,” Industrial Relations: A Journal of Economy and Society 28 (1989): 51–59, https://doi.org/10.1111/j.1468-232X.1989.tb00722; Austin Nichols, Josh Mitchell, and Stephan Lindner, “Consequences of Long-Term Unemployment,” Urban Institute, July 2013, https://www.urban.org/sites/default/files/publication/23921/412887-Consequences-of-Long-Term-Unemployment.PDF.
- Steven J. Davis and Till von Wachter, “Recessions and the Costs of Job Loss,” Brookings Institution, Fall 2011, https://www.brookings.edu/wp-content/uploads/2011/09/2011b_bpea_davis.pdf.
- Peter Ganong and Pascal Noel, “Consumer Spending during Unemployment: Positive and Normative Implications,” American Economic Review 109, no. 7 (July 2019): 2383–424, https://pubs.aeaweb.org/doi/pdfplus/10.1257/aer.20170537.
- Debbie Borie-Holtz, Carl Van Horn, and Cliff Zukin, “No End in Sight: The Agony of Prolonged Unemployment,” John J. Heldrich Center for Workforce Development at Rutgers University, May 2010, https://www.heldrich.rutgers.edu/sites/default/files/products/uploads/Work_Trends_May_2010_0.pdf.
- Debbie Borie-Holtz, Carl Van Horn, and Cliff Zukin, “No End in Sight: The Agony of Prolonged Unemployment,” John J. Heldrich Center for Workforce Development at Rutgers University, May 2010, https://www.heldrich.rutgers.edu/sites/default/files/products/uploads/Work_Trends_May_2010_0.pdf; James X. Sullivan, “Borrowing During Unemployment,” Journal of Human Resources 43 (2008): 383–412, http://jhr.uwpress.org/content/43/2/383.
- Debbie Borie-Holtz, Carl Van Horn, and Cliff Zukin, “No End in Sight: The Agony of Prolonged Unemployment,” John J. Heldrich Center for Workforce Development at Rutgers University, May 2010, https://www.heldrich.rutgers.edu/sites/default/files/products/uploads/Work_Trends_May_2010_0.pdf; Jessica Godofsky, Carl Van Horn, and Cliff Zukin, “American Workers Assess an Economic Disaster,” John J. Heldrich Center for Workforce Development at Rutgers University, September 2010, https://core.ac.uk/download/pdf/71345136.pdf.
- Katja Kokko, Lea Pulkkinen, and Minna Puustinen, “Selection into Long-Term Unemployment and Its Psychological Consequences,” International Journal of Behavioral Development 24, no. 3 (September 2000): 310–20, https://doi.org/10.1080/01650250050118295.
- Alison Milner., Andrew Page, and Anthony LaMontagne. “Long-Term Unemployment and Suicide: A Systematic Review and Meta-Analysis,” PLoS ONE 8, no. 1 (2013), https://journals.plos.org/plosone/article?id=10.1371/journal.pone.0051333; Timothy J. Classen and Richard A. Dunn, “The effect of job loss and unemployment duration on suicide risk in the United States: A new look using mass-layoffs and unemployment duration,” Health Economics 21, no. 3 (2012): 338–50, https://pubmed.ncbi.nlm.nih.gov/21322087/.
- Marilyn Geewax, “The Impacts Of Long-Term Unemployment,” NPR, December 12, 2011, https://www.npr.org/2011/12/09/143438731/the-impacts-of-long-term-unemployment.
- Austin Nichols, Josh Mitchell, and Stephan Lindner, “Consequences of Long-Term Unemployment,” Urban Institute, July 2013, https://www.urban.org/sites/default/files/publication/23921/412887-Consequences-of-Long-Term-Unemployment.PDF.
- Julie M. Whittaker and Katelin P. Isaacs, “Extending Unemployment Compensation Benefits during Recessions,” Congressional Research Service, October 1, 2014, https://crsreports.congress.gov/product/pdf/RL/RL34340.
- Aquil Jones and Joseph Tracy, “Spotlight: Black Workers at Risk for ‘Last Hired, First Fired,’” Southwest Economy Podcast, 2020, https://www.dallasfed.org/research/swe/2020/swe2002/swe2002e.aspx.
- Christian Weller, “African Americans Face Systematic Obstacles to Getting Good Jobs,” Center for American Progress, December 5, 2019, https://www.americanprogress.org/issues/economy/reports/2019/12/05/478150/african-americans-face-systematic-obstacles-getting-good-jobs/.
- Sylvia Allegretto and Steven Pitts, “The Great Recession, Jobless Recoveries, and Black Workers,” University of California Berkeley Joint Center for Political and Economic Studies, 2010, https://laborcenter.berkeley.edu/pdf/2010/the-great-recession.pdf.
- Ava Kofman and Hannah Fresques, “Black Workers Are More Likely to Be Unemployed but Less Likely to Get Unemployment Benefits,” ProPublica, August 24, 2020, https://www.propublica.org/article/black-workers-are-more-likely-to-be-unemployed-but-less-likely-to-get-unemployment-benefits.
- Ava Kofman, “How North Carolina Transformed Itself Into the Worst State to Be Unemployed,” ProPublica, June 30, 2020, https://www.propublica.org/article/how-north-carolina-transformed-itself-into-the-worst-state-to-be-unemployed.
- “Using Unemployment Insurance to Help Americans Get Back to Work: Creating Opportunities and Overcoming Challenges: Testimony before Senate Finance Committee,” statement of Mark Zandi, chief economist, Moody’s Analytics, 111th Congress, 2nd session, April 14, 2010, https://www.economy.com/mark-zandi/documents/Senate-Finance-Committee-Unemployment%20Insurance-041410.pdf.
- Josh Bivens, “Cutting off the $600 boost to unemployment benefits would be both cruel and bad economics,” Economic Policy Institute, June 26, 2020, https://www.epi.org/blog/cutting-off-the-600-boost-to-unemployment-benefits-would-be-both-cruel-and-bad-economics-new-personal-income-data-show-just-how-steep-the-coming-fiscal-cliff-will-be/.
- 9 million workers without benefits times $311 per week is approximately 2.5 billion per week.
- Julie M. Whittaker and Katelin P. Isaacs, “Extending Unemployment Compensation Benefits during Recessions,” Congressional Research Service, October 1, 2014,https://crsreports.congress.gov/product/pdf/RL/RL34340.


