
The 142 million U.S. workers covered by unemployment insurance (UI) count on state unemployment benefits for immediate temporary wage replacement if they unexpectedly lose their jobs.1 These state UI benefits are paid out of dedicated state trust fund accounts financed by employer contributions.2 States set the amount of benefits, and the amount of contributions by employers needed to pay those benefits. By design, states must build up their trust funds during economic good times when benefit payouts are low (and when employers can afford to pay), and spend them down when demand spikes during a recession.
This financing method supports UI’s special role as an automatic stabilizer of the economy, adding spending power to the economy when consumers have less to spend with resources automatically saved during good times. To support this critical function, the U.S. Department of Labor has directed states to save at least one year of recession-level benefits in their trust fund.3 Moreover, benefits must be accessible and adequate in order for the UI program to pack a strong recession-fighting punch.
The Great Recession represented a perfect storm for the UI program. In 2007, as previously documented by The Century Foundation, just nineteen states had reached the financing threshold, down from thirty states just seven years earlier (2000).4 The Great Recession brought unemployment levels not seen in generations, shocking this ill-prepared system with a flood of benefit payments that was more than 50 percent higher than during the previous downturn.5 The results were cataclysmic. By 2012, thirty-six states were forced to borrow to pay unemployment benefits, more than during any prior recession (thirty-two states borrowed from 1982 to 1987).6 Net trust fund reserves nationwide flipped from plus $38 billion in 2007 to negative $35 billion just three years later.
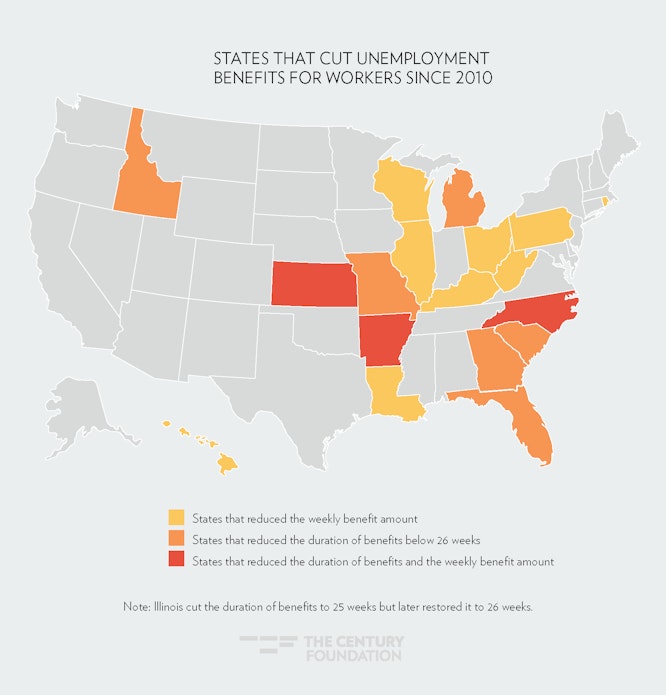
When states borrow from the federal government, they are required to repay these loans with interest, so state unpreparedness comes with a heavy price tag. As a result of this and other financial pressures, states made major reductions in their unemployment benefits. In an unprecedented change, nine states eventually reduced their basic unemployment benefits package to fewer than twenty-six weeks (all fifty states had provided twenty-six weeks of basic state benefits as late as the end of 2010).7 Fourteen states froze or reduced their maximum weekly unemployment benefits.8 State leaders pointed to the sorry condition of UI trust funds and higher UI taxes as the rationale for these cuts.
Map 1
These cuts were especially painful to workers, but for states unprepared for the Great Recession, there were few good options. But now, the nation’s economy is entering into its eighth year of expansion—one of the longest periods of economic growth in U.S. history—and the returning vitality of our unemployment system now leaves it out of balance. States no doubt are relieved to see resurgent UI trust funds, but currently, they might also be courting future ruin by keeping their benefit packages austere. Money in the pockets of jobless workers during a recession helps keep state economies afloat, so states should also be taking this opportunity to evaluate their programs in order to prepare for the future, bolstering them in ways that would help ensure economic strength and stability during the next downturn.
This report looks at the impact of economic growth on the recovery of the unemployment insurance system, and whether this recovery justifies a return to a more reasonable, pre-recession set of benefit rules. In terms of UI benefits, the report assesses whether employers and workers both are reaping the benefits of this long economic recovery; in short, they are not. The report finds that:
- Unemployment insurance tax rates in 2017—currently at a nationwide average of 0.59 percent of wages—are lower than they were in all but four other years in the history of unemployment insurance programs (1999, 2000, 2001, and 2002).9 The ability to keep UI tax rates low during this period of economic growth is a boon to employers.
- Workers have not shared in this return to economic prosperity: most states that enacted cost-cutting reductions in benefits have left them in place during this time, even as UI tax rates have plummeted. Critically, nine states have cut benefits back below the level of twenty-six weeks, and twelve states have lowered the level of benefits as compared to before the recession.
- The percentage of jobless workers collecting benefits has plummeted over the first two decades of the century. The biggest contributor to the decline has been the shortening length of benefits and, in recent years, the decline in jobless workers applying for UI. Since 2010 alone, the percentage of jobless workers applying for benefits has tumbled from 78 percent to 48 percent. In recent years, several states have rolled out poorly designed online UI applications and new eligibility requirements, discouraging workers from applying.
- With state UI programs currently almost $50 billion in the black, the long recovery creates an opportunity to bring the system into balance—before the next downturn when families and the entire economy will depend on it. States should be encouraged to take the lead and enact these reforms, and future legislation should put teeth into long-standing recommendations around minimum benefit levels.
Unemployment Trust Funds Are Growing
Unemployment trust funds have benefited from the extended length of the current economic recovery. Figure 1 charts the combined mid-year unemployment trust fund balance of all state unemployment trust funds. (Mid-year represents the peak unemployment trust fund level, as most UI tax revenue comes in the second quarter.) It is remarkable to see the steady climb of unemployment trust funds from a nadir of negative $25 billion on June 30, 2011 to a positive balance of $52.7 billion this June.10 On a nominal basis, this is just below the all-time unemployment trust fund balance high of $53.2 billion in June 2000—and if economic growth continues apace, UI trust funds will surpass that all-time high by June of next year.11 All states, except for California and the Virgin Islands, have repaid their debts to the U.S. government. The state of California had reduced its $10.9 billion loan from 2011 to $3.9 billion by the end of 2016, and is projected to be in the black by 2018.12
Figure 1
One important caveat is that states borrowed both from the federal government and the private sector to pay off their unemployment debts in the aftermath of the recession. While all but $300 million of debt to the federal government has been paid off, the private bond market offered longer maturity periods, and based on U.S. Department of Labor reports, there is approximately $4.7 billion in outstanding private debt.13 With these debts considered, the net unemployment trust fund balance is approximately $47.6 billion as of June 2017.
While these large reserves are impressive, it does not mean that all states are prepared for the next recession, as current reserves don’t measure up to the possible risk associated with a recession. A simple measure of the solvency of reserves is the percent of total wages of covered workers represented by UI trust funds, known as the reserve ratio. Aggregate state unemployment trust fund balances today are 0.73 percent of wages. In June of 2000, they were twice as much: 1.5 percent.
The more precise definition of solvency is the Average High Cost Multiple (AHCM). The AHCM compares the reserve ratio, which is the size of the unemployment trust fund balances as compared to the size of the risk being insured (wages)—much like how an auto insurance company compares its resources on hand to the total replacement value of the cars it is insuring. The AHCM compares those trust fund reserves to the highest level of risk experienced in recent history; in the case of unemployment, that is the highest annual rate of unemployment benefits paid out as a percentage of total wages insured, known as the benefit cost rate.15 If current trends continue, twenty-seven states would reach that recommended solvency level by the end of 2018. That’s approaching the most recent solvency peak in 1998, when there were thirty-one states that reached such a solvency level.16 It is important to point out that this does not mean trust fund levels are getting too high—states need to reach this solvency level before the next recession to reduce the risk of borrowing and further pressure for benefit reduction.
The Department of Labor’s solvency standards reveal similar progress. The department has limited oversight authority over state funds, despite the fact that states have access to an open borrowing authority and state trust fund debts are counted on the federal budget. In 2010, The Department of Labor issued rules determining which states would have access to short-term, interest-free borrowing from the federal government.17 The intent was to limit borrowing to those states who had met pre-recession solvency standards. The Department of Labor gave states until December 31, 2018 to meet the 1.0 standard. According to the most recent solvency report released in association with the rule, twenty-nine states now meet the interim solvency target set for December 31, 2016 of 0.8 AHCM, which is the equivalent of just under ten months of recession-level benefits held in reserve.18 The states that don’t yet meet this level of financing are shown in Table 1. These results are better than when twenty-three states that had such solvency in 2007, before the Great Recession, but still worse than before earlier recessions, when thirty-eight states had at least this level of pre-recession solvency (in 2000 and 1989).
In short, the unemployment insurance funding crisis is showing signs of ebbing. But many state trust funds will need several more years of trust fund building to get back to the proper level of pre-recession funding. The question now is, will employers and workers alike benefit from this recovery?
| Table 1. States That Do Not Meet Department of Labor Solvency Standards as of December 31, 2016 | ||
| Arizona | Kentucky | Ohio |
| California | Massachusetts | Pennsylvania |
| Colorado | Missouri | Rhode Island |
| Connecticut | Nevada | South Carolina |
| Delaware | New Jersey | Texas |
| Illinois | New York | West Virginia |
| Indiana | North Dakota | Wisconsin |
|
Note: Michigan meets the current solvency standard according to the Department of Labor, but still had $2.2 billion in outstanding privately held UI debt as of December 31, 2016 according to federal reports. Source: U.S. Department of Labor. |
||
Employers Are Benefiting from the Trust Fund Recovery via Lower Taxes
Employers are seeing the benefits of the trust fund recovery each time they open their steadily shrinking UI tax bill. This shrinking bill is primarily the result of the structure of the UI program itself, which automatically reduces UI taxes when fewer benefits are paid out. While states have authority to set up their UI trust funds, they all share basic features. Each employer’s unemployment tax rate is based on several factors, including how many of their former employees collect UI and the level of the state unemployment insurance trust fund, a practice called experience rating.
Unemployment insurance claims have ebbed dramatically in recent years, as companies are laying off fewer workers, and a shrinking percentage of jobless workers are collecting an unemployment check. During the week of February 25, 2017, new unemployment insurance claims reached a historic low of 227,000, and the UI claims level has been below the 400,000 level historically associated with a growing economy for an unprecedented 253 weeks in a row since November 2012.19 In one-third of states, unemployment insurance tax rates reflect benefits paid for claims only from the past three to five years (these are known as benefit ratio states). In these states, higher recession-level claims are no longer factored into the experience rating equation at all, causing UI tax rates to plummet. The effect in the other states that base a firm’s tax rate on the entire history is more gradual, but still push tax rates in the downward direction (these are known as reserve ratio states).
Figure 2
Taken together, the declining level of UI claims and rising level of UI trust funds have slashed employer tax rates to their lowest level since 2002, as shown in Figure 2. At 0.59 percent of wages, unemployment insurance tax rates in 2017 are lower than in all but four other years in the history of the unemployment insurance program (1999, 2000, 2001 and 2002). The rate has dropped by 37 percent since just 2012, when it crested at a recent high of 0.93 percent.20 By 2012, claims and solvency legislation had pushed UI tax rates to their highest level in nearly three decades (since 1988), albeit a level far less than employers were accustomed to paying in the 1970s and 1980s, when UI taxes were consistently more than 1.0 percent of wages.21 Moreover, the increase in taxes through 2012 shown in Figure 2 does not include significant interest payments on federal trust fund loans, principal payments deducted from federal unemployment taxes, or private bonds made through state add-on taxes that are not counted in official federal statistics.22
Employers did play their part in the recovery of UI trust funds. For example, in the aftermath of the Great Recession, twenty-one states increased their taxable wage base (the amount of each worker’s wages subject to statutory UI tax rates)—a move that upped UI tax rates and accelerated trust fund building.23 But these trends have now played themselves out.
Unemployment taxes on employers have declined since 2012 in every state except for North Dakota, as shown in Table 2. Employers are benefiting from annual tax bills that cost an average of $180.76 less per employee, as compared to the level in 2012.
UI taxes have declined particularly fast in those states that have reduced the number of weeks of unemployment benefits from the twenty-six in the basic package (those states are starred in Table 2; this report will cover states that have cut benefit packages in more detail). Seven out of the nine states that enacted major cuts to unemployment duration were in the top half of the list of tax-cutting states displayed in Table 2. These states were Arkansas, Florida, Idaho, Kansas, Michigan, North Carolina, and Missouri. An extreme example is Florida, where UI taxes have dropped by 77 percent since 2012, which amounts to $300 per employee in 2017 dollars. Taxes are set to go down even further in these states. In North Carolina, for example, employers will enjoy a second 0.5 percent across-the-board reduction in taxes in 2018, after receiving a 0.5 percent reduction in 2017. It is important to note that the reduction in taxes in North Carolina (and in other big benefit cut states like Florida) is attributable to the rise in the trust fund facilitated by major reductions in benefits. In 2012, only one state (South Dakota) had taxes that amounted to less than $150 per worker per year; now, there are nine states with such ultra-low taxes (Alabama, Florida, Louisiana, Mississippi, Nebraska, New Hampshire, South Dakota, Tennessee, and Virginia).
|
Table 2. Change in Unemployment Taxes Since 2012
|
||||
| State | Tax Rate – 2012 (% of Total Wages) | Tax Rate – 2017 (% of Total Wages) | Change in Tax Rate |
Per Employee Savings ($)
|
| United States | 0.93 | 0.59 | -37% | $180.76 |
| Florida* | 0.88 | 0.20 | -77% | $318.11 |
| New Hampshire | 0.98 | 0.24 | -76% | $398.94 |
| Mississippi | 0.94 | 0.24 | -74% | $263.84 |
| Tennessee | 0.75 | 0.20 | -73% | $258.40 |
| Alaska | 1.86 | 0.62 | -67% | $660.69 |
| Nebraska | 0.63 | 0.21 | -67% | $181.83 |
| Oklahoma | 1.10 | 0.40 | -64% | $305.24 |
| Maryland | 1.08 | 0.40 | -63% | $379.44 |
| Utah | 0.88 | 0.34 | -61% | $241.57 |
| Hawaii | 1.81 | 0.71 | -61% | $514.62 |
| North Carolina* | 1.02 | 0.42 | -59% | $281.94 |
| Wyoming | 1.56 | 0.74 | -53% | $369.88 |
| Wisconsin | 1.38 | 0.66 | -52% | $331.92 |
| Alabama | 0.71 | 0.34 | -52% | $162.66 |
| Arkansas* | 1.19 | 0.57 | -52% | $256.20 |
| Idaho* | 1.92 | 0.95 | -51% | $380.07 |
| Missouri* | 0.74 | 0.38 | -49% | $165.29 |
| Virginia | 0.53 | 0.28 | -47% | $133.06 |
| Illinois | 1.38 | 0.76 | -45% | $350.58 |
| Minnesota | 1.16 | 0.64 | -45% | $282.30 |
| Michigan* | 1.28 | 0.71 | -45% | $289.95 |
| Kansas* | 0.87 | 0.49 | -44% | $167.25 |
| Montana | 1.25 | 0.71 | -43% | $215.67 |
| Maine | 1.05 | 0.60 | -43% | $189.64 |
| New Jersey | 1.4 | 0.82 | -41% | $364.63 |
| Indiana | 0.82 | 0.50 | -39% | $142.07 |
| Washington | 1.0 | 0.61 | -39% | $227.85 |
| Colorado | 0.86 | 0.53 | -38% | $179.56 |
| Georgia* | 0.58 | 0.37 | -36% | $105.51 |
| South Dakota | 0.42 | 0.27 | -36% | $61.00 |
| Iowa | 1.29 | 0.85 | -34% | $197.29 |
| Massachusetts | 1.14 | 0.76 | -33% | $257.39 |
| New Mexico | 0.82 | 0.57 | -30% | $104.38 |
| South Carolina* | 0.86 | 0.61 | -29% | $106.37 |
| Rhode Island | 1.61 | 1.16 | -28% | $229.76 |
| New York | 0.70 | 0.52 | -26% | $122.87 |
| Texas | 0.66 | 0.51 | -23% | $81.46 |
| Oregon | 1.83 | 1.42 | -22% | $202.00 |
| Kentucky | 0.91 | 0.72 | -21% | $83.32 |
| Connecticut | 1.03 | 0.84 | -18% | $126.13 |
| California | 0.83 | 0.68 | -18% | $94.14 |
| Louisiana | 0.39 | 0.32 | -18% | $31.92 |
| Ohio | 0.8 | 0.67 | -16% | $61.75 |
| Delaware | 0.66 | 0.57 | -14% | $48.61 |
| Nevada | 1.29 | 1.12 | -13% | $79.76 |
| West Virginia | 1.05 | 0.93 | -11% | $49.04 |
| District of Columbia | 0.40 | 0.36 | -10% | $32.86 |
| Arizona | 0.46 | 0.43 | -7% | $14.49 |
| Vermont | 1.59 | 1.5 | -6% | $40.24 |
| Pennsylvania | 1.27 | 1.24 | -2% | $15.73 |
| North Dakota | 0.67 | 1.34 | 100% | -$329.42 |
| * States that have enacted cuts to UI duration. Source: Author calculations from U.S. Department of Labor data; 2017 tax rates are estimated by U.S. Department of Labor. |
||||
Hampered Benefit Recipiency Is Keeping Tax Rates Low
Employers are enjoying low tax rates not only because of the low unemployment rate. The extremely low percent of jobless workers collecting unemployment benefits have allowed funds to rebuild even more quickly. The last time the overall unemployment rate was this low was September 1999. But today, with a larger workforce and the same unemployment rate, there are just 240,000 weekly unemployment claims, compared to 290,000 claims in 1999—a 17 percent decline.24
The percentage of jobless workers who receive UI has been steadily decreasing. The uptake of UI benefits, referred to as the unemployment insurance recipiency rate, has been dropping since the start of the millennium, and suffered an extreme decline after the Great Recession (see Figure 3). For example, the rate—measured as the ratio of workers collecting UI to the total number of jobless workers—fell by nearly half over that time period, dropping from 43.7 percent in 2001 to a nadir of 25.7 percent in 2013.25 While UI recipiency rates can be expected to drop after a recession, as an increasing share of workers are unemployed for periods longer than covered by UI, the decline after the Great Recession was steeper than expected, and it has lingered longer. UI recipiency rates remained stuck at just 27.1 percent in 2016—a rate lower than any other year before 2010 (the previous all-time low was 29.0 percent in 1984).
Figure 3
While low UI recipiency is a nationwide trend, it has a distinctive regional dimension. There are thirteen mostly southern states where less than one in five jobless workers received an unemployment payment in 2016 (Florida, North Carolina, Louisiana, Georgia, Tennessee, South Carolina, South Dakota, Virginia, Alabama, Nebraska, Arizona, Mississippi, and Indiana). That’s compared to only two states with such low-recipiency in 2007 (Texas and South Dakota). The largest drops in recipiency were also concentrated among this group of thirteen states. The ten largest drops in UI recipiency (from 2007 to 2016) are North Carolina, Florida, Alabama, Louisiana, South Carolina, Idaho, Tennessee, Indiana, Georgia and Nebraska. Here, the association between UI policy and low recipiency rates surfaces. Five of these ten states are among those that cut back the basic unemployment period to below the standard of twenty-six weeks, and two are among states where the value of unemployment insurance payments has been lowered by legislation. This does not demonstrate a causal link between benefit cuts and the decline recipiency, but rather a correlated trend.
Urban Institute economist Wayne Vroman outlined a method for decomposing the recipiency rate into different components: the percent of newly unemployed workers filing for UI benefits, the percent of applications approved for benefits, and the duration of unemployment covered by UI benefits in paper covering UI recipiency through 1999.26
- Many workers are not applying for UI benefits. The percentage of workers making an initial unemployment claim during their first five weeks of unemployment has plummeted from 78 percent in 2009 to just 48 percent in 2016, continuing a steady decline establishing historical lows.
- The duration rate for UI benefits is shrinking. To the average period for receiving state unemployment benefits has declined from covering 77 percent of the average unemployment spell to just 56 percent in 2016, increasing the percentage of jobless not receiving benefits.
- The acceptance rate has declined, but only slightly. The percentage of new initial claims resulting in unemployment benefit payments was 68 percent in 2016, down slightly from 75 percent in 2009.
Viewing Figure 4, it’s clear that the shortened length of UI benefits has driven the decline in the recipiency rate since 2001. And, moreover, since 2009, a steep decline in the application rate has pushed the recipiency rate even further down.
Figure 4
Economic factors play a role in these declining rates. During recessions, more workers apply for UI for a number of reasons: these workers are more likely to have been laid off from a job and eligible (as opposed to those who quit), and they have less optimism about the economy and a greater need for benefits. Policy factors such as stiffer work search requirements, new bureaucratic hoops to apply for benefits, and shorter maximum benefits are driving these trends further. However, the declines in Figure 4 can not be attributed to economic factors alone.
New Job Search Requirements Are Making It Harder for Eligible Workers to Receive UI
Another factor driving down the relative duration of unemployment benefits has been a new approach to continuous unemployment eligibility. After being declared eligible for UI benefits, recipients must be able and available for work and actively searching for a new job in order to continue their benefit eligibility. But, the way that this requirement has been enforced in recent years is causing more workers to be disqualified from UI benefits. Since 2006, the U.S. Department of Labor has provided grants to provide Reemployment and Eligibility Assessment (REA) to monitor the continuous eligibility of UI claimants, and since 2012, all states are required to have an REA program in place.27 Congress also passed legislation that required all states to have formal work search requirement in place, and states took the opportunity to tighten their rules.28 For example, workers in states such as Florida are being required to use online portals to submit applications each week.29 If a worker misses an REA appointment or does not log into the employment portal to provide adequate work search documentation, they could be penalized.
As the National Employment Law Project has documented, technological challenges with new web claims systems, have complicated the introduction of tighter rules. In a directive in 2016, the U.S. Department of Labor warned that “while web-based claims filing systems offer many individuals the convenience of filing UI claims remotely at almost any time, ineffectually designed or implemented websites can create barriers that prevent or limit access for some individuals in violation of applicable Federal equal opportunity or nondiscrimination laws.”30 Florida eliminated all phone-based filing and went to an exclusive online system that included a brand new “employability assessment” and the requirement to document five contacts with employers per week. Following a four-fold increase in the number of individuals disqualified, the Department of Labor charged Florida with discrimination on limited English speakers and those with disabilities.31 Similarly, the rollout of the unfortunately named MiDAS program (Michigan Integrated Data Automated System) caused as many as 20,000 Michigan workers to be wrongfully accused of UI fraud. In many cases, the only notification was an email sent through a benefits system they no longer had reason to check.32 The decline in federal grants to states for the administration of the UI program is leaving states increasingly susceptible to these technological gaffes—in Pennsylvania, the state furloughed 35 percent of their administrative staff and recipiency dropped to its lowest level ever.33
Unemployed workers can be denied at two different stages: when they first apply for benefits, or in the middle of their receipt of benefits. The latter decisions, about whether workers have followed the rules and conditions for continuous unemployment insurance eligibility, such as searching for work while unemployed, are known as non-separation determinations. The non-separation denial rate—the percent of all non-separation cases that lead to a denial—has steadily climbed, and reached 85 percent in 2016, which is the highest it has been since 1971.34
Figure 5 lays out the ratio of non-separation denials to all weeks of unemployment claims. The rate has nearly trebled in recent years, from just over 1 percent to more than 3 percent. This is enough to have a drag on UI recipiency, as it would show up in the steeply declining duration rate—as middle-of-the-claim disqualifications would limit the share on unemployment spells covered by UI benefits. A recent econometric analysis of the various factors concluded that “increased non-separation determinations and denials are an important factor contributing to the decrease in the UI recipiency rate in the years since the Great Recession.”35
Figure 5
States Have Not Reversed Benefit Cuts, Despite Trust Fund Recovery
States typically cut UI benefits in the wake of a recession, as they divert resources to repay loans and to refill their trust funds. It is frequently said that, in terms of unemployment insurance, the worst time to be laid off is during an economic recovery. However, the severity of the funding crisis and the conservative bent of state legislatures during the recent post-recession cycle conspired to produce an unusually large wave of benefit cuts. Many of the states that steeply cut benefits produced the intended effect of rebuilding their trust fund. But, with only a few exceptions, states that have cut benefits have not used the opportunity of healthier UI financing to restore benefits to pre-crisis levels.36 Furthermore, a structural imbalance in unemployment insurance has made this problem more acute.
Unemployment taxes that employers pay automatically go down when trust funds improve, through the automatic mechanism of experience rating and related actuarial tables. In contrast, only a few states have linked the reversal of benefit reductions to trust fund health—leaving that decision up to state legislatures. As a result, while businesses have benefited from the tax reductions that accompany trust fund recovery, many jobless workers are left languishing in a system of reduced benefits, despite the renewed health of the UI system.37 Because major UI tax legislation has not come before most state legislatures in 2016 and 2017 and there has been not even been a legislative vehicle by which to move benefit restorations.
States Have Reduced the Maximum Duration of UI Benefits
In the past several years, nine states have reduced the maximum amount of time that unemployed workers can receive benefits to less than twenty-six weeks. This means that nearly forty percent of unemployed workers run out of benefits before they can find work. Before 2007, all states provided up to twenty-six weeks of unemployment benefits. As documented previously by The Century Foundation, nine states (Arkansas, Florida, Georgia, Illinois, Kansas, Michigan, Missouri, North Carolina, and South Carolina) cut the maximum duration of benefits between 2010 and 2015.38 Most states capped benefits at twenty weeks, but laws in Missouri, Kansas, Florida, and North Carolina allow for cuts in UI duration as deep as 50 percent when the unemployment rate goes down. Currently, workers in North Carolina and Florida are only entitled to twelve weeks of benefits. Since then, Illinois restored their benefits to the twenty-six-week standard.
Table 3 compares duration of unemployment in two similar economic periods of low overall unemployment—2007 and 2017. In the forty-two states that have not changed the maximum potential weeks of benefits, the average duration of UI benefits has gone up (along side an overall increases in long term unemployment). In contrast, all of the states capping UI benefits (except for Idaho) have slashed the actual packages received by workers with benefits dropping between 13 and 34 percent.
| Table 3. Potential and Actual Duration of Benefits, 2017 | ||||
| Maximum Weeks of Benefits (2017) | Actual Duration (2007) | Actual Duration (2017) | Change | |
| Other 42 states | 26 | 15.6 | 16.4 | 5.1% |
| Florida | 12 | 14.4 | 9.5 | -34.0% |
| North Carolina | 12 | 13.9 | 9.3 | -33.1% |
| Georgia | 14 | 11.2 | 8.4 | -25.0% |
| Kansas | 16 | 13.5 | 10.6 | -21.5% |
| Arkansas | 16 | 14.6 | 12.3 | -15.8% |
| Michigan | 16 | 14.8 | 12.5 | -15.5% |
| Missouri | 20 | 14 | 11.9 | -15.0% |
| South Carolina | 20 | 13.8 | 12 | -13.0% |
| Idaho | 21 | 11.3 | 11.4 | 0.9% |
| Source: U.S. Department of Labor | ||||
Not only are these states not reversing their benefit cuts, they are further reducing the amount of benefits available to workers in their states. Most significantly, Arkansas voted in 2017 to further reduce UI benefits from twenty to just sixteen weeks, even when unemployment is high and job seeking is at its worst.39 To add insult to injury, this bill also reduced the taxable wage base from $12,000 to $10,000. In other words, employers will now only be charged taxes on the first $10,000 of each employee’s wages, instead of $12,000—a tax reduction.40 Other states continue to reduce benefits in more subtle ways. That’s because they rewrote their statutes to further reduce unemployment duration when the unemployment rate dropped, with the argument that workers need fewer benefits at those times. That was the approach taken by Idaho, who in 2016 introduced a sliding scale that will cut benefit duration to as few as twenty weeks when the unemployment rate drops below 3.0 percent.41 The challenge with such proposals is that duration of unemployment have remained elevated, even when the overall economy is sound. Even in good economies, laid-off workers face structural barriers to getting re-employed, such as having out-of-date skills or facing age discrimination, or simply living in the wrong town when a plant closes down. In today’s economy, many workers lose their jobs because of technological change or global trade, and face significant struggles matching available openings to their skills. Moreover, many long-term unemployed workers are older and face bias when they apply for jobs.42
Missouri is another state that has contemplated even deeper cuts to unemployment benefits. The Missouri legislature passed legislation in 2015 further reducing the number of benefit weeks from twenty to thirteen weeks, but it was overturned by the Missouri Supreme Court based on the process to override then-Governor Jay Nixon’s veto.43 With a new, more conservative governor, Eric Greitens, the threat of further cutbacks remains real, and similar legislation has passed the house but was not signed into law this session.44 Similarly, Ohio legislative leaders proposed cutting benefits to as few as twelve weeks in 2015.45 Public disapproval of this proposal and a subsequent one led to a temporary compromise that did not include a reduction in weeks of benefits, but the most recent solvency package introduced by a key legislative leader would still cut benefits back from twenty-six to twenty-four weeks for most claimants.46
In summary, while the trust fund recovery has led to lower taxes for businesses, it has not triggered a widespread rollback of the cuts in UI benefit duration for jobless workers. Illinois has reverted to the full twenty-six weeks, but Idaho and Arkansas enacted provisions that stripped additional weeks of benefits. Missouri and Ohio proposed further reductions in duration, but have yet to enact those changes.
Maximum Weekly Benefit Levels Remain Low
Even in a slow-growth economy such as that of the past several years, wages still have grown by an average of 2.3 percent per year among workers covered by the UI system. For unemployment insurance benefits to provide meaningful protections to workers who unexpectedly lose a paycheck, it needs to be linked to wage growth. Before the Great Recession, thirty-two states indexed their maximum weekly benefit amounts to the average weekly wage of workers in the states. In 2008, these indexes ranged from 50 percent to 70 percent of wages of all workers in the state.47
States have frequently cut the level of unemployment benefits during past periods of financial stress in the program—and the post-2010 period has been no different. During the past decade, fourteen states have made changes to the maximum weekly benefit amount (see Table 4). Twelve of these fourteen states have moved to reduce the maximum weekly benefit amounts: Arkansas, North Carolina, and Wisconsin eliminated indexing altogether; Ohio, Pennsylvania, Kentucky, and West Virginia froze benefits; Louisiana reduced them by $11 per week; and Hawaii, Illinois, Kansas, and Rhode Island shaved percentage points off of their indexing rules.
States have made very limited progress in reversing these changes. Nine of the twelve states are still in a frozen or reduced state: Arkansas, Hawaii, Kansas, Illinois, North Carolina, Rhode Island, Wisconsin, Ohio, and Pennsylvania. Several of these states have only enacted temporary changes to benefits. In Ohio, benefits were frozen for 2018 and 2019, and will increase after that. In the case of Pennsylvania, maximum weekly benefits are set to go up by 2 percent per year from 2020 to 2023, and 4 percent per year after that (which is still short of what the previous indexing formula would have put them at).
Three of the twelve states (West Virginia, Kentucky, and Louisiana) explicitly tie changes in their maximum benefit levels to trust fund increases. Benefits in West Virginia will go up only when the trust fund reaches $220 million (the fund is just $67 million today), and similarly will ratchet up in Louisiana only when the fund is $1.4 billion (compared to just $933 million today).48 Only Kentucky has reached a high enough trust fund level to begin the automatic process of lifting the freeze in benefits, but even so, their benefits today provide replace income that is 7 percentage points less than benefits in 2008. Overall, in these twelve states, benefits are an average of 7.5 percentage points less than they were in 2008 as a share of the average weekly wage in those states.
| Table 4. Changes to Maximum Weekly Benefit Amounts | ||
| State | Change to Maximum Benefits | Details |
| Arkansas | Cut | Eliminated indexing |
| DC | Increased | Increased by $66,Indexing is optional |
| Hawaii | Cut | Lowered indexing rate from 75% to 70% |
| Illinois | Cut | Lowered indexing from 48% to 47%, will go to 42.9% in 2018 |
| Kansas | Cut | Lowered indexing from 60% to 55%, but set $474 per week floor |
| Kentucky | Cut | Frozen from 2008-2016, increased by 8% in 2017 because trust fund was up |
| Louisiana | Cut | Cut by $11, if trust fund goes up cuts will be restored |
| New York | Increased | Increased by $20, will be indexed in 2026 |
| North Carolina | Cut | Reduced and indexing eliminated |
| Ohio | Cut | Maximum weekly benefits frozen as of 2018 |
| Pennsylvania | Cut | Maximum weekly benefit capped until 2019 |
| Rhode Island | Cut | Indexing cut from 67% to 57.7%, and capped at 2011 levels |
| Wisconsin | Cut | Eliminated indexing |
| West Virginia | Cut | Frozen in 2009, until trust fund goes up |
| Sources: Comparison of State Unemployment Insurance Laws, District of Columbia Code Division VIII. General Laws. § 51-107; Illinois Compiled Statutes, § 820-405; Kansas Employment Security Law, § 44-704; Kentucky Revised Statutes § 341-380; Louisiana Revised Statutes 23-1474; Rhode Island Statutes § 28-44-6; West Virginia Code § 21a-6-1 and § 21a-1A; Wisconsin State Legislature 2015 Assembly Bill 819. | ||
In summary, for the most part, states have left their reductions to the maximum weekly benefit amount intact, even as employers have enjoyed large tax reductions. In some states, reductions to maximum weekly benefits amounts will ease if trust funds recover further or as temporary freezes are lifted.
Other Benefit Changes
Benefit changes went beyond the two issues highlighted above. Along with reducing the maximum weekly benefit, several states reduced the calculation of benefits for workers who had not earned enough to qualify for the maximum. Arkansas, Indiana, Kentucky, North Carolina, and Rhode Island were among states who made such changes.49 Numerous states tweaked their statutes to make it easier to disqualify workers fired (not laid off) from their jobs.50 While a number of states expanded UI eligibility to part-time workers using federal funding during the recession, Tennessee and North Carolina were among states who rolled back those protections once federal funding was gone.51 The bottom line is that the direction of UI policy in the states continues to be restrictive in recent years.
Recommendations for Action
Federal Reserve Chair Janet Yellen has predicted that the economy will continue its path of modest growth, and the Fed has just recently moved to ease additional elements of economic stimulus put into place during the recession.52 Thus, it appears possible that the economy may have several additional years of expansion before the next recession. It would be a mistake for states to wait until the next recession to remedy the benefit cuts highlighted above. Unemployment insurance acts as an automatic stabilizer when the economy drifts in recession, immediately filling in for the spending power of lost wages. If legislative action is still needed to make benefits sufficient, this economic stabilization effect is hobbled. States and the federal government should act now to reverse UI benefit cuts before the next recession, in several key areas.
Restore the Duration of Benefits
Jobless workers who do not receive the full duration of UI benefits have less money to spend while looking for work. This deficit creates uncertainty among job-seekers, deprives local economies of much-needed resources, and can lead to a cascade of additional effects, such as housing foreclosures. Furthermore, a shortened duration of benefits actually deprives states of resources as states collect less in federal extended benefits.
State legislatures should ensure their local economies thrive by restoring the basic package of UI benefits to twenty-six weeks in all economic climates—the practice still in place in forty-two states. If states are unwilling to do that, they should at least move to restoring the full twenty-six weeks of benefits when the unemployment rate is high—specifically when the unemployment rate reaches 6.5 percent, the threshold rate that federal extended benefits trigger on. Federal extended benefits are equivalent to half of regular benefits, so increasing state unemployment benefits when unemployment rises this high ensures maximum drawdown of federal resources. It’s worth noting that temporary federal extensions have been enacted when the unemployment rate was much lower, and states that have reduced unemployment duration are likely to miss out if this happens.
Restore Benefit Payment Levels
As with shorter benefit durations, lower benefit payment levels reduce the effectiveness of UI benefits. Insufficient wage replacement puts unemployed families at greater risk of lasting economic distress, which could trigger the loss of home or a car. If UI is paid out at insufficient levels when a plant closes or a recession hits, their power to act as an economic stabilizer is hampered, going against the rationale for having UI in the first place.
To ensure that UI benefit payments are adequate to put the brakes on a downturn, legislatures in states approaching the Department of Labor’s trust fund target (1.0 AHCM) should lift freezes on maximum unemployment benefit levels, and restore indexing of UI benefits to average weekly wages. States should follow bipartisan recommendations from the Advisory Commission on Unemployment Compensation (1995) and index weekly benefits to two-thirds of the average weekly wage, or at the very least, the level of indexing that they had in place in 2008, before benefit cuts were enacted.53
Analyze Data on Benefit Reductions
The policy response to the Great Recession is, hopefully, a once-in-a-lifetime event, and it has provided policymakers with an opportunity to study how the UI system responded to protracted economic downturn and rebound, as well as the effects of policy modifications made during that time in reaction to the strain on the system.
States that have enacted benefit reduction now have several years of post-reduction benefit data. State unemployment insurance agencies should analyze the impacts of benefit reductions, including actual numbers on the dollar amount of benefit reductions, exhaustions of benefits, and the demographics of those impacted. This data analysis should be published as an independent study by each state’s agency. The best approach would be a commission of multiple stakeholders, including employer and employee representatives, to analyze the results of the study and recommend policy actions. When permanent advisory committees exist, they can be charged with this process. In the absence of a commission or advisory committee, a state legislature can request a study.
Keep Building Toward UI Solvency
The waning of the UI solvency crisis that followed the Great Recession is a welcome development, but the transition of UI trust funds from red to black does not mean that all states have sufficient resources to weather the next recession, nor does it signal a green light for states to cut UI taxes and deplete their funds. States that don’t meet solvency requirements can easily be thrown into an economic crisis during the next downturn, leading to a return of government borrowing and emergency cutting of UI benefits.
In the twenty-one states (see Table 1) that don’t meet the Department of Labor measure of solvency, state legislators and governors need to be wary of the urge to pass tax cuts and other legislation that will reduce the strength of their UI trust funds. During the late 1990s (the most recent period of flush trust funds), many states made the mistake of enacting trust fund rebates based on the nominal value of their trust fund.54
Furthermore, legislatures in some less-solvent states, such as Ohio and Missouri, are still engaged in active debates how to rebuild their UI funds before the next recession. As mentioned above, both states are considering significant cuts in UI benefits, including lowering the basic package of benefits below twenty-six weeks. In the current climate of strong employer profits, employers can afford to pay incremental tax increases needed to put trust funds back in order. If necessary, still-insolvent states should consider employee taxes as way for workers to contribute to UI solvency, rather than benefit cuts.
Address Benefit Shortfalls through Tax Legislation
In states that already meet the solvency target, it is possible that, if the economy continues to avoid recessions, state legislatures will look to provide “employer relief” as their UI trust funds grow. State and local economies would be better served, if any “surplus” UI trust funds are also shared with jobless workers, in the form of renewed or enhanced benefits.
Department of Labor regulations promulgated in 2010 have strengthened the idea of the actuarially sound Average High Cost Multiple solvency standard of 1.0. States with solvency of 1.0 of AHCM could reasonably look at their UI taxation. As UI tax relief becomes an issue in state legislatures, employee advocates should push for commensurate fixes to benefits. And, any laws that are passed should ensure that the overall effect of tax reductions and benefit increases would not be to lower UI trust funds below the 1.0 threshold. A good example of this principal was a 2016 Minnesota law that returned a trust fund surplus above 1.0 AHCM to employers and also provided extended unemployment benefits to long-term unemployed mining workers.55
Federal Legislation to Guide States
The UI program is a federal-state partnership, with the federal government setting minimum standards and states setting most of the rules. For its part, the federal government provides grants to states to support the processing of benefits and pays for federal extended benefits. Historically, Congress has used a variety of tools to influence state UI programs, including direct compliance requirements, rules related to extended benefits, and incentive grants.
Congress should include requirements in future UI legislation that would pull states back to minimum standards of UI benefits; a new wholesale regime for standards was recommended by the National Employment Law Project, Georgetown Center on Poverty and Inequality, and the Center for American Progress.56 One problem is that shorter state benefits increase the cost of federal extended benefits.57 When enacting any future programs of federal extended benefits, Congress should require states to pay for the first several weeks of extended benefits until each worker receives a full twenty-six weeks.58 In essence, this would be ensuring that workers receive their first twenty-six weeks of benefits from their state, and only receive federal extensions on top of that. To implement this requirement quickly, Congress could force a temporary increase on federal unemployment taxes in noncompliant states rather than wait for state legislatures to change laws or appropriations.
Conclusion
The long economic recovery after the Great Recession has facilitated a remarkable rebound for state unemployment trust funds. But, to date, these savings are solely being used to finance lower employer taxes. Now is the time for states to use these extra funds to restore their UI benefits back to accepted pre-recession levels—before the next recession hits, when workers once again will count on UI to feed, clothe, and house their families, and the nation will look to it as an automatic stabilizer in the economy.
Acknowledgements
I would like to acknowledge Maurice Emsellem, George Wentworth, Zach Schiller, Alexandra Sirota, and Wayne Vroman for their help with the paper.
Notes
- U.S. Department of Labor, “UI Quarterly Data Summary, 2nd Quarter 2017,” retrieved August 11, 2017 https://workforcesecurity.doleta.gov/unemploy/content/data_stats/datasum17/DataSum_2017_2.pdf
- Alaska, New Jersey and Pennsylvania partially fund their UI trust funds with employee contributions.
- “Federal-State Unemployment Compensation Program; Funding Goals for Interest-Free Advances; Final Rule,” Federal Register 75, no. 180 (September 17, 2010), http://webapps.dol.gov/FederalRegister.pdf”Display.aspx?DocId=24246. The new solvency standard would charge additional interest to unprepared states if their unemployment trust fund runs out during a recession.
- Andrew Stettner, “Speeding the Recovery of Unemployment Insurance,” The Century Foundation, March 29, 2016, https://tcf.org/content/report/speeding-the-recovery-of-unemployment-insurance/. Throughout this report, “states” refers to the fifty states and Washington, D.C.
- Author’s analysis of U.S. Department of Labor data comparing benefit cost rate in 2009 to 2002. Unemployment Insurance Financial Data Handbook (ET Financial Data Handbook 394), U.S. Department of Labor, Employment and Training Administration, https://workforcesecurity.doleta.gov/unemploy/hb394.asp.
- Wayne Vroman, “Unemployment Insurance in the Great Recession,” Urban Institute, December 2011, http://www.urban.org/sites/default/files/alfresco/publication.pdfs/412462-Unemployment-Insurance-and-the-Great-Recession.pdf.
- “Unemployment Insurance, States’ Reductions in Maximum Benefit Durations Have Implications for Federal Costs,” United States General Accountability Office, April 2015, http://www.gao.gov/assets/670/669802.pdf.
- These states are Arkansas, Hawaii, Illinois, Kansas, Kentucky, Louisiana, New Mexico, North Carolina, Pennsylvania, Rhode Island, South Carolina, Vermont, the Virgin Islands, West Virginia, and Wisconsin.
- Data from ET Financial Data Handbook 394, https://workforcesecurity.doleta.gov/unemploy/hb394.asp, and Average Employer Contribution by State, https://workforcesecurity.doleta.gov/unemploy/avg_employ.asp, retrived on August 21, 2017.
- “Unemployment Trust Fund Report,” TreasuryDirect, https://www.treasurydirect.gov/govt/reports/tfmp/tfmp_utf.htm, and “UI Quarterly Data Summary,” U.S. Department of Labor, https://workforcesecurity.doleta.gov/unemploy/content/data.asp, retrieved August 11, 2017.
- Ibid.
- “May Unemployment Trust Fund (UI) Forecast,” California Employment Development Department, May 2017, http://www.edd.ca.gov/About_EDD.pdf”/edduiforecastmay17.pdf.
- “State Solvency Report 2017,” U.S. Deparment of Labor, https://workforcesecurity.doleta.gov/unemploy/solvency.asp. This estimates takes January 1, 2017 estimate and predicts private balance have declined at the same rate that they did in 2016. Reports supplemented by interview with Ron Wilus, U.S. Department of Labor, August 28, 2017.
- An AHCM compares the trust fund as a size of the state’s insured wages by taking the three most recent high-cost years (in either the past twenty years or three recessions, whichever is longer) in benefits as a percentage of all wages insured. An average high -cost multiple of 1.0 means that the state’s year-end trust fund balance could pay out one year of recession-level benefits.
As of the end of 2016, just twenty-one states met this threshold for unemployment insurance solvency. That’s just slightly better than the eighteen who met it in 2007, a level that left the program vulnerable to significant insolvency. However, the robust savings illustrated above does have the potential to put the UI system in far better shape than it was at the start of the Great Recession. For this report, an analysis (not displayed) used the savings rates achieved by states over the past twelve months (June 2016 to June 2017) to predict how soon their trust funds would get to UI solvency if those trends continued. The results are that six additional states (Arkansas, Georgia, Kansas, Nevada, Virginia and South Carolina) would achieve solvency by January 1, 2019.14Author’s analysis.
- ET Financial Data Handbook 394, https://workforcesecurity.doleta.gov/unemploy/hb394.asp.
- “Federal-State Unemployment Compensation Program; Funding Goals for Interest-Free Advances; Final Rule,” Federal Register 75, no. 180 (September 17, 2010), http://webapps.dol.gov/FederalRegister.pdf”Display.aspx?DocId=24246.
- “State Trust Fund Solvency Report, 2017,” U.S. Department of Labor, March 2017, https://oui.doleta.gov/unemploy/docs/trustFundSolvReport2017.pdf.
- “Unemployment Insurance Weekly Claims Data,” U.S. Department of Labor, https://workforcesecurity.doleta.gov/unemploy/claims.asp, retrieved on August 28, 2017 (data through July 28, 2017).
- Ibid.
- Ibid.
- “Glossary,” ET Financial Data Handbook 394, https://workforcesecurity.doleta.gov/unemploy/hb394/gloss.asp.
- The increases in the taxable wage base were only large enough to keep up with inflation, rather than causing an increase in the real proportion of wages taxes. See Andrew Stettner, “Speeding the Recovery of Unemployment Insurance Financing,” The Century Foundation, March 29, 2016, https://tcf.org/content/report/speeding-the-recovery-of-unemployment-insurance/.
- “Unemployment Insurance Weekly Claims Data,” U.S. Department of Labor, https://workforcesecurity.doleta.gov/unemploy/claims.asp, retrieved on August 28, 2017 (data through July 28, 2017).
- “Regular Program Insured Unemployment as a Percent of Total Unemployment, 1950–2016,” Unemployment Insurance Chartbook, U.S. Department of Labor, https://workforcesecurity.doleta.gov/unemploy/chartbook.asp, accessed on August 28, 2017.
- Wayne Vroman, “Low Benefit Recipiency in State Unemployment Insurance Programs,” U.S. Department of Labor, June 2001, https://workforcesecurity.doleta.gov/dmstree/op/op2k1/op_05-01.pdf.
- Wayne Vroman, “Unemployment Insurance Performance after the Great Recession,” June 17, 2017, unpublished draft.
- “Unemployment Insurance Program Letter No. 05-13,” U.S. Department of Labor, Employment Training Administration, January 2013, https://wdr.doleta.gov/directives/corr_doc.cfm?DOCN=3698.
- George Wentworth and Claire McKenna, “Ain’t No Sunshine: Fewer Than One In Eight Unemployed Workers In Florida Is Receiving Unemployment Insurance,” National Employment Law Project, September 2015, http://www.nelp.org/publication/aint-no-sunshine-florida-unemployment-insurance/.
- “Unemployment Insurance Program Letter 2-16,” U.S. Department of Labor, Employment Training Administration, October 1, 2015, https://wdr.doleta.gov/directives/attach/UIPL/UIPL_02-16_Acc.pdf.
- George Wentworth and Claire McKenna, “Ain’t No Sunshine: Fewer Than One In Eight Unemployed Workers In Florida Is Receiving Unemployment Insurance,” National Employment Law Project, September 2015, http://www.nelp.org/publication/aint-no-sunshine-florida-unemployment-insurance/.
- Dave Eggart, “State of Michigan apologizes for unemployment fiasco, wants to reduce penalties,” Associated Press, January 28, 2017, http://www.monroenews.com/news/20170130/state-of-michigan-apologizes-for-unemployment-fiasco-wants-to-reduce-penalties.
- Sharon Dietrich, “State Supplemental Funding for UC Administration Is Required To Avoid Loss of Benefits by Unemployed Pennsylvanians,” Testimony to the Pennsylvania House of Representatives, August 29, 2017
- Wayne Vroman, “Unemployment Insurance Performance after the Great Recession,” June 17, 2017, unpublished draft.
- Wayne Vroman, “Unemployment Insurance Performance After the Great Recession,” Urban Institute unpublished draft, June 17, 2017.
- The current period is following a disturbing historical pattern. In the wake of severe recessions in the 1980s, states enacted restrictions on benefits, such as the “waiting week” that ended up becoming permanent features of UI law even after trust funds rebuilt. See Baldwin and McHugh, “Unprepared for Recession: The Erosion of State Unemployment Insurance Coverage Fostered by Public Policy in the 1980s,” Economic Policy Institute Briefing Paper, February 1992.
- Average growth from 2011 to 2016 in the average weekly wage of workers covered by UI benefits. ETA Financial Data Handbook 394, https://workforcesecurity.doleta.gov/unemploy/hb394.asp.
- Andrew Stettner, “Speeding the Recovery of Unemployment Insurance,” The Century Foundation, March 29, 2016, https://tcf.org/content/report/speeding-the-recovery-of-unemployment-insurance/.
- “An Act to Amend the Taxable Wage Base, Weekly Benefit Amount, Maximum Benefit Amount, and Certain Eligibility Requirements under the Department of Workforce Services Law; and for Other Purposes,” House Bill 1405, State of Arkansas, 91st General Assembly, Regular Session, 2017, http://www.arkleg.state.ar.us/assembly/2017/2017R/Acts/Act734.pdf.
- Ibid.
- General Laws of the State Of Idaho Passed and Published by the Second Regular Session of the Sixty-Third Idaho Legislature, Convened January 11, 2016, Adjourned March 25, 2016, Chapter 280 (H.B. no. 485), 772, http://legislature.idaho.gov/wp-content/uploads/sessionlaws/sessionlaws_vol2_2016.pdf.
- Richard Eisenberg, “What The Older, Long-Term Unemployed Need,” Forbes, August 10, 2017, https://www.forbes.com/sites/nextavenue/2017/08/10/what-the-older-long-term-unemployed-need/#232bda14768a.
- Kurt Erickson, “Court ruling could help nearly 14,000 who lost jobless benefits,” St. Louis Post Dispatch, July 28, 2016, http://www.stltoday.com/news/local/govt-and-politics/court-ruling-could-help-nearly-who-lost-jobless-benefits/article_8a3f3f73-85b4-550b-98aa-161a0c7d469b.html.
- Austin Huguelet, “Missouri lawmakers vote to slash unemployment benefits,” St. Louis Post Dispatch, February 23, 2017, http://www.stltoday.com/news/local/govt-and-politics/missouri-lawmakers-vote-to-slash-unemployment-benefits/article_f3f36cd0-76e8-50e3-8812-914fa9ecf66d.html.
- Zach Schiller, “Testimony to the Ohio House Insurance Committee,” Policy Matters Ohio, December 2, 2015, http://www.policymattersohio.org/testimony-unemployment-dec2015, and “Lawmakers freeze unemployment benefits; delay overhaul plans,” Associated Press, December 6, 2016, http://www.wistv.com/story/33978580/lawmakers-freeze-unemployment-benefits-delay-overhaul-plans.
- Hannah Halbert, “Bill Improved But Still Whacks Benefits, Uses Iffy Numbers,” Policy Matters Ohio, October 13, 2017, https://www.policymattersohio.org/press-room/2017/10/13/unemployment-bill-not-the-fix-we-need.
- “Comparison of State Unemployment Insurance Laws,” U.S. Department of Labor, https://workforcesecurity.doleta.gov/unemploy/statelaws.asp, and author’s analysis of state provisions.
- “UI Quarterly Data Summary 2nd Quarter 2017,” U.S. Department of Labor, https://workforcesecurity.doleta.gov/unemploy/content/data_stats/datasum17/DataSum_2017_2.pdf accessed October 25, 2017.
- Andrew Stettner, “Speeding the Recovery of Unemployment Insurance,” The Century Foundation, March 29, 2016, https://tcf.org/content/report/speeding-the-recovery-of-unemployment-insurance/.
- Ibid.
- Author’s analysis of “Comparison of State Unemployment Insurance Laws,” U.S. Department of Labor, https://workforcesecurity.doleta.gov/unemploy/statelaws.asp, 2017 and 2011.
- Jeff Cox, “Fed approves October reversal of historic stimulus, leaves rates unchanged,” CNBC, September 20, 2017, https://www.cnbc.com/2017/09/20/fed-approves-october-reversal-of-historic-stimulus-leaves-rates-unchanged.html.
- Advisory Council on Unemployment Compensation, “Benefits, Financing and Coverage,” U.S. Department of Labor, 1995, http://research.upjohn.org/cgi/viewcontent.cgi?article=1003&context=externalpapers.
- Marc Baldwin, “Beyond Boom and Bust: Financing Unemployment Insurance in a Changing Economy,” National Employment Law Project, 2001, http://www.nelp.org/content/uploads/2015/03/Financing-Unemployment-Insurance-in-a-Changing.pdf.
- Don Davis, “Unemployment Benefits Extended for Iron Range Workers,” Duluth News Tribune, March 24, 2016, http://www.duluthnewstribune.com/news/3994314-unemployment-benefits-extended-iron-range-workers.
- Rachel West, Indivar Dutta-Gupta, Kali Grant, Melissa Boteach, Claire McKenna, and Judy Conti, “Strengthening Unemployment Protections in America,” Center for American Progress, Georgetown Center on Poverty and Inequality and the National Employment Law Project, June 2016 https://www.americanprogress.org/issues/poverty/reports/2016/06/16/138492/strengthening-unemployment-protections-in-america/
- “Unemployment Insurance, States’ Reductions in Maximum Benefit Durations Have Implications for Federal Costs,” United States General Accountability Office, April 2015, http://www.gao.gov/assets/670/669802.pdf.
- Such a federal requirement could be tailored to not increase costs on states that provide some of their workers less than 26 weeks of benefits but still provide full-year, full-time workers with 26 weeks of benefits.


