
Executive Summary
Unemployment insurance (UI) is the nation’s first responder to economic distress. UI benefits make up for lost consumer demand, and this stimulus was credited with saving 1.75 million jobs during the Great Recession. 1 In 2014 alone, 800,000 families used UI to make sure the shock of a layoff was not turned into the crisis of poverty. These crucial benefits for our economy and for families depend on adequate financing.
UI is set up as a system of public social insurance funded by designated premiums, with states primarily responsible for setting UI taxes and maintaining an adequate trust fund. This report outlines the unprecedented strains facing that system and recommends a series of reforms to put UI back on a path to forward funding.
Findings
- The UI system faces a funding crisis that has made the safety net weaker than any time in its history. The U.S. Department of Labor has adopted a solvency target recommending that states save at least one year of recession-level reserves, known technically as an Average High Cost Multiple of 1.0. Going into the last recession, only nineteen states had stashed away this level of UI savings. By 2012, thirty-six state funds had gone bankrupt and had required at least a temporary loan from the federal government, with more states being forced to borrow than in any previous recession. This report documents three main responses to state trust fund insolvency from 2010 to 2015.
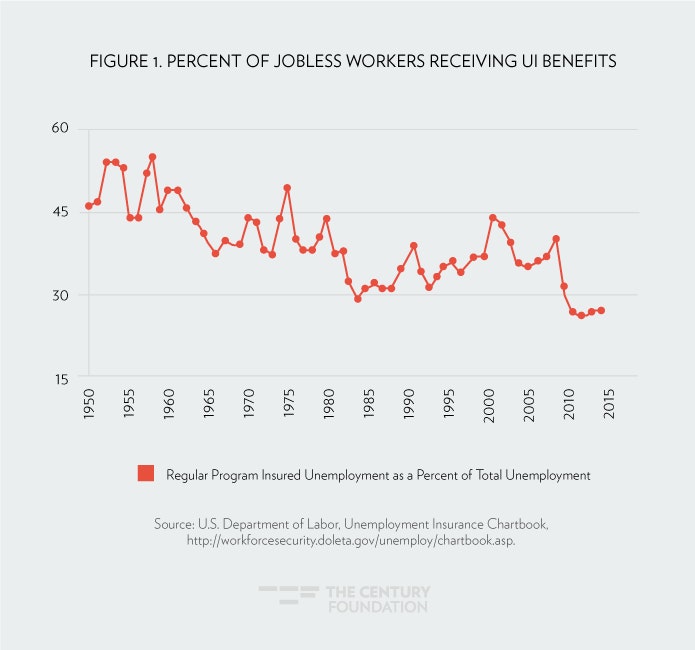
- As a result of insolvency, most states cut benefits, and now the percent of jobless workers receiving UI benefits has reached all-time low. States cut the number of weeks of benefits, the amount of benefits and adopted tighter qualification rules. The percentage of jobless workers receiving UI hit an all-time low of 26 percent in 2014, and was only 27 percent in 2015.
- Instead of raising UI taxes sufficiently, states turned to alternative financing. States used private bond deals to raise $11 billion of the $39 billion in loan repayments, which in most states reduced the pressure for benefit cuts but allowed states to avoid structural financing fixes. A further $10 billion in repayments came from automatic federal tax increases on employers required by law in the twenty-five states that were unable to fix their fund on their own.
- States increased the amount of wages subject to UI taxes, but not enough to stabilize UI funds. The federal government only requires states to subject the first $7,000 of each employee’s paycheck to UI taxes, making UI taxes deeply regressive. Twenty-one states did increase their taxable wage based from 2008 to 2015, however, only two of these states newly indexed this increase to inflation, and these increases were only enough to maintain the proportion of wages taxed.
- Current UI trust fund reserves would not be sufficient to withstand even a mild recession. Net UI trust funds held at the U.S. Treasury reached $31.2 billion by the end of 2015. When private bond debts are included, these funds are only at 59 percent of the level held at the start of the last recession. Only eighteen states currently meet forward funding requirements, and half would not even be able to weather a mild recession.
- Further trust fund savings will not bring the majority of the program to forward funding by the end of 2017. A dozen additional states were charging sufficient taxes in 2015 to reach solvency requirements by the end of 2017 if current economic conditions hold. Many of these states will reduce taxes too soon to realize this potential. Most importantly, 63 percent of all wages insured by the program are in twenty-three states that have no potential to reach the forward funding target by the time another recession is likely to hit.
Recommendations
Over the past two decades, the system has steadily moved toward insolvency, which should cause policymakers to revisit fundamental principles of UI financing—who pays UI taxes, and the role of federal oversight.
- Employee taxes. Three of the most generous UI programs utilize employee taxes to bolster their UI programs. Employee taxes revolutionize the political economy of UI financing and should be expanded through state or federal legislation, adding 15 to 25 percent of additional revenue annually. Employee contributions have the added benefit of providing a way to expand UI protection to the increasing freelance population.
- Increased federal role. The report embraces calls for a sturdier floor for UI financing (including setting the federal taxable wage base equal to the average annual wage, a federal minimum tax, and a new proposal for a minimum adequate tax), and new incentives for savings by states.
- Key state actions. Whether or not the federal government acts, the report cautions states not to risk tax reductions that seem attractive in an improving economy, urges them to restore benefit restrictions, and to permanently index their taxable wage base.
The state of current unemployment insurance financing
Click or hover over map below to view state level UI fund solvency.
Source: U.S. Department of Labor, State Solvency Report.2 Map by Simon Glenn-Gregg.
Introduction
This report examines the current financial crisis facing the unemployment insurance (UI) system, and possible policy reforms at the federal and state levels. It starts with an explanation of the basics of unemployment insurance financing, and then outlines the key responses by states to insolvency: state legislative increases to taxable wage bases, alternative sources of revenues, and restrictions to UI benefits. The report finds that, as of the end of 2015, these responses have left states unprepared for the next recession, and with no path toward forward funding of their UI systems. It concludes by recommending possible paths for reforms, including more widespread adoption of employee taxes, and other changes at the federal and state level.
How UI Works
Unemployment insurance is the nation’s first responder to economic distress. Individuals who become unemployed through no fault of their own and who qualify for UI currently receive, on average, $325 per week in UI payments, for sixteen weeks. In 2015, more than three-in-five workers found a new job before exhausting their typical entitlement of twenty-six weeks of benefits.3
UI is one of the few programs that prevents families from falling into poverty—it saved 800,000 households in 2014 alone.4 UI gives recipients the wherewithal to maintain spending on food, shelter, and their children—ensuring that a layoff is a temporary setback instead of an economic crisis. Furthermore, UI payments give individuals the ability to search for the right job, rather than settling for a job that is not suitable for their experience.
UI is also one of the most effective automatic stabilizers in the economy. When the economy dips into recession, UI payments automatically go up, making up for lost demand facing businesses. Economists view UI as one of the best tools government has to cushion economic cycles; increased purchasing power provided by UI benefits was credited with saving 1.75 million jobs during the Great Recession. Another UI-related buttress to the economy are work-sharing programs that allow firms to prevent layoffs by cutting workers to part-time hours and making up part of the difference with UI benefits.
The Structure of UI Financing
UI’s crucial positive benefits for our economy and for families depend on the program’s adequate financing. UI is set up as a system of public social insurance, with designated premiums set aside from covered workers into dedicated accounts that are used to pay benefits. UI financing mechanisms follow the structure of the unique federal-state partnership that UI is built on. Both state and federal revenues are collected and used for different purposes, and in all but three states, these taxes are paid solely by employers, based on their payroll. State UI taxes pay for the core program promise of up to twenty-six weeks of benefits. Federal UI taxes are placed in trust funds and are used to pay for the administration of the program by states, as well as any extended benefits given to the long-term unemployed during recessions.
There is a broad federal framework for state financing. The statutory federal unemployment tax rate is 6.0 percent of the first $7,000 of each worker’s annual pay (known as the taxable wage base). Employers in states that fully comply with federal regulations receive a 5.4 percent credit against that tax, and pay an effective tax of $42 per worker, per year—a powerful incentive to comply with federal oversight. Federal regulations require that each state must have a taxable wage base of at least $7,000, must vary the tax rate of each employer based on how many of their former employees have used the system (experience rating), and have a maximum tax rate of at least 5.4 percent for employers with a high rate of layoffs. Moreover, states must deposit proceeds from their state UI taxes into dedicated accounts held at the U.S. Treasury (where they earn interest) that can only be drawn on for the payment of benefits.
Federal loans also provide a backstop for state UI funds that become insolvent during recessions. States can borrow interest free for the first nine months of the year, and pay a modest interest rate on that balance (2.34 percent in 2015) for loans of a longer duration.5 If states are unable to pay their loans after several years, federal unemployment taxes are increased on employers in that state by at least $21 per worker, per year until the balance is fully paid back.6
Within these parameters, states have wide discretion in running their state UI programs, and tax rates vary tremendously from state to state. For example, in 2014, contributions per covered employee ranged from $145 per employee (Nebraska) to $860 per employee (Alaska), and as a percent of wages range from a low 0.34 percent (Tennessee) to 1.54 percent (Vermont).7 Overall, while UI has an important national purpose, financing has been left primarily to the states with little federal oversight.
The Great Recession Showed That the UI Financing System Is Broken
The Great Recession brought to a head the long-brewing crisis in the funding of UI. To be an effective counter-cyclical program, unemployment trust funds have to build up adequate reserves during periods of economic growth in order to pay out benefits during periods of economic decline. This avoids steeply raising taxes on employers when they are weakest and undercutting the stimulus effect of UI benefits. This principle of forward funding has been a central recommendation of UI policy experts for decades.For example, the last blue ribbon advisory commission that studied UI financing concluded,
During the past decade, many states with low or negative trust fund balances have found themselves in the position of either having to increase taxes on employer in the midst of economic downturn, or having to take measures to restrict eligibility and benefits for the unemployed…. The Council believes that it would be in the interest of the nation to begin to restore the forward financing nature of the Unemployment Insurance system, resulting in a building up of reserves during good economic times and of drawing down reserves during recessions.8
Unfortunately, most states have not heeded this advice. There were no federal penalties for states who failed to meet solvency standards, and availability of low-interest loans reduced incentives for states to save. Policymakers who were skeptical of UI worried that large trust fund balances would embolden advocates to secure benefits expansions, and argued that these dollars could be more productively be used in other parts of the state economy. In the lead-up to the Great Recession, states largely abandoned forward funding for pay-as-you-go financing models, which seek to collect just enough taxes to pay the past year’s benefits.9 Pay-as-you-go financing philosophy particularly took hold in the late 1990s, as states enacted tax cuts or diverted trust fund savings into other government purposes instead of using them to build up adequate reserves during periods of sustained full employment.11
In the lead-up to the Great Recession, states largely abandoned forward funding for pay-as-you-go financing models, which seek to collect just enough taxes to pay the past year’s benefits.
It was only very recently that the federal government set an official solvency standard. New regulations adopted in 2010 finally activated some unimplemented provisions included in the Balanced Budget Act of 1997, in which Congress sought to only provide interest-free loans to those states that had met “funding goals” prior to a recession.12 When the solvency rule is fully in effect in 2019, states will need to achieve a full funding goal of an average high cost multiple (AHCM) of 1.0 at least once in the prior five years in order to qualify for these preferred loans.13
The calculation of the AHCM demonstrates principles of sound financing of the unemployment program. The AHCM compares the reserve ratio, which is the size of the unemployment trust fund balance as compared to the size of the risk being insured (wages)—much like an auto insurance company needing to have sufficient resources on hand to replace the total values of the cars it is insuring. The AHCM compares those reserves to the highest level of risk; in the case of unemployment, the highest annual rate of unemployment benefits paid out as a percentage of total wages insured, known as the benefit cost rate. An average high cost multiple of 1.0 means that the state’s year-end trust fund balance could pay out one year of recession level benefits.14
At the onset of the Great Recession in 2007, only nineteen states reached the recommended level of pre-recession solvency. By contrast, at the start of the last two recessions, more than thirty states (thirty-three in 1989 and thirty-four in 2000) met this level of preparation. State UI payments skyrocketed to 1.7 percent of payrolls in 2009, the highest rate in more than twenty-five years—quickly depleting funds that were ill-prepared for a recession of any size, albeit one of the most severe recessions in the post-war period.
By 2012, thirty-six state funds had gone bankrupt and had required at least a temporary loan, with more states being forced to borrow than in any previous recession (twenty-five borrowed from 1974 to 1976; thirty-two borrowed from 1980 to 1987; and less than ten states needed loans in both the recessions of the 1990s and the 2000s).15 Net reserves in state trust funds went from $38 billion at the end of 2007, to negative $35 billion by the end of 2010, with loans peaking at $47 billion in 2011.16 Even adjusted for inflation, this represents the largest unemployment trust fund loan balance in the history of the program (compared to $30 billion in inflation-adjusted debt in 1983). 17
If states had adopted forward funding, the Great Recession would not have sparked this level of financial stress. Take, for example, the minority of states that heeded the calls to follow solvency guidelines. Only 31 percent of state trust funds that met the recommended solvency level were forced to borrow between 2009 and 2012. In contrast, insolvency was nearly guaranteed in the large group of states that fully bought into the pay-as-you-go financing strategy and had less than six months of reserves in 2007, with twenty of those twenty-one states (all except West Virginia) becoming insolvent. (See Table 1.) The experience of the Great Recession bears out the actuarial advice now embodied in new Labor Department regulations.
| Table 1. State Unemployment Trust Fund Solvency, 2009 to 2012 | |||
| Solvency, by average high cost multiple (2007) | Number of states | Needed trust fund loans (2009-2012) | Likelihood of insolvency |
| 1.0 above | 19 | 6 | 31.6% |
| 0.8 to 1.0 | 6 | 4 | 66.7% |
| 0.5 to 0.79 | 7 | 6 | 85.7% |
| less than 0.5 | 21 | 20 | 95.2% |
| 95.2% | 5318 | 36 | 67.9% |
| Source: U.S. Department of Labor. | |||
The Response of States to the UI Financing Crisis
The three main responses by states to the UI financing crisis were: (1) restrictions to UI benefits, (2) alternative measures to pay off UI debts, and (3) changes to the taxable wage base.
Cutting Benefits to Historically Low Levels
Sweeping reductions to unemployment benefits have become the ironic legacy of the Great Recession—coming on the heels of an episode when millions of Americans depended on them for a lifeline. Driven by large debts and the urge to cut program costs, most states have legislated new restrictions to UI benefits.
While benefit cuts typically follow recessions, the percentage of jobless workers receiving unemployment benefits has reached record all-time lows as a result of this current wave of cuts.
While benefit cuts typically follow recessions, the percentage of jobless workers receiving unemployment benefits has reached record all-time lows as a result of this current wave of cuts. As displayed in Figure 1, the percentage of jobless workers receiving UI hit an all-time low of 26 percent in 2013, and was only 27 percent in 2014 and 2015 (see Figure 1). Certainly, recipiency rates can vary for a number of factors, and are being influenced by the unprecedented number of workers who have been out of work for more than the six-month period typically covered by the state unemployment program. Further reasons for the decline in the recipiency include rules that are out of step with the growing prevalence of low-wage, temporary, women, and part-time workers. 19 These economic trends and the wave of benefit restrictions have combined to make the UI program a weaker safety net that at any time in its history; weaker than it was when a sweeping wave of benefits restrictions drove the UI recipiency rate to 29 percent in 1984.
In 2007, all states provided a maximum duration of at least twenty-six weeks of state unemployment benefits. In other words, nearly all full-time, full-year workers who were laid off could count on having six months on UI to find work if they were eligible. Nine states (Arkansas, Florida, Georgia, Illinois, Kansas, Michigan, Missouri, North Carolina, and South Carolina) cut the maximum duration of benefits between 2010 and 2015.20 The typical reduction was from twenty-six weeks to twenty weeks, but laws in Missouri, Kansas, Florida, and North Carolina allow for cuts in UI duration as deep as fifty percent when the unemployment rate goes down. Currently, workers in North Carolina are only entitled to twelve weeks of benefits, and to fourteen weeks in Florida.
These cuts in duration represented only part of the restrictions to benefits enacted as states struggled to emerge from insolvency. North Carolina’s 2013 legislation was particularly draconian, including a new cap on the maximum weekly benefit of $350 (previously this was indexed to inflation), additional benefits cuts to seasonal workers, repeal of rules allowing UI for individuals forced to quit work because of urgent personal reasons (disability, lack of child care, following a spouse transferred to a new geographic location), and new rules that would force workers to accept a lower paying job or lose their UI benefits. 21
The cuts to unemployment duration have received significant attention from policy-makers and researchers like the GAO, but they represent just a part of the widespread benefit changes. Additional reductions in benefits include:22
- Changes from single quarter to multiple quarter formulas. Indiana was one of the number of states who made a subtle but significant change in its law, from calculating benefits based on a percent of earnings in an individual’s most successful calendar quarter to multiple quarters. Since most workers have variable earnings during the year, this leads to broad-based reductions in benefits. In Indiana, the old law was calculated as benefits equaling 5 percent of the first $2,000 of a worker’s total high-quarter wages and 4 percent of the rest of the wages in that quarter, to a new calculation that is 47 percent of individual’s average weekly wage in the entire year. For example, consider a painter who earns $25,000 a year, with most of that income coming in during the summer ($10,000 in the third quarter, from July to September), when more customers want their homes painted. This individual would have received $340 under the old law, but would only receive $225 today—a 33 percent cut. Arkansas, Kentucky, North Carolina, and Rhode Island have also enacted similar changes.23
- Reductions in indexing of the maximum weekly benefit amount: An even more important change has been to the indexing of maximum weekly UI benefit amount. In 2007, thirty states had laws that automatically increased maximum weekly UI benefit amounts each year at a steady rate, along with the growth in wages, insuring that the real value of the insurance provided by UI was maintained. By 2015, a total of fifteen states had frozen or ratcheted down their calculation of the maximum weekly benefits to a lower percentage of benefits. 24 Economist Wayne Vroman found that, in states that do not index benefits, UI checks were 10 percent less in 2015 than they were in 2009.25
- Loosening of misconduct standards. Many states amended their misconduct laws to make it easier for states to disqualify workers from UI if they were fired from their jobs. These rules continue the trend in recent years to disqualify most workers from UI who have been fired for cause, rather than more egregious or intentional acts that truly represent misconduct.
Benefits restrictions continue to be considered by state legislatures, particularly those with ongoing solvency changes. Missouri enacted legislation cutting benefits in 2015, and the state of Ohio is now debating an even more sweeping proposal. The Ohio bill (HB 394) proposes cutting the duration of UI benefits to as short as twelve weeks (like North Carolina and Florida), eliminating additional benefits for dependents, and freezing the maximum weekly benefit amount. In addition, the bill has showcased new ideas for restricting benefits:
- forcing unemployed individuals to endure an additional “waiting week” if they do temporary work during their unemployment benefit year (only North Carolina has multiple waiting weeks per year);
- disqualifying UI applicants from receiving benefits if they were dismissed for violating a rule in their employee handbook (the most stringent rule in the nation);
- requiring workers to have earned wages in two out of the past three quarters (one of the strictest rules in the country); and
- deducting every dollar of Social Security benefits from unemployment benefit checks and disqualifying individuals receiving disability benefits from UI (the most stringent rule in the nation). 26
The changes proposed in Ohio would have cut $4 billion from unemployment benefits by 2025, amounting to a 41 percent cut in benefits, and would not have required any increase in employee taxes to restore the trust fund.27 While a broad-based coalition of concerned advocates has caused the state to reconsider the proposal, the danger of future cutbacks in Ohio and beyond is clear.28
While a firm statistical link between benefit cuts and the national decline in recipiency rate has yet to be established, the correlation is evident. Georgia, North Carolina, and Florida all have recipiency rates that have dropped below 15 percent of the unemployed, and a rigorous analysis has found that states that have significantly reduced the maximum unemployment duration have seen a much faster decline in recipiency rates than other states.29 With unemployment benefits now covering a smaller percentage of each unemployed individual’s spell of unemployment, six out of every seven jobless individuals in these Southern states going without benefits, the legitimacy of the unemployment safety net as a universal program has been called into question.
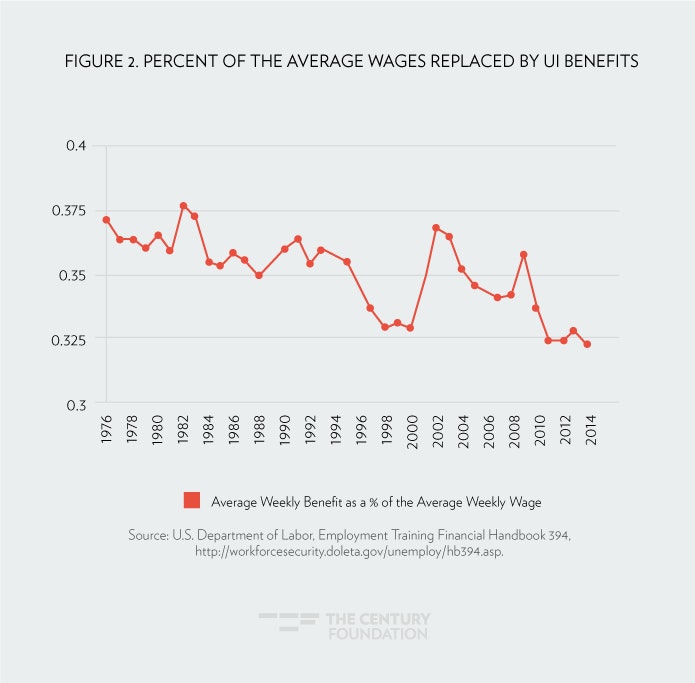
Unemployed individuals are bearing the brunt of the cost of returning UI funds to solvency, even though benefits generosity cannot be blamed for the poor condition of unemployment trust funds before the recession. Figure 2 shows the most widely accepted measure of the value of UI benefits—the ratio of the average weekly unemployment benefits to the average weekly wage of workers.30 The generosity of benefits had been declining since the mid 1970s, and hit its lowest level in fifty years in 2014. The low levels of replacement seen from 2010 to 2014 indicate that the cuts to benefits are beginning to take their toll. With jobless individuals less likely to receive benefits, and the benefits less valuable, policy-makers should be looking squarely at the financing side of the equation as the cause of solvency problems.
Looking Beyond Tax Revenues to Repay Loans
The depth of the financing crisis starting in 2010 strained the core UI financing mechanisms. The political economy of state legislatures struggled to enact sufficient premiums to repay loans and provide a strong safety net for workers.
In this climate, eight states (Arizona, Colorado, Idaho, Illinois, Michigan, Nevada, Pennsylvania, and Texas) turned to the private bond market for lower interest rates and longer payback periods for the federal funds they had already borrowed. Bond proceeds account for $11.4 billion of the loans paid back by states since the financing crisis began in 2010.31
States who turned to the private market will remain in debt longer than states paying back loans through increased UI premiums, with private loan balances now making up the majority of remaining UI debt.32 With the exception of Colorado, which indexed their taxable wage base, states that relied on the private bond market did not turn the crisis of UI insolvency into an opportunity to put their trust fund on a path to long-term solvency. States that have bonded their UI debt made smaller adjustments to their taxable wage base (averaging just $700) than states that used traditional financing (which average an increase of $2,260).
Bonding and spreading the UI debt across many years appears to have enabled these states to avoid a strategy of cutting benefits to return to solvency. The states that have bonded have above-average UI recipiency and, with the exception of Michigan, have not made the deep cuts in benefit packages. Bonding can be a tourniquet to stop the bleeding in UI trust funds and prevent the cancer of major benefit restructuring, but it is not a cure for the diseases of imbalanced UI financing.
Bonding can be a tourniquet to stop the bleeding in UI trust funds and prevent the cancer of major benefit restructuring, but it is not a cure for the diseases of imbalanced UI financing.
Federal tax increases are also playing a larger role in paying back unemployment loans, with states relying heavily on credit reductions initiated by the Federal Unemployment Tax Act (FUTA) to pay back UI loans. Employers in states with a UI program in good standing receive a $392 credit against the $434 per worker statutory tax, and pay $42 per employee. If states are unable to pay their loans back, this credit is reduced and employers pay more each year. In the past, FUTA credit reductions were looked at as a last resort for states that were unable to develop a solvency plan due to state gridlock even two years after having a trust fund debt. In contrast from 2010 to 2015, twenty-five states turned to federal credit reductions—with half of those states forcing a $63 per worker or more increase on employers in their state after having a trust fund debt of five years or more. Federal tax increases have become normalized, and in fact revenue from these increases already makes up $10 billion of the $39 billion in loans paid back since 2011.
The experiences of California and Connecticut are instructive. California failed to enact solvency legislation—instead employers will pay more than $9 billion in increased federal unemployment taxes to pay back their largest in the nation’s largest trust fund debt.33 Connecticut provides another example—state taxes have not been sufficient to pay back trust fund loans. So rather than apply for a waiver, federal taxes have increased to a highest-in-the-nation $189 per employer in 2016. When business interests are seeking reductions in benefits, it was wiser for the state to utilize increased federal taxes to return to UI solvency.34 In fact, Connecticut will pay off their debt in 2016 with no solvency legislation enacted and thus completely relying on FUTA credit reductions. The widespread use of FUTA credit reductions points to a larger role for federal revenues for the core UI program—if states are unable to provide the necessary tax rates, the federal government should develop a forward thinking revenue model.
Increasing the Taxable Wage Base
When the UI and Social Security programs were started in the 1930s, each program’s taxes were charged to the first $3,000 of a worker’s wage. In 2015, the Social Security tax base is automatically indexed to inflation, and at $118,500, covers approximately 83 percent of all earnings.35 By contrast, the federally established minimum taxable wage base for UI benefits has not been changed since 1982, and is not indexed to inflation. The taxable wage base in 2015 ranges from a high of $42,100 in Washington state to the minimum taxable wage base of $7,000 in three states (California, Arizona, Florida) and Puerto Rico.
The UI tax is tremendously regressive, especially in the states with the lowest taxable wage base. In California in 2015, an employer would be charged the same amount of taxes ($357 at the average UI tax rate) for a software engineer earning $125,000 as it would be charged for a fast food worker earning the state average of $20,250 per year.36 The resulting effective tax rate of 1.76 percent for the fast food worker is six times higher than 0.29 percent for the engineer.
UI tax rates are experience rated, meaning that taxes are increased on particular employers as they lay off more employees (typical maximum tax rates are between 7 and 9 percent). Experience rating provides an automatic countercyclical increase in UI revenues. But these increases in recent years have been charged to a shrinking portion of worker payrolls; meanwhile, benefits are calculated based on a historically steady portion of prior paychecks. The result is a system that is generally structurally insolvent and unable to recover past charges. Nineteen states automatically index their UI taxable wage base to growth in their state’s economy, which greatly increases the effectiveness of revenue recovery systems. Indexed taxable wage bases are the single most important feature of solvent trust fund systems. In these states, modest amounts of additional revenue are collected each year, happen without state legislative action and are evenly spread across all employers.
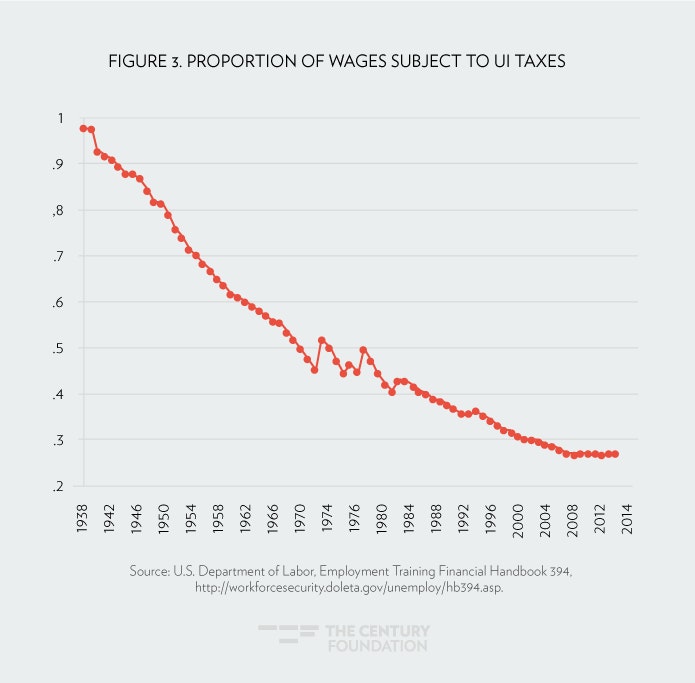
However, the vast majority of wages in the country—including in all but two of the largest thirteen states (New Jersey and North Carolina)—are in states that do not have indexed taxable wage bases.37 Figure 3 shows the steady decline in the proportion of wages subject to UI taxes. This taxable wage proportion (TWP) was just 26.9 percent in 2014, down from an average of 30.5 percent in 2000 and from 37.6 percent in 1990. In general, state UI systems are not subject to indexing and have become increasingly unstable over recent decades.
During the recovery, from 2010 onward, states dealing with solvency problems commonly relied on increases in (but not indexing of) taxable wage base:
- two states (Colorado and Vermont) began utilizing an indexed taxable wage base; New York will begin indexing in 2021;
- three states (Tennessee, Illinois, and Missouri) adopted a flexible wage base that modifies the base in modest increments, depending on the condition of the trust fund; and
- sixteen additional states increased their taxable wage base in fixed amounts, with the average increase being $3,450.
The average taxable wage base in the United States grew by 26 percent from 2007 to 2015, compared to just 14 percent in the previous seven years. These one-time wage base increases contributed positively to revenue growth in these states, and the better than expected trust fund savings described above.38
However, as indicated by Figure 3, these increases have not reversed the long-term decline in the structure of UI financing. The taxable wage portion has remained unchanged from 2011 to 2014. In other words, these one time changes were only enough to keep up with overall national inflation. If states do not act to index their taxable wage bases, their tax systems will again become out of step with growth in the economy, undermining chances to build up sufficient reserves.
The Result of State Responses Is an Unprepared UI System
The time has come for a serious look at the preparation of unemployment trust funds for the next recession. The current economic recovery is now eighty months old (approaching seven years). The average period of economic recovery during the post war era is fifty-eight months, and while the U.S. economy has weathered global challenges, economists warn of a recession in the next two years.39 So, it is now critical to study the solvency impacts of recent trends—as well as any possible progress absent federal or state action—to understand how close states will come to forward funding before the next recession.
Despite favorable economic conditions, UI trust funds are still a long way from stabilizing. Net UI trust funds held at the U.S. Treasury reached $31.2 billion by the end of December, or about 81 percent of the pre-recession trust fund balance of $38.3 billion. The Department of Labor estimates $8.5 billion in outstanding principal owed by states that went to the municipal bond market to finance their unemployment trust fund debt.40 When all UI obligations are included, trust funds are closer to 59 percent of their pre-recession level. Remember, this pre-recession level represented the worst funding level for state unemployment trust funds before any recession in the history of the program. And, at best, we are a little more than half way back to even that sorry benchmark.
Trust Fund Savings Have Not Been Up to Par with the Scale of the Recession
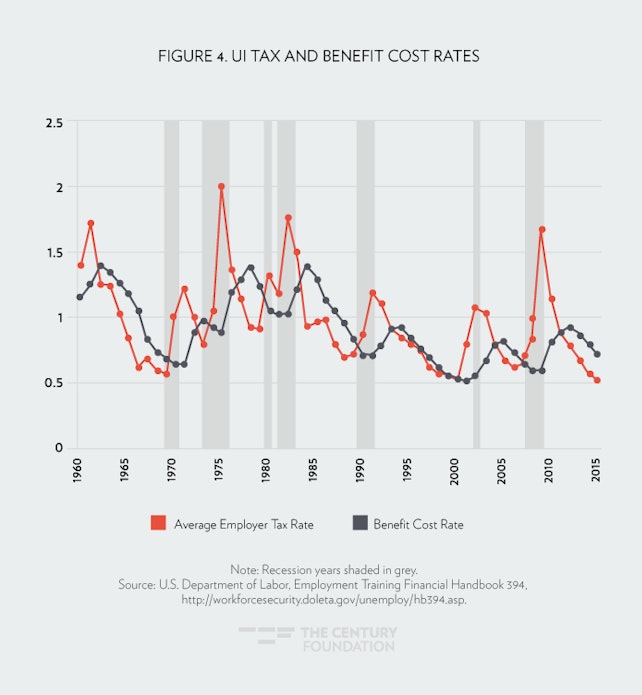
As compared to other recent economic recoveries, the experiences of the post-2009 recession represent better savings, but not nearly enough to turn the overall trust fund situation around. Figure 4 illustrates the key inflows (state UI taxes) and outflows (benefits), each as a percentage of the total wages of individuals insured by the program, with recessions shaded. The difference between the values of the two lines represents trust fund savings (or loss). From 1984 to 1989, UI tax rates exceeded benefit costs by an average of 0.26 percent of wages for six years, which resulted in modest but continual savings by the program; these savings turned to losses during the recession of the early 1990s. The switch to pay-as-you-go financing meant that UI taxes only narrowly exceeded benefits during the long recovery of the 1990s—taxes exceeded benefits for five years at a rate of just 0.05 percent from 1994 to 1999, and savings were nearly as low from 2004 to 2007. Turning to the post 2009 recession, UI tax rates did not exceed UI benefit rates until 2012, three years after the official end of the recession. Since then UI tax rates have exceeded UI benefits by an average of 0.19 percent of wages during this four year period—more savings, but still much lower than the 1980s-level savings that would be needed to recover from any steep recession.
The result is that most states are not yet prepared for another recession. Table 2 displays the status of unemployment trust funds in the fifty states. As of the end of 2015, just eighteen states have again reached the recommended level of UI trust fund solvency. Fourteen of those states had entered the most recent recession prepared with proper reserves, and the only four whose solvency has improved compared to 2007 are in areas with very low unemployment rates (South Dakota, Minnesota, Iowa, and Idaho).
| Table 2. State Solvency Update | |||||
| State | AHCM 2015 | Trust Fund Balance | Private Loans | Taxable Wage Base | Recipiency Rate |
| Alabama | 0.75 | $445,381 | $8,000 | 18% | |
| Alaska | 1.51 | $447,612 | $38,000 | 37% | |
| Arizona | 0.11 | $102,435 | $7,000 | 17% | |
| Arkansas | 0.70 | $384,596 | $12,000 | 31% | |
| California | 0.00 | -$6,588,067 | $7,000 | 32% | |
| Colorado | 0.37 | $681,242 | $249,925 | $11,800 | 27% |
| Connecticut | 0.02 | $24,681 | $15,000 | 38% | |
| Delaware | 0.35 | $72,367 | $18,500 | 31% | |
| District of Columbia | 0.97 | $351,252 | $9,000 | 15% | |
| Florida | 0.88 | $2,666,016 | $7,000 | 12% | |
| Georgia | 0.57 | $941,923 | $9,500 | 14% | |
| Hawaii | 1.21 | $474,738 | $40,900 | 31% | |
| Idaho | 1.27 | $458,959 | $50,075 | $36,000 | 27% |
| Illinois | 0.14 | $1,540,765 | $998,195 | $12,900 | 31% |
| Indiana | 0.02 | $26,645 | $9,500 | 18% | |
| Iowa | 1.25 | $943,249 | $27,300 | 37% | |
| Kansas | 0.78 | $456,522 | $12,000 | 25% | |
| Kentucky | 0.00 | -$6,766 | $9,900 | 22% | |
| Louisiana | 1.28 | $904,485 | $7,700 | 17% | |
| Maine | 1.09 | $356,864 | $12,000 | 30% | |
| Maryland | 0.76 | $957,920 | $8,500 | 26% | |
| Massachusetts | 0.27 | $925,786 | $15,000 | 41% | |
| Michigan | 0.09 | $2,689,824 | $2,381,645 | $9,500 | 26% |
| Minnesota | 1.06 | $1,664,584 | $30,000 | 41% | |
| Mississippi | 1.82 | $599,969 | $14,000 | 17% | |
| Missouri | 0.35 | $377,526 | $13,000 | 22% | |
| Montana | 1.48 | $309,990 | $29,500 | 39% | |
| Nebraska | 1.71 | $390,813 | $9,000 | 24% | |
| Nevada | 0.09 | $447,023 | $355,825 | $27,800 | 28% |
| New Hampshire | 1.12 | $289,375 | $14,000 | 20% | |
| New Jersey | 0.33 | $1,194,644 | $32,000 | 44% | |
| New Mexico | 0.07 | $250,992 | $23,4000 | 21% | |
| New York | 0.05 | $288,062 | $10,500 | 34% | |
| North Carolina | 0.61 | $1,362,916 | $21,700 | 13% | |
| North Dakota | 0.75 | $132,881 | $35,600 | 40% | |
| Ohio | 0.00 | -$432,039 | $9,000 | 24% | |
| Oklahoma | 2.00 | $1,153,135 | $17,000 | 26% | |
| Oregon | 1.77 | $2,843,548 | $35,700 | 30% | |
| Pennsylvania | 0.00 | $966,815 | $2,372,610 | $9,000 | 43% |
| Puerto Rico | 0.98 | $440,945 | $7,000 | 20% | |
| Rhode Island | 0.25 | $131,920 | $21,200 | 31% | |
| South Carolina | 0.37 | $307,378 | $14,000 | 13% | |
| South Dakota | 1.52 | $99,458 | $15,000 | 14% | |
| Tennessee | 0.85 | $915,945 | $9,000 | 15% | |
| Texas | 0.00 | $1,304,925 | $2,121,170 | $9,000 | 27% |
| Utah | 1.78 | $946,273 | $31,300 | 21% | |
| Vermont | 1.27 | $1,285,704 | $16,400 | 26% | |
| Virgin Islands | 0.00 | -$69,407 | $22,900 | 39% | |
| Virginia | 0.68 | $769,747 | $8,000 | 15% | |
| Washington | 1.31 | $3,873,638 | $42,100 | 35% | |
| West Virginia | 0.25 | $82,372 | $12,000 | 32% | |
| Wisconsin | 0.43 | $746,895 | $14,000 | 30% | |
| Wyoming | 2.35 | $345,993 | $24,700 | 27% | |
| Source: U.S. Department of Labor, State Solvency Report, http://www.ows.doleta.gov/unemploy/docs/trustFundSolvReport.pdf. | |||||
State Trust Funds Are Ill-Prepared for a Recession of Any Size
Six years into our current economic recovery, a greater level of trust fund solvency is needed. At the moment, the majority of states are not prepared to face another recession. Overall, the number of states with adequate trust funds right now is even worse than the very low level achieved in 2007 (six years into that era’s recovery) when nineteen states were solvent. And trust fund health is much, much worse than it was six years after the recession of the early 1990s, when thirty-three states met preparation standards, and six years after the 1980s recession, when twenty-eight states were prepared (see Figure 5).
Some have questioned the need to build up a trust fund that can withstand a recession as large as the most recent one, as it may have been a historical anomaly. But, state trust funds are now woefully prepared for a recession of any size, let alone another repeat of the Great Recession. Figure 6 reveals that the majority of trust funds would not even have enough in their unemployment trust funds to weather a recession as mild as the one experienced in 2001 (the mildest recession in the post-war period). That is because they do not have savings to pay out at the rate of the peak years of even these less-demanding periods.
Further Trust Fund Savings Will Not Bring the Majority of the Program to Forward Funding by the End of 2017
The continued jobs recovery has given states room to build up their trust fund balances, and could lead to some further improvement before the next recession. Most of the growth in state unemployment trust funds since 2010 occurred during 2015, when state trust funds gained $14.8 billion in net value (which is nearly half of the net $31 billion held in trust funds at the end of 2015). With most states paying off their trust funds loans by 2015 (only five states still had loan balances by the end of the year), states in 2015 were able to begin the process of rebuilding their trust funds.
Table 3 models what it would take for trailing states to reach full levels of recession preparation by the end of 2017, if they continued to use the economic recovery to rebuild trust funds at the pace they did in 2015.41 The tax rate that would be required to meet this gap are displayed, and calculated as the amount needed to cover low baseline levels of benefits and generate trust fund savings up to the AHCM of 1.0.
| Table 3. The Path to Solvency | |||||
| State | Solvency Target1 | Gap from Current Trust* | Tax Rate Needed | 2015 Tax Rate | Gap Per Employee |
| Alabama | $657,939 | $212,558 | 0.46% | 0.47% | na |
| Arizona | $1,062,484 | $960,049 | 0.73% | 0.44% | $145.67 |
| Arkansas | $612,914 | $228,318 | 0.90% | 1.03% | na |
| California2 | $13,610,191 | $17,063,905 | 1.67% | 0.80% | $561.96 |
| Colorado3 | $1,285,213 | $603,971 | 0.73% | 0.59% | $77.87 |
| Connecticut2 | $1,454,096 | $1,219,508 | 1.49% | 0.91% | $407.19 |
| Delaware | $232,088 | $159,721 | 0.84% | 0.70% | $78.56 |
| District of Columbia | $390,648 | $39,396 | 0.36% | 0.50% | na |
| Florida | $3,359,360 | $693,344 | 0.28% | 0.50% | na |
| Georgia | $1,823,850 | $881,927 | 0.48% | 0.37% | $60.30 |
| Illinois3 | $4,356,986 | $2,816,221 | 1.23% | 1.00% | $132.46 |
| Indiana | $1,690,116 | $1,663,471 | 1.09% | 0.68% | $188.26 |
| Kansas | $648,690 | $192,168 | 0.65% | 1.05% | na |
| Kentucky | $1,035,214 | $1,041,980 | 1.33% | 0.80% | $236.61 |
| Maryland | $1,371,096 | $413,176 | 0.73% | 0.62% | $61.20 |
| Massachusetts | $3,667,404 | $2,741,618 | 1.58% | 1.29% | $204.99 |
| Michigan3 | $3,853,882 | $1,164,058 | 0.84% | 0.90% | na |
| Missouri | $1,163,932 | $786,406 | 0.73% | 0.43% | $142.73 |
| Nevada3 | $1,099,712 | $652,689 | 1.37% | 1.17% | $95.31 |
| New Jersey | $4,005,254 | $2,810,610 | 1.74% | 1.13% | $397.39 |
| New Mexico | $403,063 | $152,071 | 1.00% | 1.43% | na |
| New York | $6,848,045 | $6,559,983 | 1.17% | 0.70% | $352.60 |
| North Carolina | $2,877,440 | $1,514,524 | 0.59% | 0.86% | na |
| North Dakota | $187,730 | $54,849 | 1.07% | 0.62% | $246.47 |
| Ohio2 | $2,887,806 | $2,848,881 | 1.20% | 0.61% | $289.86 |
| Pennsylvania3 | $5,001,930 | $4,035,115 | 1.84% | 1.20% | $343.51 |
| Puerto Rico | $496,495 | $55,550 | 1.04% | 1.04% | na |
| Rhode Island | $566,616 | $434,696 | 2.11% | 1.54% | $287.78 |
| South Carolina | $901,085 | $593,707 | 0.67% | 0.78% | na |
| Tennessee | $1,191,805 | $275,860 | 0.38% | 0.34% | $20.32 |
| Texas2 | $4,929,300 | $3,624,375 | 0.84% | 0.52% | $186.65 |
| Virgin Islands | $25,513 | $92,047 | 5.77% | 0.90% | $1,798.80 |
| Virginia | $1,209,868 | $440,121 | 0.39% | 0.48% | na |
| West Virginia | $355,240 | $272,868 | 1.70% | 0.99% | $289.11 |
| Wisconsin | $1,908,820 | $1,161,925 | 1.17% | 1.19% | na |
| Total | $77,171,823 | $58,461,665 | na | na | na |
|
1 Projected trust fund needed in 2017 to reach an AHCM of 1.0 2 FUTA credit reductions are not included in the GAP per employee. Loan balances are reduced by estimated enhanced FUTA revenue 3 Debt held privately not included in this calculation * Dollars are in thousands Author’s analysis of multiple U.S. Department of Labor sources, including U.S. Department of Labor, Employment Training Financial Handbook 394, and Average Employer Contribution Rates by State. |
|||||
In fact, surprisingly, there are twelve states that would generate sufficient savings to reach forward funding by the end of 2017, if their 2015 tax rates remained in effect for 2016 and 2017. These states are Alabama, Arkansas, the District of Columbia, Florida, Kansas, Michigan, New Mexico, North Carolina, Puerto Rico, South Carolina, Virginia, and Wisconsin. This list is striking because of the role that benefit restrictions are playing in states that are moving toward forward funding. Most of these states have low UI recipiency or have enacted benefit cutbacks. They are trading a solvent trust fund for a program that has much less economic value to their state’s economy. Overall, states in Table 3 that are approaching solvency have UI recipiency rates that are 20 percent lower (6 percentage points) than those that have further to go to reach solvency.
The overall UI savings rates is slated to decline in coming years, and even many of these states will not make it to forward funding by the end of 2017. UI tax rates are largely determined by experience rating, with employer tax rates in many states being determined by the percent of each employer’s workforce that has used the UI system over the past three years. By 2016, tax rates will be based on three years of low benefit payouts. The Department of Labor estimates that UI revenues will fall to $40.5 billion by the end of fiscal year 2017 (down from $53 billion in 2012).42 This would mean that the UI tax rate would fall from the 0.72 percent national average in 2015 to somewhere closer to 0.65 percent. A safe prediction is that, under current law and economic conditions, only about six more states would reach the recommended solvency level by the end of 2017.
In the other twenty-three states, there is clearly no path to forward funding under current law. The average state (excluding the Virgin Islands, which is an outlier) would have to charge an additional $215 per employee over each of the next two years to reach full recession preparation by 2015.43 It is some of the largest states (California, New York, Pennsylvania, Illinois, Ohio) that have the farthest to go and would have to enact tax increases that are not politically practicable. In fact, 63 percent of all wages insured by UI are in these twenty-three states, which even by 2015 were not charging enough in taxes to have a path to full trust fund solvency by the end of 2017. As a result, most of the UI program will face the next recession at serious risk of having to borrow money again from the federal government. And, because of new federal rules enacted in 2010 that require states to achieve full trust fund solvency in order to qualify for interest-free borrowing, they will have to pay interest on federal loans in the thick of a recession, making the path to solvency even steeper.
Recommendations
The current state of UI financing cries out for further reform. State UI funds were woefully unprepared for the Great Recession, with the result being unprecedented indebtedness. Now six years into an economic recovery, states are not even close to being back to where they started, let alone prepared for the next recession. A notable minority of states have adopted sound financing principles and are running programs that are solvent and paying decent benefits. Unemployment benefits have been significantly cut back—as they had been after the 1980s recession—but the economic recovery has not yet been strong enough and the solvency changes not robust enough to turn state trust funds around. This has wound up being the worst of both worlds—states are not moving quickly to solvency, and the benefits families count on have been undermined.
A policy framework that relies on state taxes collected exclusively from employers does not seem geared to the task of building forward funded UI systems. Over the past two decades, the system has steadily moved toward insolvency, which should cause policymakers to revisit fundamental principles of UI financing—who pays UI taxes, and the role of federal oversight.
Changing Who Pays for UI—The Case for Employee Financing
Employee taxes provide a fresh approach to tackling chronic solvency challenges of UI financing. Experience-rated employer contributions were justified at the start of the program by the idea that they would deter companies from laying off workers. Economic research finds that workers bear most of the true economic cost of UI taxes in the form of lower wages, but policymakers and the business community typically describe them as an employer cost.44 Employee contributions, a key feature for other social insurance schemes—Social Security, Medicare, and most recently, paid family leave—would recognize the value that workers and their families place on having UI benefits.
The experiences of the small minority of states that have employee contributions point to other positive attributes of employee contributions. Pennsylvania, New Jersey, and Alaska all have employee contributions as a feature of their UI programs. 45 Alaska employee taxes range between 0.50 percent and 1.00 percent of the taxable wage base, depending on the state of trust fund—in 2016, $198.50 per worker, per year. In New Jersey, the tax is 0.3825 percent of the taxable wage base, which is equivalent to $106 per worker, per year in 2015. Employee contributions in Pennsylvania are 0 percent to 0.08 percent of all wages, 0.07 percent in 2015, which was $36 per worker, per year.
It is no coincidence that these three states are among the top of the country in terms of UI recipiency, and other key economic security measures of the program, such as the maximum weekly benefit amount. In most states, employers claim UI trust fund dollars are “their money” and have leverage to demand benefit reductions instead of tax increases. The major cutbacks to benefits in Florida and North Carolina offer vivid examples of what happens when a one-sided business cost analysis of UI shapes the political discourse. Employee contributions shift the dynamic, giving worker advocates a seat at the table when solvency legislation is debated. For example, Pennsylvania adopted an employee contribution during the financing crisis of the 1980s as part of a deal to stave off benefit cuts. Pennsylvania’s employee contribution is only triggered when unemployment trust fund solvency drops below the target level.46 While “it was a difficult compromise for us to accept,” labor union officials in the state credit employee contributions with creating the kind of balanced political dynamics needed to maintain a strong UI program despite the often hyper-partisan atmosphere in Harrisburg.47
Employee contributions shift the dynamic, giving worker advocates a seat at the table when solvency legislation is debated.
The impact of employee taxes goes beyond these policy advantages. Interviews with officials in these states indicate a strong signaling value for employee contributions. A visible payroll deduction for UI provides “the cheapest way possible to advertise UI” in the words of a former New Jersey Department of Labor official.48 Moreover, individuals seeing an employee contribution on their pay stub feel like UI is insurance that they have paid rather than a form of welfare, with claimants in New Jersey going as far as to waive their pay stubs aloft during unemployment hearings.
One reason that employee contributions have not gotten more attention in UI solvency is that this policy alone has not allowed these three states to maintain UI trust fund solvency. While Alaska is consistently one of the most solvent UI trust fund programs, New Jersey (ranked thirty-seventh by the end of 2015) and Pennsylvania (still insolvent in 2015, when private loans are factored in) are not solvent. Modest employee contributions in these states have not been able to cover larger factors influencing UI solvency, namely, policies that diverted billions of then-solvent New Jersey UI trust funds to charity hospitals, and Pennsylvania’s low, un-indexed, taxable wage base. Employee contributions need to be part of an overall sound structure to achieve forward funding.
Constructed correctly, employee taxes could be a dramatic win-win for the future of UI. Employee taxes could provide badly needed revenue to the program and enable it to respond more effectively to recessionary spikes in benefits and build up adequate reserves. Moreover, employee taxes could fundamentally shift the political economy of UI, encouraging more workers to apply for benefits and providing a political counterweight to calls to restrict benefits. Employee contributions could be implemented in two ways:
- State reforms. Individual states could follow the lead of Alaska, Pennsylvania, and New Jersey and enact employee contributions as part of state-specific policy reforms. These employee contributions could increase when the overall UI trust fund balance drops, and be conditioned on maintaining adequate benefits for workers. Proposals would be particularly important in states that might face another period of large trust fund loans, should a recession occur in the next several years, and where worker advocates need new tools to prevent benefit reductions and shore up UI trust funds. One strong argument for employee taxes versus benefit reductions is that taxes spread the costs of insolvency evenly across the working population, rather than balancing them on the backs of the small minority of jobless workers who need UI.49States should follow the model recommended by Pennsylvania, which charges UI taxes on each worker’s paycheck to maximize the progressivity of the tax. A relatively small tax on workers’ wages in each state—one that would generate $107 per employee on average when states were insolvent—would close half of the average gap between a state’s current trust funds and the UI solvency target. A tax of this size would only amount to 0.2 percent on the average annual wage of $52,000, and would generate $7.3 billion dollars per year if applied to only those states needing additional revenue to achieve trust fund solvency.50 The size of a state employee tax in each state would vary based on overall taxes. A rule of thumb is that employee taxes should add 15 percent (the current rate of the average states with employee taxes) to 25 percent on top of employer taxes at their highest rate (closer to the $107 per employee figure mentioned above) depending on the solvency of the fund. Interviews with state officials pointed to this figure as enough to engender awareness of the program but not too much to put an undue burden on low-wage employees.
- Federal. As described above, states have depended on federal unemployment tax increases to pay back their UI trust fund debts. This is a tacit recognition that states alone are politically unwilling to enact the level of taxation needed to stabilize the UI program. A federal unemployment (FUTA) tax on workers would be a strong revenue source to modernize and standardize unemployment benefits, as it would demonstrate the willingness of beneficiaries to pay for the change. This major change in federal UI policy would only make sense, from an equity and political viability perspective, if used to strengthen both the financing and effectiveness of the program for working families. These federal dollars should be conditioned on an automatic program of federal extended benefits; a strong set of minimum benefit standards in the states, including twenty-six weeks of benefits; an indexed maximum weekly benefit amounts in each state; coverage reforms that accommodate low-wage, women, part-time, and temporary workers; work-sharing programs to prevent layoffs; and additional benefits to workers enrolled in UI training programs. Key provisions like a maximum duration of 26 weeks of benefits should be enshrined as amendments to the Social Security Act. To facilitate these improvements, employee taxes should be equivalent to 25 percent of the current benefits paid out by the system–$10.2 billion per year. This would require a tax of $92 per employee tax on all employees who are currently in taxable employment (equivalent to $1.77 per week). This level of tax would be sufficient to give programs additional revenue to gain forward financing over a five year period, and still have additional resources to invest in benefits improvements.
Seeding Income Security for Gig-Economy Workers
Large numbers of Americans now work as independent contractors for gig economy platforms such as Uber and as freelancers in general. These workers are excluded from the UI system because they don’t have an employer to make contributions on their behalf, because they are classified as independent contractors. An employee contribution could provide the seed funding for individual unemployment accounts that could be administered by state UI programs. While the details of the scheme would have to be worked out, each individual freelancer would build up a balance in the account held by the state through monthly contributions. Freelancers could qualify for benefits after a minimum number of contribution months, and withdraw them under a series of self-attested conditions about the lack of work. A first step could be for the Department of Labor to provide seed funding for states to pilot such a program with a group of freelance workers.
Building on Key Proposals in the Obama Administration Budget
Congress should build on the key concepts embodied in the Obama administration’s 2016 budget request.
- Increase and index the federal UI tax base: Indexing and increasing the federal taxable wage base is the single best way to spur states to generate the kind of revenue needed to restore UI solvency, and make UI taxes more progressive. A straightforward proposal would be to set the taxable wage base at 100 percent of the average annual wage in taxable employment (approximately $52,000 in 2015), and keep it at that level going forward.51The effective tax rate should be reduced to the limit the impact on employers’ tax as Obama has proposed in his 2016 budget.52 The most important change is to index any future increase in the taxable wage base, which would effectively require all states (including big insolvent states like California) to follow suit.
- Use FUTA credit reductions to build up solvency. The president’s budget includes a groundbreaking proposal worthy of consideration. Current rules automatically increase federal unemployment taxes on any state that has a zero UI trust fund balance during two consecutive years. The budget proposal applies those same rules to any state that is only halfway to the federal solvency target (0.5 AHCM) for two years in a row, with proceeds added to the state trust fund account until the 1.0 AHCM is reached.
- Establish a federal minimum tax. All employers should make meaningful contributions into the UI program each year, as a large amount of unemployment benefits cannot be charged back to a specific employer accounts.53 Twelve states charge minimum rate employers $10 per employee or less—in Kansas, three out of five employers paid the minimum tax rate of $9 per employer in 2015. The minimum tax rate should be set between $70 per year (equivalent of the national median) and $113 per year (the national average).54
Additional Federal Proposals
Below are additional policy actions that federal policymakers could take.
- Require minimum adequate tax rates. The Department of Labor has defined the minimum adequate tax rate as the average benefit cost rate over the past ten years, plus an amount to build the trust fund to a full solvency level in five years.55 Congress could require states to charge this minimum tax rate, or face increases in federal UI taxes until they achieve the recommended level of solvency.
- Reward states that achieve solvency. States that achieve an AHCM of 1.0 should receive an interest premium. Congress should give the secretary of labor to vary rates to incentivize savings, as long as they are to be cost neutral as compared to current interest rates.56
- Make stronger recommendations for insolvent states. The Department of Labor now publishes a state solvency report with the minimum adequate financing rate calculation for each state. The department should take the next step and issue, in a clear program letter, both the minimum adequate financing rate and the minimum taxable wage base under the current tax structure that would get to UI solvency within five years. Furthermore, the department should conduct or commission research to examine whether trust fund triggers in each of the states are set at the recommended federal target.
- From loans to grants. Congress could give the Department of Labor the authority to make solvency grants, based on so-called Reed Act transfers of federal unemployment funds to the state made during both the Bush and Obama administrations. These grants, which would not have to be paid back, could be conditioned on states adopting reforms to their state tax structure that provide a clear path to forward funding within five years.
Recommendations for States
While federal action is needed, states will continue to be the main venue for UI policy debates. Here is a short list of actions for state policymakers to consider over the next several years.
- Index the taxable wage base. All states, including those states that made one-time increases from 2010 to 2014, should index these rates to increases in the state’s average annual wage. This is the only way to sustain gains in trust fund solvency.
- Resist the siren calls for tax cuts. As states achieve large nominal trust fund balances, we can expect legislators to call for UI tax cuts. States should not intervene in legislative tax schedules in the period between 2016 and the start of the next recession. This is the best time to build up trust fund balances.
- Restore benefit cuts. As states repay their trust fund loans, reductions in state UI benefits should be revisited. With many of the states making the largest cuts gaining significantly in solvency, states would be wise to revisit the impacts of cuts on working families and the appropriate long-term actuarial approach from the current conditions to recommended levels of solvency. Many states making cuts have proceeded rapidly to trust fund solvency and could afford to restore benefits and still meet their funding goals.
Conclusion
The economic recovery represents a golden opportunity to revisit the financing of the UI system. Now is the time for federal policy makers to make the changes needed to restore the solvency of the lifeline for the economy and working families.
The author would like to thank George Wentworth, Patsy Wescott, Ron Wilus, Sharon Dietrich, Rick Bloomingdale, Zach Schiller, Shayna Strom, Wayne Vroman, and Indivar Dutta-Gupta for helpful information and comments on this report.
Notes
- Improving Economic Security by Strengthening and Modernizing the Unemployment Insurance System,” White House Fact Sheet, January 16, 2016, 11, https://www.whitehouse.gov/the-press-office/2016/01/16/fact-sheet-improving-economic-security-strengthening-and-modernizing.
- http://workforcesecurity.doleta.gov/unemploy/docs/trustFundSolvReport2016.pdf; U.S. Department of Labor Unemployment Insurance Chartbook, http://workforcesecurity.doleta.gov/unemploy/chartbook.asp ; U.S. Department of Treasury, Unemployment Trust Fund Report, https://www.treasurydirect.gov/govt/reports/tfmp/tfmp_utf.htm , Authors analysis of Department of Labor data
- U.S. Department of Labor, UI Quarterly Data Summary, 3rd Quarter 2015, http://workforcesecurity.doleta.gov/unemploy/content/data_stats/datasum15/DataSum_2015_3.pdf.
- Arloc Sherman, “Safety Net Programs Lift Millions From Poverty, New Census Data Show,” Center on Budget and Policy Priorities, http://www.cbpp.org/blog/safety-net-programs-lift-millions-from-poverty-new-census-data-show.
- Portia Wu, “Interest Rate on Title XII Advances During Calendar Year (CY) 2015,” Unemployment Insurance Program Letter No. 7-15, U.S. Department of Labor, January 20, 2015,http://workforcesecurity.doleta.gov/dmstree/uipl/uipl2k15/uipl_0715.pdf.
- Technically, states that have a loan balance on January 1 of two consecutive years, and still have that balance on November 10 of the second year, have federal unemployment taxes go up by 0.3 percent on the first $7,000 of each employee’s paycheck.
- U.S. Department of Labor, “Significant Measures of State UI Tax Systems,” 2014, http://workforcesecurity.doleta.gov/unemploy/pdf/sigmeasuitaxsys14.pdf
- Advisory Council on Unemployment Compensation, Report and Recommendations, February 1994.
- Rick McHugh, “Bond Financing For Insolvent State Unemployment Insurance Trust Funds,” National Employment Law Project, http://www.nelp.org/content/uploads/2015/03/bond-final1.pdf.
- Loans were interest free until the 1980s. States had no incentive to repay loans, and loan balances ballooned in the 1970s.10 Marc Baldwin, “Beyond Boom and Bust: Financing Unemployment Insurance in a Changing Economy,” National Employment Law Project, http://www.nelp.org/content/uploads/2015/03/Financing-Unemployment-Insurance-in-a-Changing.pdf.
- Loans were interest free until the 1980s. States had no incentive to repay loans, and loan balances ballooned in the 1970s.
- U.S. Department of Labor, “Federal-State Unemployment Compensation Program; Funding Goals for Interest-Free Advances; Final Rule” Federal Register 75, no. 180 (September 17, 2010), http://webapps.dol.gov/FederalRegister/PdfDisplay.aspx?DocId=24246. In addition, states must meet a maintenance of tax effort criteria that they have not cut taxes by twenty percent in any years since they have reached solvency, and that taxes are at least equal to 75 percent of benefit payments in the past five years.
- An AHCM compares the trust fund as a size of the state’s insured wages by takes the three most recent high cost years (in either the past twenty years or three recessions whichever is longer) in benefits as a percentage of all wages insured.
- Wayne Vroman, “Unemployment Insurance in the Great Recession,” Urban Institute, December 2011 http://www.urban.org/sites/default/files/alfresco/publication-pdfs/412462-Unemployment-Insurance-and-the-Great-Recession.PDF.
- U.S. Department of Labor Employment Training Administration, Handbook 394, http://workforcesecurity.doleta.gov/unemploy/hb394.asp, and Jake Grovum, “Why State Unemployment Trust Fund Debt Matters,” Pew Charitable Trusts http://www.pewtrusts.org/en/research-and-analysis/blogs/stateline/2014/04/29/why-state-unemployment-trust-fund-debt-matters.
- Mike Evangelist, “Lessons Left Unlearned: Unemployment Insurance Financing after the Great Recession,” July 2012, http://www.nelp.org/content/uploads/2015/03/UI_Solvency_Paper_Final.pdf?nocdn=1.
- There are fifty-three UI jurisdictions: the fifty states, Washington, D.C., Puerto Rico, and the Virgin Islands. This report uses the term state to refer to all fifty-three.
- Stephen Wandner and Andrew Stettner, “Why are many jobless workers not applying for benefits?” Monthly Labor Review, June 2000 http://www.bls.gov/opub/mlr/2000/06/art2full.pdf.
- Illinois has restored their program to twenty-six weeks.
- “Kicking Jobless Workers While They’re Down: Unemployment Insurance in North Carolina after the 2013 Legislative Session,” North Carolina Justice Center, http://tarheelworkers.org/wp-content/uploads/2013/01/HB4-Fact-Sheet_FINAL.pdf.
- See for example, United States General Accountability Office, “Unemployment Insurance, States’ Reductions in Maximum Benefit Durations Have Implications for Federal Costs,” April 2015, http://www.gao.gov/assets/670/669802.pdf.
- Several states are now using four quarters, such as Indiana, and several are using two quarters.
- These states were Arkansas, Hawaii, Illinois, Kansas, Kentucky, Louisiana, New Mexico, North Carolina, Pennsylvania, Rhode Island, South Carolina, Vermont, the Virgin Islands, West Virginia, and Wisconsin.
- Wayne Vroman, “The Big States and Unemployment Insurance Financing,” The Urban Institute, March 23, 2016, 7.
- Amendments to HB 394 on January 12, 2016 eliminated these restrictions and reduced the social security offset to 50 percent of benefits.
- Zach Schiller, “Testimony to the Ohio House Insurance Committee,” December 2, 2015, http://www.policymattersohio.org/testimony-unemployment-dec2015.
- “Catherine Candinsky, “Bill to overhaul Ohio unemployment compensation to be reworked,” Columbus Dispatch, February 12, 2016, http://www.dispatch.com/content/stories/local/2016/02/12/bill-to-overhaul-unemployment-compensation-to-be-reworked.html.
- Rick McHugh and Will Kimball, “How Low Can We Go? State Unemployment Insurance Programs Exclude Record Numbers of Jobless Workers,” March 9, 2015, http://www.epi.org/publication/how-low-can-we-go-state-unemployment-insurance-programs-exclude-record-numbers-of-jobless-workers/.
- This is an estimate of wage replacement, as it includes the average weekly wage of all workers not just those who have been laid off and eligible for unemployment benefits.
- Bonds are typically paid back by new employer assessments.
- U.S. Department of Labor, State Unemployment Trust Fund Solvency Report 2016, http://oui.doleta.gov/unemploy/docs/trustFundSolvReport2016.pdf.
- California Employment Development Department, Unemployment Insurance (UI) Fund Solvency Report, http://www.edd.ca.gov/About_EDD/pdf/edduiforecastoct15.pdf and http://www.edd.ca.gov/about_edd/pdf/edd-uiforecast13.pdf.
- Connecticut Association of Business and Industry “State Employers Paying Highest Unemployment Taxes in U.S.,” November 20, 2015, http://www.cbia.com/news/issues-policies/state-employers-paying-highest-unemployment-taxes-in-u-s/.
- Social Security Administration, Contribution and Benefit Base, https://www.ssa.gov/oact/cola/cbb.html.
- Bureau of Labor Statistics, “Occupational Employment and Wages, May 2014 35-3021 Combined Food Preparation and Serving Workers, Including Fast Food,” http://www.bls.gov/oes/current/oes353021.htm.
- Vroman, “The Big States and Unemployment Insurance Financing.”
- Ibid., 7.
- Bill Lucia, “Economists Tell Governors That a Recession Is on the Horizon,” Route Fifty, http://www.routefifty.com/2016/02/nga-governors-recession/126085/.
- Ronald Wilus, U.S. Department of Labor, e-mail to author, February 16, 2016.
- The estimates use Moodys economy.com estimates of state employment growth and CBO estimates private wage and salaries through 2018, available at https://www.cbo.gov/about/products/budget_economic_data.
- U.S. Department of Labor, Unemployment Insurance Outlook, President’s Budget FY 2017, February 9, 2016, http://workforcesecurity.doleta.gov/unemploy/pdf/prez_budget.pdf.
- The gap per employee is simply the difference between the needed tax rate and the 2015 tax rates multiplied by the average wage of workers in each state.
- Phillip Levine, “Financing Benefit Payments,” in Unemployment Insurance in the United States, ed. S. Wandner (Kalamazoo, MI: Upjohn Institute Press, 1997).
- U.S. Department of Labor, “Comparison of State Unemployment Insurance Laws 2015,” http://workforcesecurity.doleta.gov/unemploy/pdf/uilawcompar/2015/financing.pdf.
- Pennsylvania Department of Labor and Industry, “Employer’s Reference Guide to Unemployment Compensation,” http://www.uc.pa.gov/Documents/UCP%20Forms/ucp-36.pdf.
- Interview with Rick Bloomingdale, president, Pennsylvania AFL-CIO, February 6, 2016.
- Interview with David Socolow, former New Jersey secretary of labor.
- “Restoring the solvency of the UC system in Pennsylvania,” Testimony by Sharon Dietrich to the Pennsylvania Legislature, March 6, 2015.
- These states are Arizona, California, Colorado, Delaware, Georgia, Illinois, Indiana, Kentucky, Maryland, Massachusetts, Missouri, Nevada, New Jersey, New York, North Dakota, Ohio, Pennsylvania, Rhode Island, Tennessee, Texas, Virgin Islands, and West Virginia.
- Recent proposals to increase the taxable wage base include the president’s budget proposal to increase the taxable wage base to $40,000. The Unemployment Insurance Solvency Act of 2011 proposed an increase of the taxable wage base to $15,000 and indexed from there.
- The FY 2017 budget proposes increasing the taxable wage base to $40,000 and setting the FUTA tax at 0.0167 percent or a maximum of $66.80 per employee.
- For example, survivors of domestic violence can collect UI benefits in most states and those benefits don’t cause a particular employer’s tax rate to go up on the theory that the employer did not cause the spell of unemployment. These costs are called social costs.
- The president’s budget recommended a level of $70.
- U.S. Department of Labor, “Significant Measures of State UI Tax Systems, 2014,” http://workforcesecurity.doleta.gov/unemploy/pdf/sigmeasuitaxsys14.pdf.
- A similar recommendation was made by the Congressional Advisory Commission on Unemployment Compensation in 1995.


