
The high price of college is the subject of media headlines, policy debates, and dinner table conversations because of its implications for educational opportunities, student and family pocketbooks, and the economy.1 Some people caution against giving too much weight to the advertised price of a college education, pointing out that the availability of financial aid means that college is not as expensive as people think it is.2 But they overlook a substantial problem: for many students, the real price of college is much higher than what recruitment literature, conventional wisdom, and even official statistics convey. Our research indicates that the current approach to higher education financing too often leaves low-income students facing unexpected, and sometimes untenable, expenses.
Consider how Sophie, an undergraduate enrolled in a Wisconsin public university and receiving the federal Pell Grant, felt when she found out how much she was really required to pay for higher education:
When you’re in high school you just think you’ll get financial aid in college. Well, yeah, you can get financial aid, but there’s still a lot more that aid does not cover that you have to come up with. I think it’s a little “catch”—[it seems like] all financial aid will take care of you and it doesn’t. There are a lot of things that you don’t really realize, like book expenses and food expenses and all this stuff. You don’t really necessarily think about until you have to pay for it, and then all of a sudden you’re like “whoa, whoa, whoa.”3
Financial challenges are a consistent predictor of non-completion in higher education, and they are becoming more severe over time.4 Unexpected costs, even those that might appear modest in size, can derail students from families lacking financial cushions, and even those with greater family resources.5 Improving college completion rates requires both lowering the real price of attending college—the student’s remaining total costs, including tuition, books, and living expenses, after financial aid—to better align with students’ and families’ ability to pay, and providing accurate information to help them plan to cover the real price of college.
Many policymakers argue that bringing the personal and public benefits of higher education to an expanded population of Americans is important for the economy and to address inequality. Financial aid policies, they assume, help those with scarce resources to earn their degrees. But these policies often fall short, and when students have difficulty paying for college, they are more likely to focus their energies on working and raising funds rather than studying and attending classes, and are less likely to complete their degrees.
Calculating the Real Price of College
Information about college prices comes primarily from the institutions themselves, which list their tuition and fees, along with estimated costs of books and supplies, transportation, room and board, and other expenses. This official information on the total expenditures necessary—which is tracked by the media and reported to the federal government—constitutes the “sticker price” of college. Colleges are required to make this information readily available to students and their families to assist in financial and academic planning for college. And knowledge of these figures is essential for anyone considering higher education: the average college sticker price has grown—unevenly but substantially—by approximately 10 to 25 percent (depending on sector and time period) every five years since 1995.8 More than one-third of states have frozen or capped tuition increases over the past decade, but this often has failed to substantially reduce prices, because other costs of attending college continue to rise, while investments in financial aid have not followed.9
Some observers argue that people will face living costs whether or not they are in school, and so sticker prices should not include estimates of those expenses. Going to college is not like buying a product, however, because of the time students must commit—something economists call opportunity costs. Studying and attending classes limits students’ participation in the workforce, both in terms of hours available for work and in the job schedules that students can accept. Furthermore, people who need to live near colleges and universities often face higher costs than those who can live farther away.10 By including these living expenses as part of the sticker price, the opportunity costs—and the student’s need to eat and have shelter—are accounted for.
Ireland and the United Kingdom recognize and address college living expenses with maintenance grants, and on occasion, the United States has too.11 Monthly subsistence payments for living costs were made to veterans in the original G.I. Bill, for example; and in the 1940s, when veterans reported that the subsistence payments were inadequate, the government responded by increasing them.12 Today, in contrast, living expenses are a substantial yet frequently overlooked portion of the real price of college.
For some students, grants and scholarships from federal, state, and local sources help reduce expenses to produce a lower “net price” (which is the sticker price, minus aid that does not need to be paid back). Campaigns to increase information about and access to grants are underway so that students can make college choices based on the net price they will pay, instead of the sticker price. These campaigns are an attempt to counteract students making college choices based on fears about their ability to cover their expenses.13
But even after grants are accounted for, the net price remains high for most students. About three in four Americans who attend a public university pay or borrow an amount equivalent to 20 percent or more of their annual family income to pay for a year of school. Even low-income students attending the nation’s least expensive option, community college, face net prices upward of $8,000 per year.14
Furthermore, the net price often increases as students move through college, because financial aid is frequently the most generous for a student’s first year of college, and because the sticker price often grows from year to year. Thus, a student who figures out how to cover the price of college for the first year may have difficulty advancing toward graduation, as the net price grows more substantial with each passing year. Yet policymakers tend to focus on the initial sticker price and the initial net price in their calculations of what students must pay.
In this report, we describe research conducted by the Wisconsin HOPE Lab that explains why the sticker price is often understated, while the availability of financial aid to create a lower net price is often overstated. We find that many institutions underestimate the costs of living while in college, the ancillary costs of academic programs (books, supplies), and the expenses that students face related to health care and family emergencies. We describe how these costs arise and how students experience them, drawing on three studies that utilize administrative, survey, and qualitative data. Our data suggest that these are but some of the costs unaccounted for in institutions’ statistics—in this exploratory work, we have only scratched the surface.
We also discuss evidence from several studies indicating that financial aid tends to diminish during college. These declines occur because of challenges students face when it comes to maintaining eligibility and complying with financial aid rules, but also because of institutional policies and practices that devote more grants to first-year students.8
Higher-than-expected college prices leave students struggling to pay bills as they get closer to degrees. The repercussions include added stress, debt, juggling multiple jobs, the inability to major in more expensive subjects or to add a second major or a minor, and stopping out (dropping out, then re-enrolling).15 While greater transparency and accountability for full disclosure of the true costs of college will not necessarily lead to lower prices, they should help students and families make informed decisions that help them finance their college enrollment and degree completion. At the same time, new policy approaches are needed to drive down the real price of college attendance to align with the financial realities facing today’s students.
The Official Statistics
Federal law dictates that a college’s sticker price must include tuition and fees, books and supplies, transportation, and other living costs. The items that are included and excluded are critical in determining students’ access to financial aid. With few exceptions, the total amount of financial aid a student receives cannot exceed the sticker price for the school they attend. In other words, if the sticker price is artificially low, a student may not be able to obtain all of the financial aid for which they are qualified.16
Public attention to college prices tends to focus on growth in tuition and fees over time. Between 1975 and 2015, these costs, after accounting for inflation, grew by more than 220 percent at private, nonprofit, four-year colleges and universities; by 294 percent at public four-year colleges and universities; and by 218 percent at the nation’s community colleges.17 But at the public institutions that most students attend, many of the costs of attending college do not come from tuition and fees. At the nation’s community colleges, 80 percent of the average $16,833 sticker price comes from non-tuition expenses. At public four-year colleges and universities, those expenses make up 61 percent of the total costs.18 Key among these additional expenses are costs of living (room and board), which increased by just under 80 percent, inflation-adjusted, over that same forty-year period.19
Growth in the sticker price of college has been somewhat offset by increases in grants and scholarships, but because much of that support is means-tested, this varies by family income. Eligibility for need-based grant aid (including the Pell Grant) is determined by a complicated formula that tries to compute how much a student and/or the student’s family can afford to pay for college, an amount known as the Expected Family Contribution (EFC). The federal government says that the EFC assesses “financial strength,” but the Free Application for Federal Student Aid (FAFSA) does not collect many types of critical information affecting that strength.20 For example, common forms of debt—including mortgages, auto loans, student loans, and credit cards—are not assessed. While some assets are also neglected in the calculation (for example, the value of a family’s home), most of the omitted information would likely reveal that families are less—not more—able to pay for college than the EFC suggests.21 Moreover, the EFC does not include a geographic cost-of-living adjustment. Thus, in many ways, the EFC shares common limitations of typical poverty thresholds, which fail to accurately estimate the dollar amount necessary to live in specific communities and states across the nation.22
The Wisconsin HOPE Lab’s research suggests that the EFC regularly miscalculates families’ financial strength, and that overestimates occur through a number of mechanisms. Many low- and middle-income families in the HOPE studies carry heavy debt burdens, many of which have grown over the course of the 2007–09 recession. This debt, caused most often by medical expenses or long periods of parental un- or underemployment and deeply crippling to families, is not reflected in EFC calculations and regularly leads to overestimates. For example, Lily, a student in one of the HOPE studies, found that her EFC increased significantly from her first to her second year in college. As a result, her financial aid was cut nearly in half. Her EFC had increased because her father, a dairy farmer, had to sell off the majority of his cattle in order to pay off part of a $600,000 debt. While the income from the sale of the cattle was reported on the FAFSA, his debt (and the immediate use of this new “income” to pay down the debt) was not. Lily petitioned her university’s financial aid office to review her case, and after her father drove almost two hours to deliver the documents that the office needed, Lily’s financial aid package was revised. But Lily’s case was exceptional—though many students in our studies experienced a decline in their financial aid for reasons like hers, she is the only student we have encountered whose financial aid package was revised in her favor.23
Some students experience EFC overestimates because they come from divorced or remarried families, in which an absent parent’s or a new stepparent’s income was included in the EFC, even though their resources cannot be accessed by the student. We find that this creates complex and often negative family dynamics, as students in this situation know that the parent/stepparent is receiving tax benefits by claiming support for a college student, while not providing any resources to support the student.24
Lastly, some students face EFC overestimates because the minimum value of the EFC is zero.25 Many students from very low-income families make essential financial contributions to their family’s wellbeing before going to college. They help pay the rent, transport and care for family members, buy food, and cover medical expenses. Those contributions are reduced when these students reduce their work hours in order to attend college. If these students’ family responsibilities were accounted for in the financial aid formula, their aid would account for their need to help keep their families afloat. Instead, the federal rules truncate what is in reality a negative Expected Family Contribution number to zero, limiting the amount of aid the student can receive in aid.
It is for these reasons that low-, moderate- and even middle-income families complain that the prices the government suggests they can afford are, instead, beyond their reach.26
Table 1 shows how average sticker prices and net prices changed over a decade at community colleges and at four-year public institutions. While the sticker price at community colleges grew by just over 20 percent, low-income students were largely (though not entirely) shielded from that growth: their net price over that time grew by 5 percent, to just over $8,000 per year. In contrast, moderate- income families saw a 12 percent growth in net price during that period, while middle and upper-income families witnessed 20 percent to 23 percent growth.
In contrast, at public four-year colleges and universities, growth in net price was substantial at all income levels. Even for the lowest-income families, net price swelled 23 percent, to just under $12,000 a year. Rates of change were more substantial for those with higher incomes, reflecting policy decisions intended to reserve financial assistance for families with the most financial need. But the high and rising price of college could also be part of the declining college completion prospects of even these better-off students, given that 95 percent of all American families experienced stagnant or declining real incomes during this time.27 Indeed, as a percentage of annual income that a student must pay or borrow to finance each year of college, both the sticker and net prices of college now appear quite substantial for all but the wealthiest families.28
Table 1.

Beyond the Official Statistics
In the sections that follow, we describe the price of college as it is lived on the ground, in real student situations. The descriptions are based on four studies conducted by researchers at the Wisconsin HOPE Lab, all examining hypothesis that the official sticker price and net price are both inaccurate.
- Financial aid over time. Drawing on administrative records, surveys, and interviews, a team of scholars examined the extent to which students retained or lost their financial aid as they moved from one year of college to the next.29 Data come from the Wisconsin Scholars Longitudinal Study, a six-year-long investigation of how Pell Grant recipients attending public institutions in Wisconsin experienced the price of higher education. This information is supplemented with data collected by other researchers throughout the United States.
- Costs of living off campus without family (50 percent of all undergraduates). Researchers compared the off-campus (without family) living cost allowances reported by 6,604 colleges and universities to estimates of living costs generated using data and a methodology modeled on the MIT Living Wage Calculator.30 Since federal guidance given to financial aid administrators does not specify whether students should be assumed to be living with a roommate, the researchers used multiple approaches to estimating living costs, including assuming that students live alone in a zero-bedroom (efficiency) apartment, that students share a two-bedroom apartment with one roommate and evenly divide the cost of rent, and that students’ living situations vary by age.31 Estimates of regional cost of living for institutions located within a particular county were computed using readily available government data and then compared to the living cost allowance reported by the institution.32
- Costs of living off campus with family (37 percent of all undergraduates). Federal guidance provides very little information about how institutions should compute costs for students living with their families, and does not require that living costs for students living with family be include in federal data collections. Researchers therefore examined the websites of colleges and universities to compare the estimated living costs for students living off campus with family to those living apart from family, in order to get a sense of the variation in practice. They then conducted a survey to examine whether and what students who lived at home during college paid for room and board. The survey was fielded in the first half of 2015, and included nearly 1,000 low- and moderateincome students who began attending ten Wisconsin public colleges and universities in fall 2014.33
- On-campus and other costs (the ethnography).34 To assess on-campus housing costs and the costs of academic programs and health care, HOPE. Lab researchers spent eighteen months studying students’ cost experiences at four different public universities in Wisconsin, which varied in size, academic focus, and level of institutional wealth.35 Referred to in this paper as “the ethnography,” this study involved researchers examining the lived costs experienced by a diverse group of fifty-six lowand moderate-income students during their second semester of college enrollment (spring 2015), the subsequent summer, and the start The Century Foundation | tcf.org 7 of (or what would have been the start of) their third semester in college (fall 2016).36 This is a critical time in college, as costs and academic routines begin to stabilize and students begin to make decisions about continuing, transferring, or stopping out of college. Researchers sought to understand how students perceived and experienced college costs on a day-to-day basis, how they felt about these costs, which costs had significant consequences for their academic performance and their personal wellbeing, and how these costs affected their college experiences.37
Net Price and the Declining Availability of Financial Aid
Across the nation, students are encouraged to complete the FAFSA so that they might qualify for financial aid to defray the sticker price. If they are fortunate enough to receive support, their financial aid package may include a range of loans, grants, and work-study opportunities. Deducting the total value of the grants from the sticker price leaves them with a net price. As already discussed, what they often do not realize is that the net price calculated for the first year may overstate their and their families’ ability to pay for college, and may rise over time. Grants can be difficult to retain through college, and the sticker price usually rises each year. Thus, students may see their net price grow—in many cases substantially—over the course of their college career.
Consider the federal Pell Grant, valued at almost $6,000 per year for a student who qualifies for the maximum award. Obtaining the Pell for the first year of college requires completion of the FAFSA, eligibility, and enrollment (students must enroll at least half-time to get a partial Pell, and full-time to receive a full Pell). Retaining the Pell Grant from year to year, and especially maintaining the size of the grant, requires all of those steps as well as making “satisfactory academic progress,” which includes both a grade point average requirement and a specified pace of progress (for example, completing a specified fraction of attempted credits in order to remain on track to earn a degree).
The FAFSA is difficult to complete, and the application must be renewed each year, regardless of the student’s circumstances. Even those students who remain at the same college year after year, living in the same economic conditions, with parents whose jobs do not change, must re-file. Unfortunately, many students do not know this. Nationally, 15 percent to 20 percent of first-year Pell Grant recipients in good academic standing do not re-file their FAFSA. Re-filing rates are particularly low among community college students.38 In the Wisconsin Scholars Longitudinal Study, 15 percent of students did not re-file their FAFSA, yet did attempt to enroll for a second year of college.
But students need to know more than just the re-filing requirement to maintain their financial aid. In the fall of 2014, Wisconsin HOPE Lab researchers examined awareness of the satisfactory academic progress requirements. We surveyed almost 1,100 students, all of whom had an Expected Family Contribution of less than or equal to $10,314, and all of whom would be receiving federal financial aid when they began college for the first time in September 2014. They were asked: “True or False? To continue receiving financial aid each year, students have to maintain a minimum GPA.”39
Just over one in four students (26 percent) answered the question incorrectly, indicating “false.” They were unaware they had to meet this academic requirement in order to continue receiving federal financial aid (including keeping their loans). The percentages of students who were unaware of satisfactory academic progress requirements was similar across several key demographics, including first-generation college students whose parents do not have bachelor’s degrees, continuing generation students with at least one parent with a bachelor’s degree, and students from both urban and rural communities across Wisconsin. This may help explain why large numbers of students (including, according to researchers, some 40 percent at community colleges) lose their Pell grant each year because they do not meet the satisfactory academic progress standards.40 Similarly, enrolled students are often unaware of the exact requirements for full-time enrollment and making satisfactory academic progress. One student in the ethnographic study, for example, dropped a class in order to focus on a required math class with which she was struggling. She did not realize that dropping a class would put her below full-time enrollment (less than twelve credits) and she lost much of her grant aid.41
Finally, another reason that students see their net price climb while in college is their families qualify for less financial aid. Recall that the EFC determines eligibility for many grants, including the Pell Grant. In theory, a growing family income should make it easier to pay for college. But, as described previously, this is not always the case. Take Sophie, a student in the Wisconsin Scholars Longitudinal Study, introduced earlier. Sophie’s mom was unemployed when she began college, so even though the federal government estimated that her family could contribute $3,939 to the cost of her college, they could not. Sophie had to cover it. Given her financial needs, she took federal and private loans, worked on campus at a work-study job, and also found a job at the local mall for thirty hours a week. The job frustrated Sophie because the shift schedule was rarely announced, even a week in advance. Her hours fluctuated, making it hard to plan for school, hard to participate in on-campus activities, and especially hard to pay the rent.
During her first year in college, Sophie’s mother secured a good job that paid $35,401 a year, causing an increase in her Expected Family Contribution, to $6,323. That new income rendered Sophie ineligible for the Pell Grant and the state grant, which was also tied to Pell eligibility. Moreover, since Sophie also had another private scholarship that required Pell eligibility, she lost that grant as well. To top it off, the institutional grant she got for good grades in high school was for the first year of college only. The nearly $7,000 in grants she’d received for the first year of college were no longer part of her aid package. So, for her second year of college, Sophie’s own share of the bill (even now that her mother could cover the Expected Family Contribution) increased by about $3,000.
When Sophie’s mother sought a better job, she most likely did not know that the financial aid system exacts an implicit tax on parental income.42 As parents’ salaries increase while students are enrolled in college, students are financially harmed, unless their parents are able to make up for lost financial aid with an equal contribution to college expenses. More specifically, parents need to cover both the Expected Family Contribution (which rises along with income) and lost financial aid in order to hold the student harmless. In other words, since each additional dollar of parental income reduces the child’s college grants by at least 22 cents, then the students’ costs will rise if the parent does not spend at least 22 cents of the new dollar of income on college. Many parents, including those like Sophie’s who have accrued debt while unemployed, cannot—or do not—do this.43 In these cases, when parental income increases, the net price the student must pay also increases.
In the Wisconsin Scholars Longitudinal Study, 40 percent of students who attended a public university saw their Expected Family Contribution increase between their first and second year of college. The median increase was $1,215. Between their second and third years, 36 percent of those who remained enrolled saw an increase at the median of $1,132.44 Twenty to 30 percent of those students experiencing increases in their Expected Family Contribution each year lost their Pell Grant as well as all other aid conditional on Pell eligibility. Unless their families were willing and able to pay the increased Expected Family Contribution and cover the lost grant aid, the net price for college grew more expensive. The perverse result is that children whose parents are unemployed when they start college worry about losing aid if their families’ income increases.45
Institutional actions can also cause net price to rise. A financial aid practice known as “front-loading” (but experienced more as “bait-and-switch pricing”) involves colleges focusing grants on recruiting incoming students rather than continuing to fund grants to continuing students. As many as half of all colleges and universities are thought to utilize this approach, which on average increases the net price from the first to second year of college by about $1,400.46 In making their college choice as a freshman, students focus on learning about their financial aid package for the first year, but often do not have any way of knowing whether their grants will continue in the years that follow.
For a number of the students in the ethnography, this led to difficult and sometimes destabilizing surprises during the second year of college. In interviews with researchers, most of the students in the study could not explain the exact terms of all of the grants, scholarships, and loans they had received during their first year. They did not know about satisfactory academic progress requirements, understand which grants were linked to each other (so that if they lost one they lost the other), and did not know the time horizon for many smaller grants and scholarships. For a small number of students, whose financial aid packages declined significantly from the first to the second year, these changes resulted in students transferring to two-year colleges to live at home, transferring to cheaper four-year colleges, and stopping out after their first year of college.
Estimating the True Cost of Living
Living costs are included in the sticker price listed for each college and university. But these are based on estimates—and the United States does not field a national survey of student expenditures, even though many European countries do.47 This raises an important question: To what extent does official data on the costs of living in college reflect the true costs that students face?
Living Cost Allowances
The federal government requires institutions to report estimated costs of living on and off campus in the form of “living cost allowances” included in the sticker price.48 When completing the FAFSA, students indicate where they plan to live during college, and their resulting financial aid package reflects that information. Colleges and universities typically assume higher living cost allowances for students living on campus compared to off campus, and assume higher costs for students living off campus apart from family compared to living with family. The government gives institutions a great deal of latitude in how they produce these estimates. The Federal Student Aid Handbook for 2014–15, which is published by the Department of Education to guide financial aid administrators, simply states:
There are a variety of methods to arrive at average costs for your students: periodic surveys of your student population, assessing local housing costs or other pertinent data, or otherwise use reasonable methods you may devise which generate accurate average costs for various student cohorts.49
Advice from professional associations of financial aid administrators suggests conducting surveys of students and using expenditure diaries to estimate costs.50
These methods, however, measure what students are spending, not what they need to spend. This point is critical: if students are under-resourced and thus eliminating key expenses, for example by reducing food intake or relying on friends for their transportation needs, expenditures will underestimate the full needs of students, resulting in an understated sticker price. As detailed below, in both the Wisconsin Scholars Longitudinal Study and the ethnography, we found that many low-income students eliminated expenses related to food, academic programs, and a range of necessities—from toilet paper to basic health and dental care—in order to try to stay in college.
While the collection of accurate cost and expenditure information is notoriously difficult and error-prone, universities are expected to produce it without any special training.51 Furthermore, even though many colleges and universities understand their responsibility to provide students with accurate information, university administrations and admissions and financial aid offices face incentives to look affordable. Raising their sticker price may cause a reduction in applications and a slide in national or regional college rankings. In the worst-case scenario, a big increase could also trigger an investigation by the media or the government.
Unsurprisingly, there is a great deal of variation and inconsistency in living cost allowances across colleges and universities in the same region. For students living off campus but not at home, the Wisconsin HOPE Lab study reports:
The difference between the 25th percentile and the 75th percentile [of institutions] for reported total nine-month living costs for off-campus students not living with family is $4,000–$5,000—an amount that exceeds the total published charges for most community colleges. While actual living costs within these geographies may well be variable, this magnitude of variation— especially among institutions with lower allowances—may lead students to face vastly different resource constraints depending on how their institution computes the allowance.52
The estimated costs of living while in college vary significantly within the same geographic region, depending on which institution a student attends. Moreover, the accuracy of these figures is questionable, since many institutions’ allowances sharply diverge from estimates created using publicly available data on living costs by region. Between 20 and 34 percent of colleges and universities nationwide report living cost allowances in their sticker price that are at least 20 percent below the costs of living in that region estimated from actual cost data (the range is based on assumptions about living arrangements). In contrast, just 13 percent of institutions report allowances that appear higher than the actual costs of attendance. Two-year and vocational colleges, which enroll disproportionate numbers of low- and moderate-income students, appear to be the most likely to understate the true costs of living off campus.53 These data raise questions about the accuracy of institutionally estimated living costs—one of the largest components of the sticker price.
Living with Family
Thirty-seven percent of undergraduates live at home with their parents while in college, including 39 percent of dependent students, 36 percent of independent students who do not have children of their own, and 33 percent of undergraduates with children of their own.54 Living at home is often assumed to be a cost-savings strategy—48 percent of families say that their children live at home during college to save money.55 When reporting the sticker price (and the net price), colleges and universities are not required to include any living costs for these students. In other words, they are allowed to assume that because they live at home, these students receive support from their families and accrue no costs for room and board.56 The Federal Student Aid Handbook simply tells financial aid administrators, “For students without dependents living at home with their parents, this will be an allowance that you determine.”57
Thus, at Miami Dade College in Florida, the sticker price includes an estimated $8,455 expense for room and board for students living off campus, but estimates that expense at just $2,345 for students living at home.58 At the City University of New York, a student living off campus faces estimated room and board costs of $10,386, while a student living at home is expected to face just $1,918 in living costs over nine months.59The University of California at San Diego budgets $9,650 for housing and meals if a student is living off campus, but just $4,643 if they are living with parents.60 Further north, the University of California–Berkeley budgets $7,184 for housing and utilities for a student “living in an apartment” versus $2,616 for one “living with relatives,” and also assumes the latter student saves 47 percent on their food costs.61 At the University of Wisconsin–Eau Claire, while off-campus students are estimated to face room and board costs of about $7,000 and are allowed another $3,000 in expenses for transportation and other expenses, if they live at home they are estimated to have total costs of only $4,630 for the combined expenses of food, utilities, transportation, and personal expenses. The University of Wisconsin–Milwaukee assumes that students who live with parents face no costs for their room at all.
In practice, when colleges estimate low costs for students living with family, living at home reduces students’ eligibility for financial aid, including loans, unless a student succeeds in convincing a financial aid officer to utilize their professional judgment and increase their budget. But as noted earlier, this seems to rarely happen.62
Is it the case that living at home is quite inexpensive, as institutions’ estimates suggest? While there are no available data from national studies to examine this issue, surveys and ethnographic research in Wisconsin suggest that the answer is often no. Some students who live with family continue to incur significant costs, from paying rent and other bills, to buying groceries, to providing care for children and elders (and thus significantly diminishing students’ available work hours). In a survey conducted in 2015 with more than 1,500 low- and moderate-income undergraduates, researchers at the Wisconsin HOPE Lab found that 77 percent of the 238 students living at home with parents provided monetary support to their families. Three in four students purchased groceries and/or provided money for food, and 39 percent contributed to the rent or mortgage. Over the academic year, 54 percent of students living at home paid at least $100 to their families, while 16 percent paid at least $500.63
In some cases, financial arrangements may be more complicated. Rather than pay rent or food, students may be asked to cover other costs incurred by the family. During the Wisconsin Scholars Longitudinal Study, we encountered students who paid for their mother’s car insurance, or a younger sibling’s tuition. Betty, a student in the ethnography, lived on campus during her first year of college, but then moved off campus for her second year to live with her aunt. She went to live in her aunt’s house because she received less financial aid in her second year than in her first, and she was trying to save money. The decrease in financial aid was due to Betty’s estrangement from her mother during her first semester in college; when she filed the FAFSA for her second year, she was forced to use her father’s information. He had a much higher income than her mother, but lived in another state and had stopped provided support to his children years before. Betty’s estrangement from her mother reflected family dynamics that also destabilized her younger siblings’ lives. When Betty moved in with her aunt, her younger sister did as well, and Betty soon learned that her aunt expected her pay for her sister’s expenses (such as food, clothes, furniture). Betty’s costs of living were as high as they would have been had she lived apart from family, but she received less financial aid. To cope, she worked two jobs, more than 40 hours a week in total, which undermined her academic performance.
Universities seem to assume that students save substantially when they live with their parents. Some do. But others do not. Wisconsin HOPE Lab research indicates that the latter is particularly true for young adults from economically fragile families—for whom the price of college is especially important. In low-income families, students are often critical sources of support to their families. Students frequently contribute money, time, or both, even as their families often provide essential emotional support and encouragement. Student responsibilities are rooted in norms of interdependence, obligation and reciprocity, and they help ensure the family’s economic survival. The true costs of college for students living at home may well include the continuation of these responsibilities.
Living on Campus
Living on campus is associated with higher rates of college graduation, and many institutions urge their students to occupy their residence halls64 or require it for first-year students.65 But institutions are not merely doing so to retain their enrollment: typically, residence halls are self-supporting units that are considered auxiliary enterprises on campus, generating revenue for the institution.66 At public research universities, average revenues from auxiliary enterprises (which also include hospitals and other options) increased from just over $9,000 per full-time-equivalent student in 2000 to almost $11,500 in 2010 (in constant 2010 dollars), and during that same period swelled from just under $18,500 to over $23,000 at private research institutions.67 Universities generally offer students greater proximity to school in exchange for higher rents than they would pay off campus. There are exceptions—in very expensive parts of the country, well-endowed universities such as Columbia and Stanford offer their students a better deal on campus than they would face off campus.68 But students often pay a premium to live closer to where they attend class, and in some cases, the institution requires them to pay this premium.
For students living on campus, costs are based on what the university charges for its residence halls and meal plans. At three of the four universities in the ethnography, first-year students are required to live on campus. As required by law, on-campus housing costs are included in the sticker price. Three of the four universities, however, list a single price for on-campus housing, despite the fact that there is, on average, a thirty-six-percentage-point difference in the cost of the least expensive versus the most expensive housing option on campus.69 For example, at one university the price for nine months of on-campus housing ranges from $4,000 to $5,700. While a student’s official budget is usually modified to reflect the actual cost of their on-campus housing once this is assigned, this variation affects their ability to plan for their costs on an annual basis, posing particular difficulties for students who do not end up in the cost-level of housing they budgeted for. Another university in the ethnography provides only a single cost point for housing and also does not clarify on its housing application forms that some of the residence halls with additional services cost more. During the summer before she began college, one of the students unknowingly signed up for more expensive housing in her effort to take part in a “living-and-learning community” that offers more built-in academic support than in other housing. By the end of her first semester, her college savings were entirely depleted and she had to increase her work hours and cut vital expenses (such as food) to make it through her second semester.
The quality of campus housing tends to be associated with the price, with more expensive housing options offering more amenities, such as all-you-care-to-eat food services, coffee houses, meeting and study rooms, air conditioning, exercise facilities, and learning communities. The ethnographic data indicate that students paying lower prices for a less-equipped residence hall often do not realize that they then must pay additional costs for those amenities, if they can be purchased at all. Some of these amenities could reasonably be considered “perks” for which students could or could not choose to pay. Others, however, may represent important resources that all students should be able to access. For example, living-and-learning communities are considered a high impact college experience that can improve student retention, especially for low-income students.70 All-you-care-to-eat food services may represent the only sites where a student can receive a full meal without paying additional meal plan points.
Regardless of the price of their on-campus housing, students reported varied and substantial hidden on-campus living costs across all four universities that the ethnographers studied. One university required students to purchase “official” bedding, which cost $300. Another levied a $100 “first year dorm fee.” A university mandated a $300 “security deposit” that was not advertised, while another added a $100 charge when students bunked their beds to address small room sizes. Students who had been encouraged to live in living-and-learning communities encountered additional fees for those arrangements, ranging from $200 to $1,000 per year. Almost all students reported having to pay charges upward of $50 for repairs to residence hall rooms.
In addition to housing, students are also often required to have meal plans if they live on campus. Most students in the ethnography described meal plans as having significant hidden costs. On-campus food costs exceeded the sticker price estimates because food plans often included large administrative fees (often over $700) that were deducted from students’ food purchasing power, students were often unable to claim all of their meal-plan dollars, and students had to spend more than expected to get a full meal. Since meal plans were often complicated and varied significantly across campuses, it is not surprising that the hidden costs students faced also varied across the universities.
At one of the universities in the ethnography, students were offered two types of plans. The first plan provides a specific number of meals per week that must be used during set times of the day. Students must show up to consume the meal during the designated time, or they lose the funds allocated for that meal. Those who miss meals because of work, family, or other obligations simply forfeit those funds. The more commonly used plan provides a set number of meal points rather than meals. Although students pay $8.46 for each meal point, the points have a different cash equivalency during different hours of the day. For example, at breakfast a meal point can buy a student only $3.75 worth of food, while at dinner it can buy a student $5.50 worth of food. Regardless of the time, meal point equivalencies rarely cover the full cost of meals, and so students often have to purchase additional “dining dollars” to round up the value of their meal points. Researchers found that a salad that cost $7.00 if paid with cash during the dinner hour required one meal point (for which the student originally paid $8.46) plus $1.52 in dining dollars. As a student at that university said: “I thought ‘I have 175 meal points; that will get me 175 meals.’ Yeah, right.”
Meal plans also include administrative fees that are not evident to students. For example, students at one university did not realize that almost one-fifth of the money ($771) they paid for their meal plan was an administrative fee, and would not be available to them for food purchases.
The campus dining service is a multimillion dollar business, bringing income into many campuses. But the meal plans make profit more from some students than from others. Students who can only afford the least expensive plans seem to overpay the most. Their meal plans have the least purchasing power, including, for example, just two meals per weekday and none on weekends on one campus. Students on the lower-level meal plans report running out of food with weeks still left in the semester. Administrative fees disproportionately penalize students who attempt to conserve their meal points and roll them from term to term. Dining services makes money off of “missed meals” and extra “dining dollars,” and working students are more likely to miss meals.
When students’ meal plans run out, they do not always have disposable income to buy additional food. This usually happens toward the end of the semester, or at the end of the academic year, right as students are preparing for exams and are least able to add work hours or identify additional loan sources. Students whose meal plans ran out before the end of the semester responded to this new financial pressure in a number of ways. Better-off students often bought bulk foods (such as granola bars or jerky) from a supermarket and ate them for the remaining weeks. Others cut back to eating just one full meal a day, or eating only rice, ramen, or other nutritionally marginal foods for days at a time in order to make it through the end of the semester.
The Hidden Costs of Academic Fees, Books, and Supplies
Base tuition fees, as well as differentiated fees by major, are usually clearly presented in the sticker price. Segregated fees, which may pay for services as diverse as health services, sports, library services, and student unions, are included in the official numbers as well. But other fees associated with academic coursework are excluded. Across the four universities in the ethnography, students paid additional fees for a wide range of courses, including introductory English and math classes; art, dance, and recreational sports classes; science classes; and online class sections. For example, at one university, when spaces for a required introductory English class filled up, students on the waiting list were told that they had to sign up to take the class online. Without notice, they were then charged an “online course fee” of more than $250.
Students reported being charged fees for placement exams, which usually cost $25 to $75 per exam, and one-time deposits of $100 or more that must be paid before first-year students could register for classes. They encountered hidden fees associated with assessments and equipment costs needed to receive certifications, and with certain majors; at one campus, global studies majors were required to participate in expensive study abroad activities. Indeed, most “high impact” activities, such as study abroad and living-and-learning communities, required extra fees from students, even when they were required for majors.
Students in particular majors (such as nursing, business, or engineering) often faced hidden program costs. For example, pre-nursing students had to pay out of pocket for vaccinations, lab work, and the complete physical that are required to job-shadow at hospitals, and for other degree-related work once they are accepted into the nursing program. These prices usually ran above $400. All of these costs are directly related to students’ programs of study and to their future career goals, but are not included in the sticker price. A number of students in the study changed majors (commonly switching out of STEM majors), in part because they felt they could not afford the hidden costs associated with their desired majors.
Students also reported a wide range of hidden fees and costs related to their academic programs. These included unexpectedly high charges for textbooks and specialized equipment for classes or majors (particularly science and art majors), charges for printing out weekly homework assignments, and high late fees for laptops and library readings. As with housing and food costs, university policies often appeared to favor students who had more to invest in their education to begin with. For example, if students have their own laptop, universities provide them a range of free software, services, and repairs. In contrast, if a student has to borrow a laptop from the university, they face $5 to $20 fines for every hour over the brief borrowing period they are allowed (often forty-eight hours). Short, nonrenewable rentals and high late fees mean that students with irregular access to transportation, especially those who live off campus, are more likely to incur fees than students living on or right near campus.
All told, for many students in the ethnography, these types of additional fees ranged from $75 to hundreds of dollars a semester. For example, the sticker price estimate for textbooks at one of the universities is $0 because students are charged a textbook rental fee as part of their segregated fees. Nonetheless, some courses at that university (foreign languages, writing seminars, science classes) require additional books or lab manuals not included in the rental service. At another university, some students reported paying hundreds of dollars a semester over the estimated cost of textbooks because faculty required that students buy “bundled” textbooks. Bundles block students from accessing all of the course and homework materials unless they buy (usually from the university bookstore) a new copy of the textbook and a code that will give them access to homework and other online materials. If students tried to save money by buying a used textbook, they would not receive a code and could not fulfill course requirements.71
Academic fees act as key gatekeepers for students. In the ethnography, we found students who had dropped STEM majors during their first year of college because they could not afford the textbooks for a class required for the major. Other students struggled mightily to stay in the major they desired, but felt that they were increasingly less likely to be able to complete the major because expectations for success required significant additional resources to compete for entry in the major (this was particularly true for nursing and accounting students). These hidden costs had consequences for students, not only for their major selection (and likely future employment), but also for how well they felt they would be able to complete college, and how much they felt that college was giving them a fair shot at accomplishing their intellectual and career goals.
The Hidden Costs of Health Care
Health care costs are a major burden for many Americans.72 While the Affordable Care Act was being implemented during the ethnography, students continued to face substantial expenses. During their first year of college, many students (between 21 percent and 54 percent, depending on the university) experienced health issues resulting in unanticipated costs of hundreds, if not thousands, of dollars. Unexpected health care costs most commonly arose from students needing: emergency care; third party services (such as physical therapy, psychiatric services); special exams, vaccinations, or tests associated with academic programs (such as an internship, study abroad, or volunteering position); and contraception.
Access to university health services is included in the sticker price, but there is no other mention of health costs—it is presumably part of the “miscellaneous personal expenses” category. These costs can be substantial, since university health services frequently do not cover urgent care, emergency care, third-party providers, prescription drugs, or a range of other health services students may need. Furthermore, fees charged for services by the university health clinic are often substantial. For example, at one university, students are charged up to $90 for different forms of birth control, $50 for procedures, $35 for titers, $25 for lab tests, $75 for medical supplies, $135 for immunizations, and $40 for special exams.
Students in the ethnography reported putting off health and dental care costs as long as possible. However, medical needs often increased over the course of the student’s time in college. A number of students reported experiencing a growing need for mental health care services over their first year of college; at three of the four universities, students reported that their college offered free and good-quality mental health services for minor concerns (such as stress, test anxiety), and that they benefited from these services in ways that supported their academic achievement. None of the institutions offered free mental health services beyond basic counseling, however. If a student requires psychiatric services, they have to pay for a third-party provider, which few can afford to do, or find a nonprofit organization that offers these services subsidized or free.
As they advance through college, students are more likely to find that they need access to other sorts of third-party provider services, such as physical therapy. This need is often predicated on a family history of avoiding health care costs. One ethnography student who is involved in her campus’s Reserve Officer Training Corps (ROTC) program faced the possibility of being dropped from the program (and having to pay back all of the financial aid it has provided her) because she was in danger of failing her physical training tests. Her physical training test scores were sliding because of chronic hip pain and a growing problem with bunions. She had substandard medical insurance and could not afford the large co-pays and deductibles that physical therapy incurs—$75 for the initial visit and $45 for each subsequent visit at the student clinic. Over time, the pain became unbearable, and so she decided to seek treatment, which could in turn provide a medical authorization to skip the physical training tests, which exacerbate the pain. She could only afford a few visits to the clinic, however, and was not sure what would happen to her medical authorization when she had to stop attending the clinic.
Many other students face nonemergency health and dental costs in school. Some students utilize their parent’s insurance to cover these costs or purchase coverage via the federal health insurance exchange; many, particularly low-income students, do not feel they can afford to do so and put off nonemergency health and dental expenses while in college. The costs of such delays may be significant in their future.
Revealing the Real Price of College
The public emphasis on the price of attending college and governmental initiatives around transparency and accountability imply that the price of college can be accurately calculated for each student, and that this price can (and should) be known and stated upfront. Indeed, research and policies regarding making college affordable assume that if stated prices are accurate, students and families, many of whom have limited financial cushions, will be able to budget and make decisions accordingly. But, as we have described throughout this report, stated prices are often not accurate, and students and families therefore cannot plan effectively. Moreover, the price of college is too high for an increasing number of students and families to readily meet, regardless of their level of planning.
Financial aid and institutional policies, such as how the sticker price and Estimated Family Contribution are calculated, or grants that only decrease the price for the first year of college, may exacerbate students’ difficulties paying for college over the course of their career. Unexpected prices, which often inequitably accrue to the students who have the fewest resources, result in some students—particularly lower-income students—facing increased nonmonetary costs for attending college. These nonmonetary costs range from anxiety over money and their ability to continue in college, to decreased time and energy for college activities (for example, because of added work hours), compromised nutritional status during college, strain among family members as students struggle to meet family and college expectations, social isolation, and increasing doubts about their ability to succeed in college.
The monetary and nonmonetary costs of college are often linked. For example, a student in the ethnography described the experiences of higher-than-expected college prices this way: “I never thought I’d be in as much debt as I am. I am almost too afraid to look. I try to avoid looking so I don’t have a panic attack.” Another said, “The actual cost of college drained me. It drained my savings account, my physical energy and emotional wellbeing, and my social network.”
The reasons for high college prices are diverse, but many arise from policies and formulas that can be improved through the application of research on students’ lived experiences. The Wisconsin HOPE Lab’s studies on students’ college experiences and institutional practices related to college affordability reveal a number of significant sources of variation in the real price of college faced by students. These include:
- Differences between official estimates of college prices (and the financial aid calculations that accompany these) and students’ experiences of actual college costs. Divergence between official estimates and lived experiences arises from numerous sources, including the difference between reported sticker price and the real costs of food, board, academic fees, health care costs, and so forth; the difference between Expected Family Contribution and students’ experiences of their families’ ability or willingness to provide this contribution; and students’ experiences of their ability to raise funds for college themselves (such as though work, additional loans, or gifts from relatives).
- Institutional practices that increase the estimated price of college over the course of a student’s career, but often with little warning from the perspective of the student. These practices range from federal policies (such as regulations concerning Pell eligibility), to rapid declines in state funding for colleges (as occurred in Wisconsin over the past decade) that in turn lead to rapid and unexpected increases in students’ tuition and other fees, to colleges’ common practice of providing grants to students only for the first year of enrollment.
- Changes in students’ financial needs and available resources over the course of their college career. Students in the Wisconsin Scholars Longitudinal Study and the ethnography faced higher prices as they advanced through college. At the same time, they found that their own resources for college were often drained. Savings from working over the summers and during high school were depleted, family resources available to students (especially low-income students) were limited, and many students reported facing increased nonmonetary costs for attending college. Key among these were heightened levels of self-reported stress and anxiety, concerns about fraying familial and social relationships, and increasing emotional turmoil about students’ own belief in their ability to succeed in college.
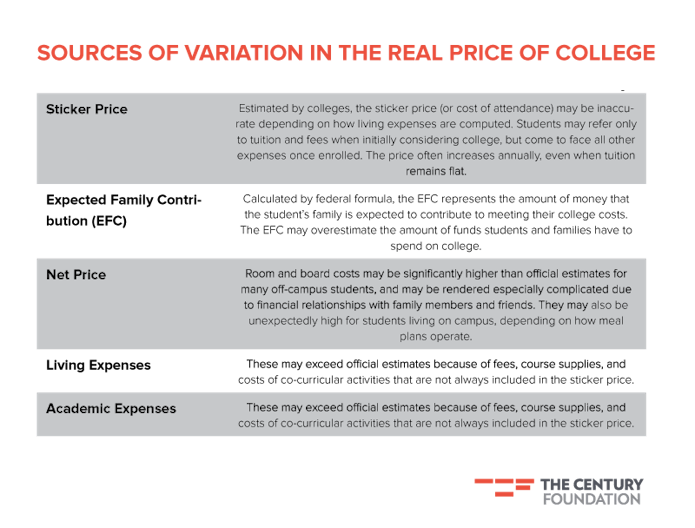
Table 2 summarizes several sources of variations in the real price of college as uncovered by our research. As noted earlier, we find that that hidden prices accrue most to the students with the fewest resources, and that the consequences of these hidden prices are destabilizing to the degree prospects of these individuals.
The consequences of monetary shortfalls in college can be severe. Students recognize and respond rapidly to deteriorating financial security while in college. Their responses take a number of forms, many of which likely undermine their ability to attend and succeed in college. First and foremost, we find that students increase the number of hours (and the number of jobs) that they work over the course of college, reducing the time available for schoolwork. Students are aware of this tradeoff, but often feel they do not have a choice if they want to stay in school.
Table 2.
Increasing work hours brings emotional and psychological consequences. The ethnography revealed that working longer hours affected students’ sense of their ability to achieve academically. One student said,
I wish I was able to spend more time on school projects or assignments in order for them to be the best they can be or spend more time at work and have more responsibilities there. Often I feel like I’m in limbo between being great at something and not being great at all.
We also found that sometimes students (particularly women) spent more time in work environments that were threatening. For example, in exchange for financial stability, a student endured sexual harassment and periodic threats to her personal safety from male student-patrons at a bar where she worked as a server. Another student continued to work in an environment that she experienced as extremely hostile and racist, which contributed to depression, affecting her grades. Without another job lined up, she could not afford to quit. These work environments directly and negatively affected students’ academic performance and, often their sense of self-worth.
Both the ethnography and the Wisconsin Scholars Longitudinal Study suggest that students have a broad repertoire of other strategies to raise additional funds for college, ranging from donating plasma, to scalping tickets to university sporting events, to reselling items. They may also take additional loans, but family and community norms of loan aversion,73 and limited access to additional credit, restrict borrowing for some.
Students also try to make the money they have stretch further, in ways that undermine them personally or academically. Common attempts to economize observed in the ethnography include self-medicating instead of paying the co-pay to see a doctor if possible; limiting the purchase of key academic supplies; reducing their use of heat, which can be risky in situations of extreme cold; limiting gas and car use to try to minimize maintenance costs; and rationing food by, for example, eating smaller portions or fewer meals per day. A recent survey by the Wisconsin HOPE Lab found that 52 percent of community college students surveyed endured at least some form of housing or food insecurity while in school. Fully 20 percent went hungry, and 13 percent experienced homelessness. Most of these students encountered these hardships even after they lowered the price of college using financial aid and worked for additional funds.74
Students also postpone or avoid costs that they view as nonessential. These include the costs of educational technologies, auto maintenance, medical procedures, professional clothing, and textbooks. In the long run, these postponements compound in ways that tend to accrue costs to those with the fewest resources. For example, the ethnographic data reveal nursing students who, having forgone examinations, vaccinations, and preventative care on account of being uninsured, found the total cost of medical procedures required for their volunteer applications excessively high. Students try to “deal with the pain” of a medical condition because of high co-pay fees. They put off going home, even if they are in emotional crisis or if there is a crisis at home, in the hopes that it will “die down.”
Cost postponement and avoidance often involves substantial risk. Avoiding medical insurance or needed medical care is dangerous. Avoiding purchasing a textbook for class is its own gamble: it results in lower textbook expenses, but also, perhaps, reduced engagement in school and lower grades. In the ethnography, we heard about one student whose financial aid did not come through as expected one semester. The student could not afford to pay for both tuition and a meal plan; in order to stay enrolled in school, she chose to pay her tuition. To cope with no longer having direct access to a meal plan, and not having enough money to buy food off campus, the student spent the semester hanging out in the cafeteria area during each meal, and when a student walked up to set down a tray, she would take and eat the leftovers. As other students soon realized what she was doing, she faced social opprobrium for her actions. Her academics suffered because of the long hours that she had to spend each day in the cafeteria in order to scrape together her meals. And the physical health repercussions included getting more colds and flus than usual—something she felt was likely brought on by sharing germs with people through their food. The student stayed in school, but the semester transformed her relationship to the college, peers, and to her studies.
Our research also finds that students sometimes resort to special pleading, such as relying on the kindness of professors, who (if one is lucky) will loan the student a copy of their book, or having to regularly ask friends or acquaintances with cars to provide free transportation when absolutely necessary. Special pleading directed at university structures, staff, or faculty generally involves generating embarrassing paperwork, often in large amounts, in which students are required to reveal the details of their social and economic situations (and often health and/or family situations). A student who had a bout of acute stomach pain and ended up in the emergency room applied to a “community fund” to cover these uninsured medical expenses that she accrued during her first year of college. She described the ER experience as follows:
I got to the ER and said, “I don’t have insurance, and I need to figure out a way to pay for this.” It wasn’t appendicitis, but they ran test after expensive test to try to diagnose the problem. When you go to the ER they have to diagnose you, you can’t leave until they figure out what is wrong with you. . . . I called my mom and told her they wanted to do a CT scan, and that costs several thousand dollars. . . . There was a long list of procedures; we were totally freaking out. I was in a lot of pain, and I was so scared. Just one of those procedures would totally put us in the hole. [The student’s insurance bill arrived at her mother’s house a few weeks later.] My mom sent me a photo of the bill. It felt like a punch in the gut. . . . The room alone was $350, and the radiology bill was like $6,000, because they ran so many tests.
She and her mother applied for assistance to the “community fund” set up to cover emergency medical care for uninsured students with financial need. Eight months later, after months of filling out paperwork documenting the family’s financial need, the situation had still not been resolved. The student described increasingly tense meetings between herself and her mother, in which all they talked about were the unpaid bills. She showed a researcher a photo she had taken: she is sitting at a table with her mother, who is looking away from her, sorting through a stack of bills.
The real price of college is often substantially higher for students than official estimates suggest. These unexpected costs have multiple effects on students’ academic, social, emotional, physical, and familial wellbeing. Students have developed a range of responses to these costs, and many are successful at staying in school (at least in the short term) because of these responses. Many of them, however, pose short- and long-term risks for students and their academic outcomes. And, in a vicious circle, many responses decrease students’ expenditures, making it appear that the price of college is lower than it should be for students who are going hungry, homeless, and ill in order to stay in college.
Rethinking the Price of College
High and unexpected college prices put students at risk and reduce their odds of successfully completing degrees that they, their families, and the nation need them to earn. Putting students up to college and then confronting them with high prices they cannot afford leads to a genuine crisis of college dropouts who carry debt they cannot repay. We can and must do better.
Efforts to sort through what each student can pay for college using complicated rationing mechanisms like the FAFSA are not always worthwhile.75 If they are reasonably accurate and help to allocate needed resources to make college affordable, then they may be useful. The FAFSA, EFC, net price, and indeed the entire financial aid system fail that test. Our current setup does not deliver accurate information, nor does it effectively identify who needs financial assistance, allocate sufficient resources, or make college affordable. The real price of college is simply too high.
What are the consequences of revealing this fact? Certainly, there are some institutional risks to a college fully documenting the real price and sharing it with students and families. They may choose to skip college or enroll at a cheaper, but lower-quality, school. To reduce this risk, it is important that national leaders—and the American public—not only rethink its assessment of whether college is affordable, but also take steps to make it affordable in practice.
There are many steps that policymakers can take to ensure that the public has a better sense of the real price of college. In order to provide families with accurate information and to ensure that eligible students receive the financial aid necessary for postsecondary success, Congress should task the Department of Education with calculating living costs for all colleges and universities, using existing federal data. At a minimum, these data should be made available to institutions, even if they are not required to use it. In the meantime, the Department of Education should develop a recommended method for colleges to calculate living costs to make it more difficult for colleges to understate the actual cost of being an engaged student.
The federal government could provide clearer guidance to institutions regarding the calculation of costs for students living with family. The assumption that a student who lives at home saves money compared to one who lives on their own should be justified with at least some data produced by the institution. In addition, the Department of Education should develop—and Congress should appropriate resources for— surveys of undergraduate expenditures. These should be fielded to examine the accuracy of the stated sticker price, and should utilize the latest methodological innovations in the study of expenditures, such as a daily diary approach.
Greater transparency about expected changes in both the sticker price and financial aid over the period of time a student is enrolled in college is also important. States should work with public colleges and universities to develop budgets that allow an entering student to have a road map of what the real price will be through to graduation. Projected tuition increases and non-tuition increases should be included, and the methodology for these estimates should be clearly explained. Building on an idea first offered by Michael Dannenberg, U.S. Representative Patrick Murphy introduced legislation in 2010 called the “Truth in Tuition Act.”76 It would have required all colleges and universities to provide a multiyear estimate of actual and net costs for students at their school. This idea should be revisited.
Colleges and universities also need to take more responsibility for whether their students are able to meet the academic requirements associated with financial aid. If a college has a satisfactory academic progress standard that large numbers of students do not meet, resulting in them losing their aid, then at minimum incoming students need to know that. The proportion of students who meet satisfactory academic progress standards should be published, and this information should be provided in the aid package distributed to students, along with clear explanations of the financial consequences of falling short.
A systematic assessment of American families’ budgets and resources for paying for college, and how these compare to the Expected Family Contributions produced by the FAFSA, would help further test many of the contentions outlined in the paper. This could be an important precursor to the reassessment of means-testing financial aid. There are alternative models, including universal public higher education, worth considering.77
Students and families all over the country are saving, working, taking out loans, and taking steps to make college affordable. Yet they still find themselves facing an unreasonably high price for college, and fall short of the resources they need to successfully complete degrees. There are clear steps that can be taken by institutions and financial aid policymakers to align students’ budgets with the actual price of college they are likely to face over the course of their college career. Doing so would not only help students succeed, but it would help institutions retain students and target aid more effectively, it would help inform current debates about financial aid reform, and it would improve the efficiency of the overall higher education financing system.
Sara Goldrick-Rab is professor of educational policy studies and sociology at the University of Wisconsin–Madison, and founding director of the Wisconsin HOPE Lab, the nation’s only translational research laboratory focused on making college affordable. Her research on inequality in higher education has been recognized with awards from the American Educational Research Association, the William T. Grant Foundation, and the National Academy of Education among others. She has played a key role in the development of federal, state, and local legislation to lower the price of higher education around the nation, and this fall the University of Chicago will publish her latest book, Paying the Price: College Costs, Financial Aid, and the Betrayal of the American Dream.
Nancy Kendall is associate professor of educational policy studies at the University of Wisconsin–Madison and an affiliate of the Wisconsin HOPE Lab. Her research examines the consequences of educational policy and programming efforts on young people’s daily lives. She has conducted multi-sited ethnography to examine college affordability policies, structural adjustment, political democratization, Education for All, orphaned and vulnerable children’s policies, abstinence only sex education, and HIV/AIDS prevention and treatment efforts on the lives of U.S. and Malawian youth and schools. The Social Science Research Council and the Spencer, Fulbright, Wenner-Gren, William T. Grant, and Lumina Foundations have supported her work. The University of Chicago Press published her first book, The Sex Education Debates, in 2012.
Acknowledgments
The authors thank the Great Lakes Higher Education Guaranty Corporation, Lumina Foundation, and William T. Grant Foundation for supporting the research described in this report, and the Century Foundation for supporting the writing. Emily Brunjes, Denise Goerisch, Esther Kim, Robert Kelchen, Peter Kinsley, David Monaghan, Franklin Vernon, and Matthew Wolfgram provided exceptional research assistance. Bob Shireman’s feedback and editing was outstanding. The arguments contained here are discussed at greater length in Sara Goldrick-Rab’s forthcoming book, Paying the Price: College Costs, Financial Aid, and the Betrayal of the American Dream, which the University of Chicago Press will publish in fall 2016.
This paper is part one in a series on College Completion supported by Pearson and published by The Century Foundation.
Notes
- 1. A. Davidson, “Is College Tuition Really Too High?”
New York Times,
- September 8, 2015; C. Hagelskamp, D. Schleifer, and C. DiStasi,
Is College Worth It for Me? How Adults without Degrees Think about Going (Back) to School
- (New York: Public Agenda, 2013).
2. S. Dynarski, “An Economist’s Perspective on Student Loans in the United States,” Brookings Institution Economic Studies Working Paper Series, September 2014; D. Leonhardt, “The Real Cost of College,” New York Times, November 19, 2009.
3. Sophie is a member of the Wisconsin Scholars Longitudinal Study, one of the four research studies that informed this paper. Her story is described in more detail later in this paper, and extensively in S. Goldrick-Rab, Paying the Price: College Costs, Financial Aid, and the Betrayal of the American Dream, (Chicago: University of Chicago Press, forthcoming 2016).
4. Goldrick-Rab, Paying the Price; M. Keels, Digging Deeper into the Psychological Costs of College: Financial Distress at the Start of College (Chicago: University of Chicago, Minority College Cohort Study, 2015).
5. K. Dachelet and S. Goldrick-Rab, Investing in Student Completion: Overcoming Financial Barriers to Retention Through Small-Dollar Grants and Emergency-Aid Programs (Madison: Wisconsin HOPE Lab, December 2015), http://wihopelab.com/publications/Investing-in-Student-Completion-WI-Hope_Lab.pdf; C. Geckeler, Helping Community College Students Cope with Financial Emergencies (New York: MDRC, 2008).
6. R. Darolia, “Working (and study) day and night: Heterogeneous effects of working on the academic performance of full-time and part-time students,” Economics of Education Review 38, no. 1 (2014): 38–50; L. W. Perna, Understanding the Working College Student: New Research and Its Implications for Policy and Practice (Sterling, VA: Stylus Publishing, LLC, 2010); R. Stinebrickner and T. Stinebrickner, “Time-Use and College Outcomes,” Journal of Econometrics 121, nos. 1–2 (2004): 243–69.
7. Conversely, making college more affordable boosts attendance and degree completion rates. J. Angrist, D. Autor, S. Hudson, and A. Pallais, “Leveling Up: Early Results from a Randomized Evaluation of Postsecondary Aid,” National Bureau of Economic Research, NBER Working Paper No. 20,800, December 2014, http://www.nber.org/papers/w20800; B. L. Castleman and B. T. Long, “Looking Beyond Enrollment: The Causal Effect of Need-Based Grants on College Access, Persistence, and Graduation,” National Bureau of Economic Research, NBER Working Paper No. 19,306, August 2013, http://www.nber.org/papers/w19306; S. Goldrick-Rab, R. Kelchen, D. Harris, and J. Benson, “Reducing Income Inequality in Higher Education: Experimental Evidence on the Impact of Financial Aid on College Completion,” American Journal of Sociology (forthcoming).
8. See “Tuition and Fees and Room and Board over Time, 1975–76 to 2015–16, Selected Years,” College Board, 2015, http://trends.collegeboard.org/college-pricing/figures-tables/tuition-and-fees-and-room-and-board-over-time-1975-76-2015-16-selected-years. This source reports growth in five-year increments, which is why we use this approach here.
9. A. Boatman and H. L’Orange, State Tuition, Fees, and Financial Assistance Policies for Public Colleges and Universities, 2005–06 (Boulder, CO: State Higher Education Executive Officers, 2006); R. Kelchen, A Longitudinal Analysis of Student Fees: The Roles of States and Institutions, Seton Hall University (no date); R. Kelchen, B. Hosch, and S. Goldrick-Rab, “The Costs of College Attendance: Trends, Variation, and Consistency In Institutional Living Cost Allowances,” Wisconsin HOPE Lab, paper presented at the annual meetings of the Association of Public Policy and Management, October 2014, http://wihopelab.com/publications/Kelchen%20Hosch%20Goldrick-Rab%202014.pdf.
10. R. Kashian and S. J. Rockwell, “Town and Gown: The Negative Externality of a University on Housing Prices,” Journal of Real Estate Practice and Education 16, no. 1 (2013): 1–12.
11. The United Kingdom is ending maintenance grants in 2016, however, replacing them with loans.
12. S. Mettler, Soldiers to Citizens (New York: Oxford University Press, 2014).
13. For example, see the White House’s Reach Higher campaign.
14. S. Goldrick-Rab and N. Kendall, Redefining College Affordability: Securing America’s Future with a Free Two-Year College Option (Indianapolis, IN: Lumina Foundation, 2014).
15. Goldrick-Rab, Paying the Price; Perna, Understanding the Working College Student.
16. According to the National Postsecondary Student Aid Study of 2012, 15 percent of Pell recipients receive federal aid in an amount equal to their student budget as determined by the institutional sticker price. This suggests that if these students were to earn additional grant support (for example from private sources) they could not receive it all—instead aid displacement would occur. This figure is based on the authors’ calculations. For more information on the problem of displacement, see Impact of Award Displacement on Students and their Families: Recommendations for Colleges, Universities, Policymakers and Scholarship Providers, National Scholarship Providers Association, 2013, https://scholarshipproviders.org/Content/Content/6/Documents/NSPA%20Impact%20of%20Award%20Displacement%209.2013.pdf.
17. Constant 2015 dollars. College Board, Trends in College Pricing, (2015), http://trends.collegeboard.org/college-pricing/figures-tables/tuition-and-fees-and-room-and-board-over-time-1975-76-2015-16-selected-years.
18. College Board, Trends in College Pricing, http://trends.collegeboard.org/college-pricing/figures-tables/average-estimated-undergraduate-budgets-2015-16.
19. College Board, Trends in College Pricing, http://trends.collegeboard.org/college-pricing/figures-tables/tuition-and-fees-and-room-and-board-over-time-1.
20. See the Free Application for Federal Student Aid, fafsa.ed.gov.
21. There is an inherent tension between complexity in the FAFSA and the desire to help as many students as possible complete the form. Our point is not that the FAFSA ought to ask more questions, but rather than the assessment of ability to pay that it provides is likely inaccurate. Additional complexity in the FAFSA is undesirable but that does not mean that errors should not be recognized. In a widely cited paper, Dynarski and Scott-Clayton examined how the distribution of financial aid would differ if fewer questions were asked (and found that it would not differ substantially) but did not consider how the distribution of aid, and critically the accuracy of the EFC, would differ if more information were considered. S. Dynarski and J. Scott-Clayton, “The Cost of Complexity in Federal Student Aid: Lessons from Optimal Tax Theory and Behavioral Economics,” National Tax Journal 59, no. 2 (2006): 319–56.
22. E. Gould, H. Wething, N. Sabadish, and N. Finio, What Families Need to Get By (Washington, DC: Economic Policy Institute, 2013).
23. Adjustments to a student’s EFC require financial aid officers to exercise professional judgment. There is no national data collected on the utilization of professional judgment but for the specific types of professional judgment that U.S. Department of Education collects data on (adjustments to the elements of a students’ EFC) we can be sure that professional judgment is not commonly used. Just 1.2 percent of Pell recipients and 0.4 percent of non-Pell recipients benefitted from professional judgment in 2013–14. U.S. Department of Education, 2014, 2013–14 Federal Pell Grant Program End-of-Year Report, http://www2.ed.gov/finaid/prof/resources/data/pell-2013-14/pell-eoy-2013-14.html.
24. M. Brown, J. K. Scholz, and A. Seshadri, “A New Test of Borrowing Constraints for Education,” Review of Economic Studies 79 (2009): 511–38.
25. The fraction of undergraduates with a zero EFC has grown over time, from 18 percent in the late 1990s to nearly 38 percent in the 2011–12 academic year. Women, students of color, and students whose parents did not attend college are more likely to have a zero EFC. R. Kelchen, “Financial Need and Aid Volatility among Students with Zero Expected Family Contribution,” Journal of Student Financial Aid 44, no. 3 (2015): 179–201.
26. K. Clark, “5 Big Financial Aid Lies,” U.S. News and World Report, April 6, 2010.
27. College Board, Trends in College Pricing (2014), http://trends.collegeboard.org/sites/default/files/2014-trends-college-pricing-final-web.pdf; U.S. Department of Education, Advisory Committee on Student Financial Assistance, “Access matters: Meeting the nation’s college completion goals requires large increases in need-based grand aid,” presentation (2013), http://www2.ed.gov/about/bdscomm/list/acsfa/ accessmattersspring2013.pdf.
28. College Board and Art and Science Group, LLC, “A Majority of Students Rule Out Colleges Based on Sticker Price,” September 14, 2012, http://www.artsci.com/studentpoll/v9n1/index.html; H. T. Rowan-Kenyon, A. D. Bell, and L. W. Perna, “Contextual Influences on Parental Involvement in College-Going: Variations by Socioeconomic Class,” Journal of Higher Education 79, no. 5 (2008): 564–86.
29. For more information see Appendix 1 in Goldrick-Rab, Paying the Price.
30. A. K. Glasmeier and W. Arete, Living wage calculator (2014), http://livingwage.mit.edu/pages/about.
31. National Association of Student Financial Aid Administrators, Developing the Cost of Attendance, monograph no. 24 (Washington, DC: National Association of Student Financial Aid Administrators, 2014).
32. Full details are contained in Kelchen, Hosch, and Goldrick-Rab “The Costs of College Attendance.”
33. All students had an Expected Family Contribution less than 200 percent of the threshold for Pell eligibility, and attended one of the following institutions: Milwaukee Area Technical College, Milwaukee School of Engineering, Northcentral Technical College, University of Wisconsin–Eau Claire, University of Wisconsin–La Crosse, University of Wisconsin–Madison, University of Wisconsin–Milwaukee, University of Wisconsin–Platteville, University of Wisconsin–Stevens Point, and University of Wisconsin–Stout. The survey response rate was 64 percent (1,562 students were surveyed).
34. Just 13 percent of undergraduates live on campus, according to the National Student Postsecondary Aid Survey of 2012.
35. This study is ongoing and is led by Nancy Kendall, Sara Goldrick-Rab, Denise Goerisch, Esther Kim, Frank Vernon, and Matthew Wolfgram. Due to Institutional Review Board agreements, we cannot name the institutions.
36. Students with an EFC at or below 200 percent of the threshold for Pell Grant eligibility are termed “low and middle-income students” in this study.
37. The students were selected, as much as possible, to reflect their university’s demographics. Two-thirds are women, half are non-Hispanic white and half are students of color, and about four in five receive the Pell Grant. Researchers used several methods to learn about the costs experienced by each student, including multiple, semi-structured interviews, repeated observations of students’ daily activities (at college and over the Summer), a campus mapping exercise, a photo-interview activity, and regular reviews of their financial aid information and academic records. The information obtained was triangulated with the official Cost of Attendance listed by each college and interviews conducted with administrators, faculty, and other university staff at each campus.
38. K. Bird and B. L. Castleman, “Here Today, Gone Tomorrow?: Investigating Rates and Patterns of Financial Aid Renewal Among College Freshmen,” EdPolicyWorks Working Paper (2014).
39. Wisconsin HOPE Lab “What We’re Learning: Satisfactory Academic Progress,” Wisconsin HOPE Lab Data Brief 15-01 (2015).
40. L. Schudde and J. Scott-Clayton, “Pell Grants as Performance-Based Aid? An Examination of Satisfactory Academic Progress Requirements in the Nation’s Largest Need-Based Aid Program,” Working Paper of Center for Analysis of Postsecondary Education and Employment (2014).
41. Part-time students are eligible for less aid than full-time students, based on the assumption that they face lower costs. While tuition and fees are often lower for these students, the cost of living is not necessarily reduced, however. It is not always possible for part-time students to secure or maintain sufficient employment to offset the reductions in their aid that come with reduced enrollment.
42. For each additional dollar of net income to a Pell recipient’s parents, the Expected Family Contribution grows by 22 to 47 cents (depending on the level of income, and assuming no dependent siblings in college). Pell Grant eligibility falls at the same rate. Pell Grants are usually not replaced by other aid unless the student has all costs covered by scholarships and grants. In a family that shares resources, losing 47 cents of the child’s Pell Grant for each dollar of additional parental income is like only taking home 53 cents of each dollar earned. For students who are considered dependent but do not share resources with their parents, the child’s Pell Grant is still reduced.
43. M. Brown, J. K. Scholz, and A. Seshadri, “A New Test of Borrowing Constraints for Education,” Review of Economic Studies 79 (2009): 511–38; A. W. Dick and A. S. Edlin, “The Implicit Taxes from College Financial Aid,” Journal of Public Economics 65, no. 3 (1997): 295–322.
44. The 40 percent figure includes 278 students from a sample of 711 in the Wisconsin Scholars Longitudinal Study who are part of this analysis. The 36 percent included 210 students from a sample of 605 students. For more information see Goldrick-Rab, Paying the Price.
45. Nationally, about one in five students with no Expected Family Contribution sees their Expected Family Contribution rise during college. Kelchen, “Financial Need and Aid Volatility among Students with Zero Expected Family Contribution.”
46. S. Burd and R. Fishman, “Ten Ways Colleges Work You Over,” Washington Monthly, September/October 2014; T. Pratt, “College ‘Bait and Switch,’” Hechinger Report, April 20, 2015.
47. The Eurostudent project is explicitly focused on the living conditions of undergraduates (see http://www.eurostudent.eu/ ) and includes data collected from about twenty nations. The United Kingdom conducts a “Student Income and Expenditure Survey” that includes a twenty-five-minute survey and a seven day spending diary that takes about five minutes a day to complete (see http://www.natcen.ac.uk/our-research/research/student-income-and-expenditure/).
48. National Association of Student Financial Aid Administrators, Developing the Cost of Attendance.
49. U.S. Department of Education, Federal Student Aid, Federal Student Aid Handbook: 2014–2015, Chapter 2, p. 3, http://ifap.ed.gov/fsahandbook/attachments/1415FSAHbkVol3Ch2.pdf.
50. National Association of Student Financial Aid Administrators, Developing the Cost of Attendance, Monograph no. 24 (Washington, D.C.: National Association of Student Financial Aid Administrators, 2014).
51. In contrast, the United Kingdom has a specialized research institute conduct its student expenditure surveys. C. Zhen, J. Taylor, M. Muth, and E. Leitbag, “Understanding Differences in Self-Reported Expenditures between Household Scanner Data and Diary Survey Data: A Comparison of Homescan and Consumer Expenditure Survey,” Review of Agricultural Economics 31, no. 3 (2009): 470–92.
52. Kelchen, Hosch, and Goldrick-Rab, “The Costs of College Attendance.”
53. Ibid.
54. We thank Robert Kelchen for these computations based on NPSAS: 2011–12.
55. Sallie Mae Corporation, “How America Pays for College: 2015,” http://news.salliemae.com/files/doc_library/file/HowAmericaPaysforCollege2015FNL.pdf.
56. National Association of Student Financial Aid Administrators, Developing the Cost of Attendance.
57. See U.S. Department of Education, Federal Student Aid, Federal Student Aid Handbook: 2014–2015 (2014), Chapter 2, pp. 3–36, http://ifap.ed.gov/fsahandbook/attachments/1415FSAHbkVol3Ch2.pdf.
58. See college’s website, http://www.mdc.edu/main/.
59. See college’s website, http://www.cuny.edu/admissions/financial-aid/estimating-costs/college-costs-overview.html.
60. See college’s website, https://students.ucsd.edu/finances/financial-aid/budgeting/undergrad-2014-15.html.
61. See college’s website, http://financialaid.berkeley.edu/cost-attendance.
62. For more information, see endnote 26.
63. For more details on this survey, see Wisconsin HOPE Lab, “What We’re Learning: Student Financial Contributions to Families—A Data Update from the Wisconsin HOPE Lab,” Data Brief 16-02 (2016).
64. L. Schudde, “The Causal Effect of Campus Residency on College Student Retention,” Review of Higher Education 34, no. 4 (2011).
65. D. Douglas-Gabriel, “Freshman Residency Rules Sometimes Force Students to Pay Prohibitive Costs,” Washington Post, September 29, 2015.
66. R. Sausner, “The Little Department That Could,” University Business, http://www.universitybusiness.com/article/little-department-could; D. Serchuk, “Hamburger University,” Forbes, September 14, 2006.
67. R. Kirshstein and S. Hurlburt, Revenues: Where Does the Money Come From? A Delta Data Update: 2000-2010 (Washington, DC: American Institute for Research), figure S2, http://www.deltacostproject.org/sites/default/files/products/Revenue_Trends_Production.pdf.
68. Douglas-Gabriel, “Freshman Residency Rules Sometimes Force Students to Pay Prohibitive Costs.”
69. Not including deposits and learning community fees. The Federal Student Aid guidance indicates that the school must list “the standard amount normally assessed most residents” for living on campus; U.S. Department of Education, Federal Student Aid, Federal Student Aid Handbook: 2014–2015.
70. G. D. Kuh, T. M. Cruce, R. Shoup, J. Kinzie, and R. M. Gonyea, “Unmasking the Effects of Student Engagement on First-Year College Grades and Persistence,” Journal of Higher Education 79, no. 5 (2008): 540–63.
71. There have been a handful of media reports on such hidden costs of college. In one, Mark Kantrowitz suggests that these additional costs can add up to an additional $300–$400 per month. See E. Chuck, “Beware Hidden College Costs: Here’s What Financial Aid Doesn’t Cover,” NBC News, April 30, 2015. EdVisors publishes a list of such costs; see https://www.edvisors.com/plan-for-college/money-saving-tips/beware-of-hidden-college-costs/.
72. L. Hamel, M. Norton, K. Pollitz, L. Levitt, G. Claxton, and M. Brodie, “The Burden of Medical Debt: Results from the Kaiser Family Foundation/New York Times Medical Bills Survey,” Kaiser Family Foundation, January 5, 2016, http://kff.org/health-costs/report/the-burden-of-medical-debt-results-from-the-kaiser-family-foundationnew-york-times-medical-bills-survey/; R. W. Seifert and M. Rukavina, “Bankruptcy Is the Tip of a Medical-Debt Iceberg,” Health Affairs 25, no. 2 (2006): 89–92.
73. A. F. Cunningham and D. A. Santiago, Student Aversion to Borrowing: Who Borrows and Who Doesn’t (Washington, DC: Institute for Higher Education Policy, 2008), http://www.ihep.org/research/publications/student-aversion-borrowing-who-borrows-and-who-doesnt; S. Goldrick-Rab and R. Kelchen, “Making Sense of Loan Aversion: Evidence from Wisconsin,” in Student Loans and the Dynamics of Debt, ed. K. Hollenbeck and B. Hershbein (Kalamazoo, MI: W. E. Upjohn Institute for Employment Research, 2015), 307–71; L. W. Perna, “Understanding High School Students’ Willingness to Borrow to Pay College Prices,” Research in Higher Education 49, no. 7 (2008): 589–606.
74. S. Goldrick-Rab, K. Broton, and D. Eisenberg, Hungry to Learn: Addressing Housing and Food Insecurity Among Undergraduates (Madison: Wisconsin HOPE Lab, 2015).
75. M. Danson, R. McAlpine, P. Spicker, W. Sullivan, “The Case for Universalism,” Jimmy Reid Foundation, 2012; H. Meyerson, “The Problem with Means-testing Entitlements,” Washington Post, October 21, 2015; G. Standing, Beyond the New Paternalism: Basic Security as Equality (New York: Verso Books, 2002).
76. “Amendment to 1965 Higher Education Act January 27, 2010.”
77. S. Goldrick-Rab and N. Kendall, F2CO: Redefining College Affordability: Securing America’s Future with a Free Two Year College Option (Washington, DC: The Lumina Foundation, 2015; R. Samuels, Why Public Higher Education Should Be Free: How to Decrease Cost and Increase Quality at American Universities (New Brunswick: Rutgers University, 2013).


