
Workers today face major worries about the potential for advances in automation and artificial intelligence, on top of long-standing concerns about trade and globalization. Indeed, despite a ten-year-long economic expansion and a historically low unemployment rate, one in ten U.S. workers think that they are likely to be laid off in 2019.1
This report looks closely at the details of permanent job losses in a time of overall economic growth. In particular, it examines the impacts of technology on jobs and job prospects right now, as well as the continued loss of U.S. jobs in manufacturing and professional services during the Trump administration. By looking at the enduring reality of job disruptions during a period of economic growth, this report identifies fundamental trends that are not simply an artifact of the economic cycle. Those trends are the following:
- The improving economy has not impacted the number of workers suffering permanent job losses, and one out of three workers who lose a long-tenured job is not re-employed.2 From January 2015 through December 2017, three million Americans were displaced from jobs they had held for more than three years. The figure was nearly unchanged from the number of workers displaced from 2013 to 2015 (3.2 million), despite the fact that the overall national unemployment rate has decreased by 22 percent over that time.
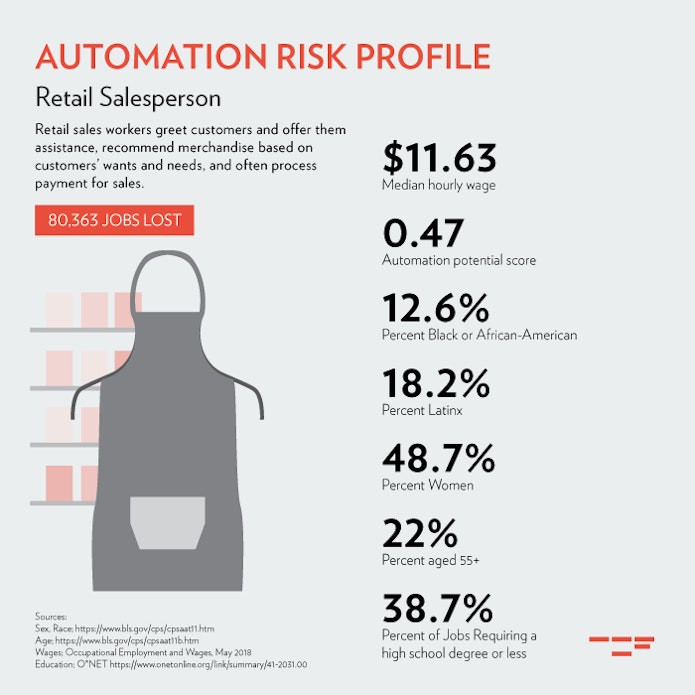
- Compared to the previous three years, the occupations declining the fastest from 2016 to 2018 are those rated most at risk of automation. Nearly half (44 percent) of the fastest-declining occupations have automation risks of at least 70 percent, compared to just one in four for all occupations across the economy.3 Jobs employing large numbers of low-wage working women, such as bookkeeping clerks and retail salespersons, dominate the list of occupations currently in decline and in the crosshairs of technological change.
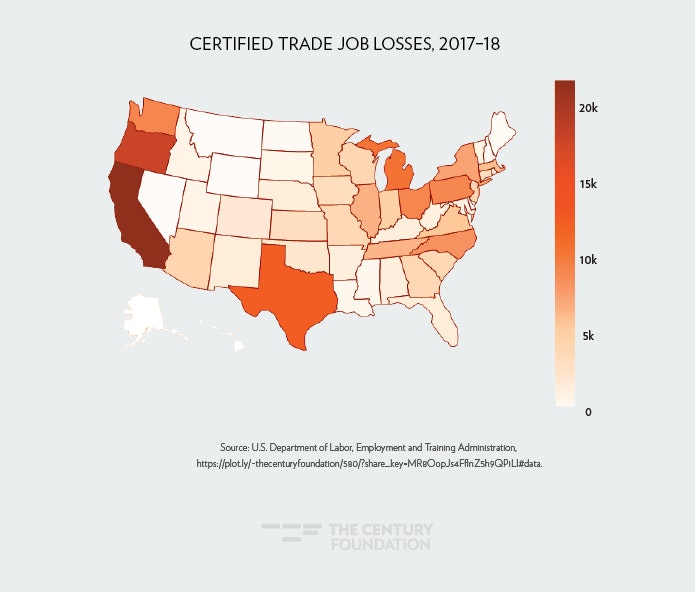
- In the two years since 2017, 205,000 workers have lost their jobs to trade, which is only a slight decrease when compared with similar job losses for the prior two years (247,000). These losses are concentrated on the West Coast and in states in the Midwest and Southeast, particularly Ohio, Michigan, North Carolina, and Pennsylvania.4
Taking Action to Address Economic Dislocation
It’s clear that, in good macroeconomic periods and bad, the country needs a much more robust and effective economic adjustment system to help workers, their families, and communities get back on their feet. Building on a prior Century Foundation research report, “Mounting a Response to Technological Unemployment,”5 we present a more detailed outline of the types of services that would be needed to help those who lose their jobs to maintain their economic security and find new good-paying jobs. Specifically, we propose the following fundamental reforms to the Trade Adjustment Assistance (TAA) program that would expand eligibility for the program:
- Move to a universal program for permanently displaced workers by expanding TAA to cover job losses from trade, technology, and major shifts in government policy. Automation certification would be based on a list of impacted occupations maintained by the U.S. Department of Labor and information about a particular separation submitted by a group or individual application. Policy certification would be based on a policy trigger enacted into law by Congress.
- Reform the cumbersome group petitioning process to gain eligibility for TAA by allowing for categorical certification among workers in industries heavily damaged by trade (as demonstrated by multiple TAA petitions or U.S. International Trade Commission complaints).
- Expand individual eligibility (complementing group-based petitioning) based on data about import penetration in their industry of employment, and by reforming the WARN Act to require companies to report to states when they have moved a facility overseas. Local workforce areas would approve these applications.
- Improve notification for TAA by requiring employers to provide state agencies with a list of laid off workers, and by utilizing grants to unions (including ones that allow the hiring of peer-to-peer counselors) as a mechanism to notify and recruit workers who are eligible for TAA.
To be more effective, we conclude that Trade Adjustment Assistance should move beyond being a one-size-fits-all model that requires retraining to gain the most generous benefits. Rather, the program should allow workers to retrain in programs with proven results, or gain help looking for a job with their prior skills, and in some cases use benefits to transition into retirement. Regardless of policy choice, workers should gain access to at least fifty-two weeks of extended jobless benefits (trade readjustment allowances, or TRA) and an additional fifty-two weeks to complete a training program. In addition to separating TRA from the requirement for training, the report recommends the following:
- Help trade-impacted communities develop new sectoral training programs tied to economic development with capacity-building grants patterned after the Trade Adjustment Assistance Community College and Career Training program.
- Improve accountability for employment and wage outcomes for TAA training by requiring eligible training providers to report on their outcomes, removing providers with poor results, and setting negotiated performance goals for TAA (similar to the Workforce Innovation and Opportunity Act (WIOA)).
- Promote apprenticeships by allowing states to pilot new models that convert standard TAA into grants to employers, payment for related instruction, or wage supplements for apprentices.
- Provide TAA recipients who are not in training with intensive reemployment services, similar to the Reemployment Services and Eligibility Assessments (RESEAs) provided to unemployment insurance claimants, but including enrollment in wage insurance programs that can make up to $10,000 of lost income for dislocated workers.
- Allow workers within two years of retirement age to receive two years of TAA, even if they choose not to go into retraining, providing a bridge of income until they can receive Social Security and/or private pension payments.
- Allocate resources for supportive services, such as child care and transportation, that can increase the odds of success in training.
While dire prognostications that automation and artificial intelligence would eliminate jobs for half of the workforce have proven inaccurate, job loss due to technology, trade, and looming issues such as climate change is a reality that is not going away. Now that the economy has flashed signs of a possible recession, the dangers these threats pose are even more pronounced. It’s past time for policymakers to give working families that find themselves in these situations a more robust safety net.
Permanent Job Loss from Technology, Trade, and Policy Choices
In 2018, the unemployment rate averaged just 3.9 percent, the lowest annual rate in nearly forty years.6 This makes the present a unique point in time in which to analyze economic dislocation. With so many parts of the nation’s economy growing, those occupations that are shrinking are more likely to be those undergoing structural rather than cyclical impacts. The ability of dislocated workers to get back to work provides a good barometer for reemployment challenges and job disruptions that endure during a growing economy.
From January 2015 through December 2017, three million Americans were displaced from jobs that they had held for more than three years.7 The figure was nearly unchanged from the number of similar workers displaced from 2013 to 2015 (3.2 million), despite the fact that the overall national unemployment rate decreased by 22 percent over that time. The clear implication is that the improving economy has cut into cyclical unemployment, but has had less of an impact on more permanent layoffs.
Figure 1
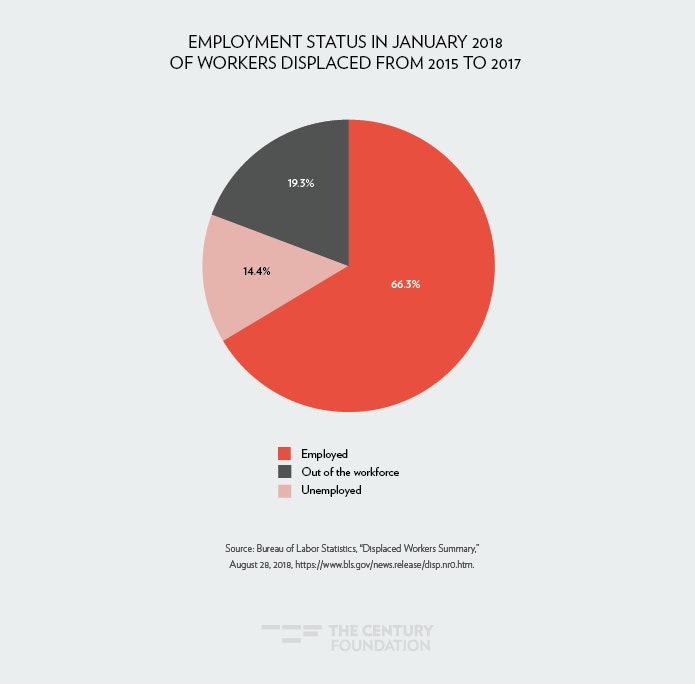
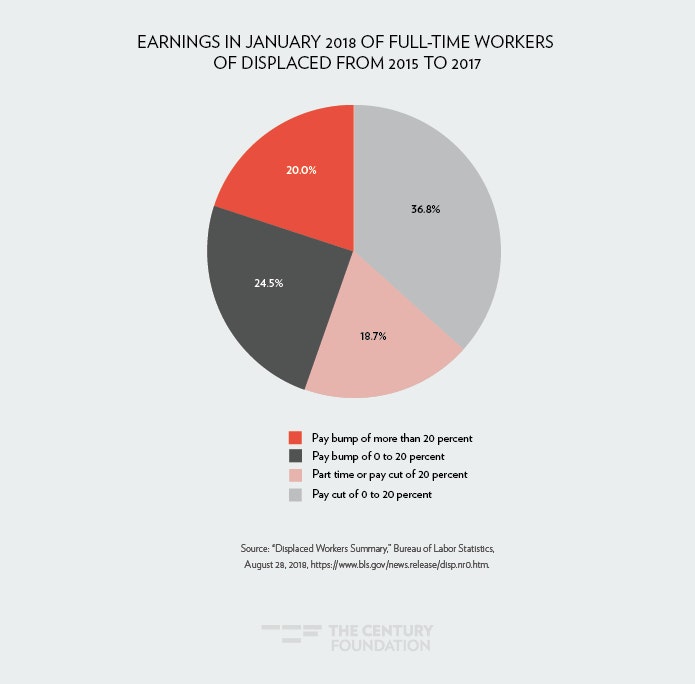
Even in an improving economy, permanent layoffs can lead to lasting damage for displaced workers and their families. Of these three million Americans displaced from 2015 to 2017, one out of three (33.7 percent) still had not found a job by January 2018 (see Figure 1). The jobless rate for displaced workers was essentially unchanged from the previous survey in 2016 (34.5 percent). The overall improvement in the job market had little measurable impact on whether displaced workers were able to find jobs. And, as displayed in Figure 2, most displaced workers have had to take a pay cut to get back to work. Among those who had been displaced from full-time jobs but who had found a job by January 2018, more than one in three (36.8 percent) had settled for part-time hours, or a job that meant a pay cut of at least 20 percent. On top of that, nearly one in five displaced workers (18.7 percent) who found other employment wound up taking a full-time job with a pay cut of 20 percent or less. Even when there is strong labor demand and growing wages, these declines in earnings indicate that either workers’ skills are in less demand, or that the quality of jobs in their industries and occupations are declining. For example, while manufacturing added 517,000 jobs from 2015 to 2018, the best paid unionized manufacturing work only increased by 30,000.8
Figure 2
The next section will map out three significant drivers of economic dislocation—technological change, trade, and government policy actions. In each case, workers are subjected to visible changes that are not only no fault of their own, but also indicate that they are unlikely to find other opportunities in the same industry and occupation. Then the report will outline a detailed proposal to reform the existing Trade Adjustment Assistance program into a vehicle to help workers in all three of these categories to get back on their feet.
Job Loss from Automation
Rapid technological change is one of the most frequently discussed risks to steady employment, especially as it relates to automation and artificial intelligence. A detailed analysis by Mckinsey Global Initiative found that 25 percent of Americans work in jobs in which 75 percent of tasks could be automated by currently available technologies, and 40 percent are in jobs in which at least half of the tasks are automatable.9 Yet, there’s a major disagreement among economic thinkers about the actual impact of automation on employment, with many pointing to slow productivity growth as evidence of the limited impacts on automation.10
What does the data regarding current occupational change indicate? The broad-based recovery has lifted employment across the economy. In fact, comparing the three-year averages for employment for the period from 2016 to 2018 to the three-year averages for employment for the previous period of 2013 to 2015 shows that nearly two-thirds of occupations gained jobs. (Three-year averages are utilized to smooth year-to-year volatility in occupational change, and are used throughout this section.) The remaining declining jobs give a useful window into structural changes in the economy, not a lack of cyclical demand for workers.
Figure 3 and Table 1 present data from the 5 percent of occupations that have fared the worst over the past three years, losing a total of 12,000 jobs despite overall economic growth. These job losses are plotted against detailed automation risk scores calculated by Mckinsey Global Institute, which analyzed the task profiles of occupational categories and scored what percent could be replaced by currently available technologies.11 The scores are based on a detailed analysis of each occupation’s tasks and the share that consisted of predictable physical labor or collecting and processing information—both of which are at risk because of technical advances in automation and artificial intelligence.12 Mckinsey rates automatability from 0 to 100 percent,note] Importantly, their results are based on what could happen based on adaptation of currently available technologies, but actual impacts would depend on both the rate of adoption and other variables (such as efforts to retrain workers),13 and the Mckinsey automation score data have been used in numerous studies on automation impact due to its unique occupation by occupation ranking.14
Figure 3
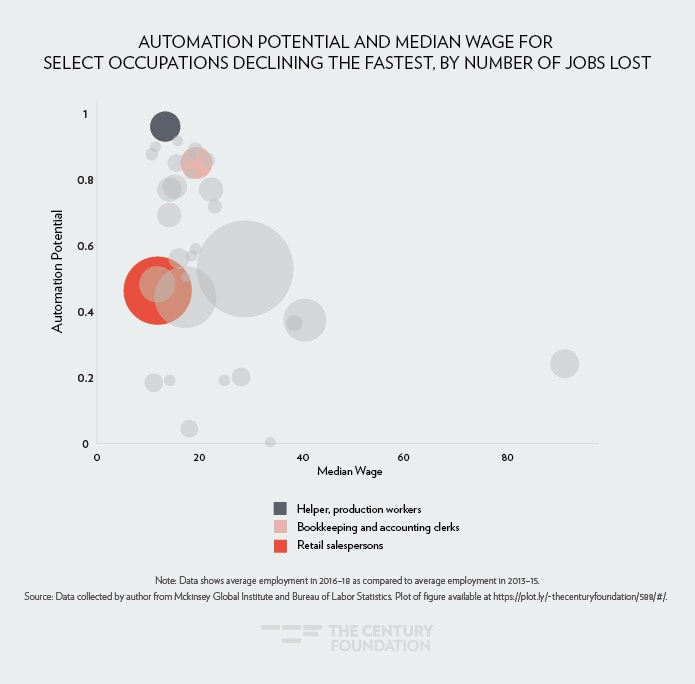
Table 1
| Automation Potential and Median Wage for Select Occupations, by Number of Jobs Lost | |||
| Occupation | Jobs Lost Over Past Three Years | Automation Potential | Median Hourly Wage |
| Helpers–Production Workers | 34,583 | 0.97 | $13.33 |
| Office Machine Operators, Except | 11,657 | 0.93 | $15.76 |
| Food Preparation Workers | 13,207 | 0.91 | $11.41 |
| Word Processors and Typists | 17,533 | 0.9 | $19.11 |
| Cooks, Fast Food | 14,457 | 0.89 | $10.74 |
| Billing and Posting Clerks | 15,097 | 0.88 | $18.17 |
| Payroll and Timekeeping Clerks | 15,610 | 0.87 | $21.66 |
| Bookkeeping, Accounting, and Auditing | 37,310 | 0.86 | $19.35 |
| Data Entry Keyers | 21,003 | 0.86 | $15.47 |
| Welding, Soldering, and Brazing Machine Setters, Operators, and Tenders | 12,850 | 0.83 | $18.11 |
| File Clerks | 27,317 | 0.79 | $15.24 |
| Tellers | 28,093 | 0.78 | $14.16 |
| Legal Secretaries | 27,433 | 0.78 | $22.29 |
| Service Unit Operators, Oil, Gas and Mining | 16,767 | 0.73 | $23.01 |
| Switchboard Operators, Including Answering Service | 28,187 | 0.7 | $14.14 |
| First-Line Supervisors of Housekeepings and Janitorial Workers | 11,797 | 0.6 | $19.20 |
| Credit Authorizers, Checkers, and Clerks | 12,143 | 0.58 | $18.63 |
| Order Clerks | 23,770 | 0.57 | $16.09 |
| Executive Secretaries and Executive Administrative Assistants | 240,311 | 0.54 | $28.53 |
| New Accounts Clerks | 11,137 | 0.51 | $17.21 |
| Telemarketers | 41,343 | 0.49 | $12.14 |
| Retail Salespersons | 80,363 | 0.47 | $11.63 |
| Bill and Account Collectors | 70,930 | 0.45 | $17.32 |
| Computer Programmers | 51,517 | 0.38 | $40.52 |
| Sales Representatives, Wholesale and Manufacturing, Technical and Scientific Products | 17,947 | 0.37 | $38.31 |
| Chief Executives | 34,997 | 0.25 | $91.15 |
| Sales Representatives, Wholesale and Manufacturing, Except Technical and Scientific Products | 20,777 | 0.21 | $28.13 |
| Helpers–Installation Maintenance, and Repair Workers | 14,393 | 0.2 | $14.16 |
| Advertising Sales Agents | 14,010 | 0.2 | $24.87 |
| Childcare Workers | 19,297 | 0.19 | $11.17 |
| Kindergarten Teachers | 7,0271 | 0.1 | N/A |
| Special Education Teachers, Kindergarten & Elementary Schools | 1,4371 | 0.1 | N/A |
| Roustabouts, Oil and Gas | 19,743 | 0.05 | $18.07 |
| Financial Specialists, All Other | 11,370 | 0.01 | $33.79 |
|
Note: Data shows average employment in 2016–18 as compared to average employment in 2013–15. Source: Mckinsey Global Institute and the U.S. Bureau of Labor Statistics. |
|||
There is a clear correlation between those jobs rated by Mckinsey as at risk for automation and those that are already declining. As shown in Figure 3, occupations declining in the past three years show that the risk of automation is real. Forty-four percent of all the fastest-declining occupations have an automation risk above 70 percent, while economywide, only one in four occupations face such a high risk. Most of the job categories in Table 1 (68 percent) have automation risks of at least 40 percent, compared to just half of all occupations across the economy.
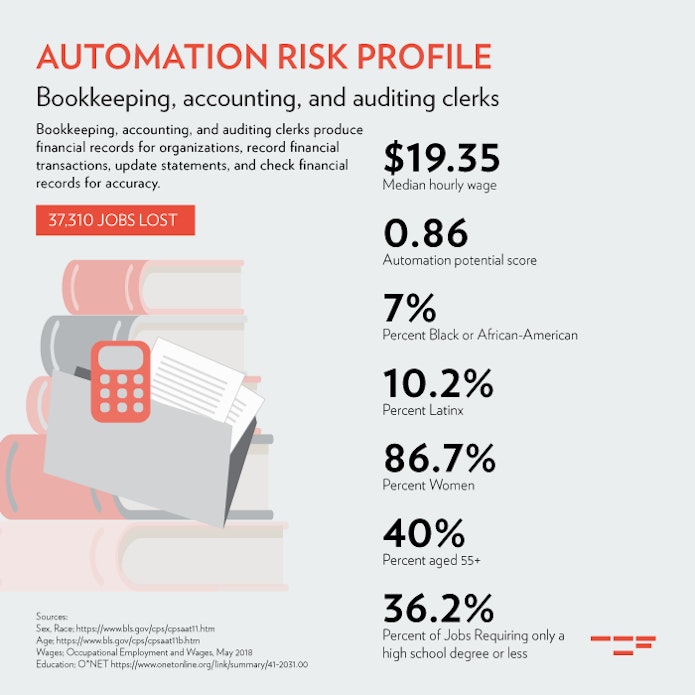
Bookkeeping Clerks
The Brooking Institution’s Darrell West argues that technological change has already changed American society and politics.15 Indeed, office occupations are numerous on the list of declining occupations in Table 1, many of which have high levels of automation risk. This category of work has been shrinking due to technology, with the onset of personal computers causing the elimination of 1.5 million secretary positions between 1990 and 2015. But new advances in technology continue to lead to shrinking office work. One representative occupation is bookkeeping clerks. This job has an automation risk score of 86 percent. Bookkeeping clerks are overwhelmingly women (86 percent), earning modest wages ($40,240) in a job that typically requires some college but not a degree. This work requires repeated data entry of information into spreadsheets.16 New computing technologies promise the ability to directly input and characterize paper receipts (captured by cell phone cameras) and bank records into accounting software, further undermining the need for bookkeeping clerks or for small businesses to hire bookkeepers at all.17 The Bureau of Labor Statistics (BLS) already reports that bookkeeping clerks frequently assist with other responsibilities such as payroll, billing, and purchasing.18 The office of the future promises to have fewer workers, with these workers fulfilling multiple support roles, aided by technology. While the consequence may be more economic efficiency, the Institute for Women’s Policy Research finds that the decline in office jobs such as these have cut off a meaningful path to the middle class for working women that don’t have a four-year college degree.19
Production Helpers
Production occupations, like those in manufacturing, consistently score high on lists of occupations that are highly automatable. Indeed, orders of industrial robots increased by 19 percent in the second quarter of 2019, even as overall spending on capital equipment declined.20 This has not coincided with a widespread decline in production workers, as firms are largely using robots to augment rather than replace their existing workforces—and increasingly buying cheaper and more flexible robots that can ramp up production without fully reorganizing production.21 However, the occupation listed on the very top of Table 1 foreshadows the type of change that is happening in manufacturing. The number of production helpers has declined by 35,000 workers (9 percent) over the past three years. These are lesser-skilled positions that involve putting articles into machines, cleaning surfaces, or supplying those working on assembly lines with tools. Such helpers are mostly men (69.9 percent) and earn a modest $13.33 per hour in jobs that usually require a high school degree or less (81 percent). As automation plays a larger role in production, companies need fewer of these types of lesser-skilled workers, even as frontline positions—which now require higher levels of basic numeracy and literacy to interact with robots, computer-controlled machine tools, and other advanced production techniques—remain highly in demand.

Retail Salespersons
The occupation with the second largest absolute decline in Table 1 are retail salespersons, a field that has dropped 80,400 positions in the comparison period. There are aspects of this occupation, such as interpersonal communication and empathy, that would appear difficult for computers to replicate (and thus the occupation’s automation potential is only 47 percent). Still, retail has been upended by technology as the ubiquity of cellphones and the ability of algorithms to help customers quickly find what they want online has increasingly replaced the need for a store and the people that work in it, putting the entire brick-and-mortar retail model at risk. (This stands in contrast with food preparation, where online ordering may actually be helping to contribute to more demand for restaurant food and a greater need for workers.)22 Moreover, major brick-and-mortar retailers such as Walmart are introducing new technologies, from robots that perform stock duties to automated check-outs, that have the potential to upend their retail model.23 Unlike manufacturing and office jobs, which have been impacted by technologies for decades, retail serves as a prime example of a new wave of mostly low-wage service jobs (paying an average of $11.63 and typically requiring a high school degree or less) at risk due to technological changes that are just recently impacting the workforce. The decline in retail doesn’t only threaten a labor market entry point for younger workers—many highly experienced workers are also at risk, such as those at Toys R Us and Sears, firms that went bankrupt after being highly leveraged by private equity investors (there were a total of 597,000 retail jobs lost in the past ten years at such companies).24 While Toys R Us workers successfully lobbied private equity companies to give them a severance pay out, the combination of technological change and private equity buyouts in the retail sector has left its workforce on edge.25
Job Loss from Trade
Even in a time of a strong economy and a recovery of the manufacturing industry, trade is a leading cause of permanent job loss. In the past two calendar years, there have been 205,000 certified trade job losses under Trade Adjustment Assistance.26 This is a decline from 262,780 in the two preceding years (2015 and 2016), but it still represents a major negative impact on workers and their communities. Moreover, these certified losses only represent a fraction of the jobs lost through trade during this time, as it only counts those that make it through the TAA petition process. Half (46 percent) of all these job losses are from durable manufacturing sectors, such as transportation and machinery, and 20 percent are from non-durable manufacturing sectors, such as textiles and chemicals, but there is also a significant percentage from professional services moved offshore (12 percent). As displayed in Figure 4, eight states have more than 8,000 trade certified job losses since 2017: California, Oregon, Texas, Michigan, Ohio, Washington, Pennsylvania, and North Carolina (in order from most to least). In Michigan, North Carolina, Ohio, and Pennsylvania, substantial manufacturing job losses loomed large in the 2016 election race, when candidates heavily criticized the North American Free Trade Agreement and China trade policies. Despite significant trade actions since 2017, trade job losses remain a major issue entering into the 2020 election cycle.
Figure 4
The continued reality of nationwide permanent job loss from trade demands a more robust national policy response.27 Nations in the Organisation for Economic Co-operation and Development (OECD) spend, on average, 0.6 percent of their gross domestic product (GDP) on active reemployment measures, compared to 0.1 percent in the United States.28 New research has identified the consequences of failing to address the major disruptions of earnings, such as further polarization of our nation’s politics and fragmentation of our social cohesion.29
Job Loss from Other Policy Decisions
Government policy represents another consistent—and often controversial—source of permanent job loss. The post-Cold War reduction in defense spending, for example, led to 1.5 million jobs lost, half of which were in private corporations that were dependent on defense contracts.30 New policy changes on the horizon could similarly lead to major challenges regarding job loss.
One area of immediate concern is the economic disruption that will come from addressing the worsening crisis of climate change, which will require a rapid transition away from fossil fuels. Many communities rely heavily on the fossil fuel industry as a source of jobs, despite the already volatile boom-and-bust nature of the energy business, and a transition to a greener economy will no doubt result in heavy job loss for some regions. Already, jobs in the coal mining sector have dropped by 40 percent since this decade’s peak in early 2012—amounting to over 36,000 jobs lost.31 As the United States, and the world, take the necessary steps toward stabilizing the climate, there will inevitably be even more jobs lost in traditional energy sectors.
What will happen to these workers? One in five fossil fuel workers are aged 55 and over, according to 2018 data,32 so a significant portion of the job losses will amount to attrition-by-retirement. Furthermore, even if the electricity sector is fully decarbonized in the coming decades, industries will continue to use petroleum to make chemicals, plastics, and synthetic materials for a wide variety of products and uses. Given that not all fossil fuel workers will be immediately discharged, it’s useful for researchers and policymakers to understand the potential pace and scale of employment decline. One study from 2016, for example, showed that a 60 percent decline in coal usage and a 40 percent decline in oil and gas extraction over twenty years would lead to a decline of 40,000 jobs in the coal mining industry over that period (2,000 per year), and 77,000 jobs in oil and gas extraction (less than 4,000 per year).33 The negative impact of the loss of these good-paying jobs has proved to be a major political impediment to addressing climate change, and most major climate change plans emphasize the need for a “just transition” for these workers, with policies that preserve family and community economic security and provide good-paying jobs in a sustainable economy.34
Both of the examples above involve major public imperatives—moving away from the Cold War, saving the environment—that threaten existing jobs. Having a net to catch these workers and the communities they live in is a vital part of being able to address these imperatives for the nation as a whole.
Reforming Trade Adjustment Assistance into a More Universal Dislocated Worker Program
Certainly, a major priority of policies should be to prevent job loss, but when it does occur, there needs to be a more robust system of support. For decades, Trade Adjustment Assistance (TAA) has represented the most generous system of support for dislocated workers, and a powerful platform (but not the only one) on which to expand services. The need for these services would expand even more if the economy falls into a recession, increasing layoffs across the country and especially among those whose work could be replaced by cost-cutting technologies. Building on The Century Foundation report, “Mounting a Response to Technological Unemployment,” this section provides a comprehensive proposal to reform Trade Adjustment Assistance for those who lose their jobs because of trade and emerging threats to stable employment.35 It will discuss reforms that address automation, trade, and policy dislocations specifically, but also will make recommendations for upgrading TAA’s effectiveness overall.
Created in 1962, Trade Adjustment Assistance provides federal support to help workers who lose their jobs or whose hours of work and wages are reduced as a result of national trade policy. These benefits include tuition for retraining, reemployment services, and extended income support so workers can provide for themselves and their families while they retrain. Significant expansions to the program were made in the Trade Act of 2002 and the American Recovery Reinvestment Act in 2009, but then narrowed in 2011, with some key elements restored in 2015.36
Once eligible for TAA, displaced workers can receive:
- Trade Readjustment Allowance (TRA) benefits. TRA benefits provide extended income support beyond what is provided by unemployment insurance (UI). Workers eligible for TAA can receive 104 additional weeks of payments (at the same level) beyond what UI provides, giving workers the potential to complete a program as intensive and lengthy as an associate’s degree.
- Retraining. TAA pays for a wide variety of training programs, including post-secondary education, classroom training, and apprenticeship, as well as remedial education. The average per-participant spending on training in TAA is $13,000; for comparison, the WIOA gives just $2,861 per participant.37
- Continued health care benefits. TAA recipients can maintain their employer-based health insurance through the health care tax credit (HCTC), which covers 72.5 percent of a family’s premiums.38
- Wage insurance. TAA provides wage insurance, known as Reemployment Trade Adjustment Assistance (RTAA), up to half of the difference between a TAA recipient’s pre-layoff salary and their new job, and can pay up to a maximum of $10,000 over two years. Only workers earning $50,000 or less in their new jobs are eligible for RTAA.39
- Relocation and job search allowances. TAA recipients can receive up to 90 percent of the expenses of relocating outside of their community in order to secure a good-paying job, up to a maximum of $1,250.
- Case management and reemployment services. All TAA recipients are eligible for job counseling and case management, including assessments, development of an individualized employment plan, career counseling, and referrals to supportive services like child care.
While these features are important, there’s a general sense among stakeholders that Trade Adjustment Assistance does not fulfill its promise to workers and communities negatively impacted by the expansion of free trade agreements. The program is difficult to qualify for, and even the relative generosity of TAA does not make up for large and lasting income losses for workers and their families and the communities they live in.
Building on our previous report that focused on reforming TAA to address automation, this report offers a more extensive restructuring of TAA that could meet the scale of future waves of economic dislocations caused by trade, technology, and government policy. The proposed reforms would create a pathway for a more universal and expansive approach to meeting these needs, a pathway along the lines of the one taken by other OECD nations.40
The reasons to expand TAA beyond trade are compelling. Trade represents only a portion of serious workplace displacement—from January 2015 to December 2017, while three million workers were displaced from jobs that they held for more than three years, during this time, only 439,000 workers were certified as eligible for TAA.41 There’s room to expand TAA into a more effective response to economic change by expanding categories of eligibility. The approach in this report follows recommendations by Rob Atkinson of the Information Technology and Innovation Foundation and others to reshape TAA into a “comprehensive Trade, Technology, and Policy Adjustment Assistance Act (TTPAA), to help all workers displaced by trade, technology, or government policy decisions.”42
The recommendations in this section seek to create a TAA program that is both more effective and more robust in its investments by (1) simplifying and expanding eligibility for services, (2) ensuring that a greater share workers that select TAA training attain good paying jobs in the fields they train for, and (3) improving financial and related support delivered to displaced workers, whether or not they avail themselves of TAA training. The section outlines ways, first, to expand TAA to address losses stemming from automation; then suggests improvements on how TAA addresses trade impacts, then how to expand eligibility to workers dislocated due to other policy choices. The section then suggests a reorientation of TAA service strategy, ensuring that more of those workers who choose to engage in TAA training end up with a quality job (and that their communities have the tools to do so), and that a more robust set of supports are available to those workers for whom retraining is not the best personal solution.
Expanding TAA Eligibility to Include Automation Dislocations
TAA provides a ready-made model to make available a comprehensive suite of services to workers who lose their jobs because of automation. Recognizing this, Senators Joe Donnelly (D-IN), Debbie Stabenow (D-MI), Kirsten Gillibrand (D-NY), and Gary Peters (D-MI) proposed the TAA for Automation Act of 2018 (S. 2892) to address job losses caused by automation, and proactively address future job losses due to the expansion of robotics and artificial intelligence. Specifically, this bill would:
- Appoint an independent advisory commission to provide real-time intelligence and an annual report on job loss related to technology.
- Allow group TAA certifications when a firm has shifted production to use technology for what was previously “human work” and that has contributed meaningfully to the termination of workers’ employment.
- The bill sponsors are planning on reintroducing the legislation in October and strengthening to mirror the broader TAA program by allowing for the certification of job losses caused by competitors’ transitions to automation. There are important examples of workers losing jobs because competing firms are introducing automated technologies, rather than existing companies laying off workers because they are automating their own production. For example, the introduction of automated long-haul trucks by large national transport companies could quickly displace employees at smaller driver-operated long-haul trucking companies. TAA could address this by allowing certifications if an increase in automation in an industry sector has led to meaningful job losses by the petitioning group of workers. This would mirror section 222(a)(2)(A) of TAA, which allows for certification if workers are experiencing job losses because of an increase in imports of a competitive product.
- Allow for individual-level TAA eligibility among workers whose occupations have been impacted by automation. As part of a larger-scale reorganization of TAA, it would be possible to have certifications at the individual level. While trade has impacted employment at the firm level, automation likely will affect employment at the occupational level. For example, further advances in computing technology are forecasted to displace bookkeepers across industries and firms, many of which would shed only one or a small number of bookkeeping positions. Relying on group-based certification would significantly limit TAA’s capacity to meet this occupation-level displacement caused by automation.
To establish individual eligibility, Congress could build on the TAA for Automation Act and appoint an independent advisory board that would publish an annual list of occupations at risk of automation, and certify at a national level which occupations are experiencing above-average job loss, and whether that job loss can be significantly attributed to automation.43 Workers could be able to apply for TAA even if they are not part of a group certification, and would be deemed eligible if they were laid off from one of the occupational categories designated by the advisory commission. The decision on the individual adjudication would be made at the local level using federal guidelines.
Streamlining and Expanding TAA Eligibility for Trade Dislocations
To receive services through TAA, an individual must be part of a plant closing or mass layoff that is certified as being caused by trade. To be certified, a group of workers (or a union, company, or state agency, acting on their behalf) must file a petition to the U.S. Department of Labor with detailed information about why trade is directly impacting the article (or service) produced at that workplace. Many workers aren’t able to organize themselves to file the very detailed information required on time.44
Even if workers successfully file a petition, there is an average of 100 days between the petition date and the date of determination.45 Many determinations are completed well after the plant has been closed, by which time workers are dispersed. Reforms should add individual-level eligibility options that reach those who are not well served by the petitioning process, and that provide additional ways for states to more effectively reach those who are certified as eligible, as described below:
- Industry-wide certification. One idea for improving the group petitioning process—proposed before, but worth revisiting—is industry-based certifications.46 The idea would be to provide industry-wide certification if there were at least three different TAA petitions filed in the same industry within 180 days; at that point, other petitions from a plant in that same industry closing would be certified as eligible for TAA without needing to demonstrate an increase in imports of the particular article produced at that facility.47 Another way to establish industry certification would be to expand the linkage between trade injury findings from the U.S. International Trade Commission (ITC) and TAA. Right now, group petitions from workers from firms specifically named in an ITC trade injury determination are automatically certified, but workers in other firms in that industry are not covered.48 This provision could be expanded to cover an entire industry that has suffered a trade injury documented by the ITC during the year before or the year after the injury finding.
- Individual-level eligibility for TAA. An option for individual worker eligibility determination should be added as a supplement, but not replacement, for worker group petitioning. In other words, TAA eligibility should be changed so that individual workers can apply for and receive the benefit even if they are not part of a workplace job loss action that has successfully petitioned. As with other dislocated worker programs, individual-level eligibility for TAA would require state agencies to determine if an individual meets a set of documentable criteria, as described below.
- Option 1: Increase in imports. Base eligibility on import data by North American Industry Classification System (NAICS) code. A reformed TAA could deem individuals eligible if they are in industries that experienced a significant increase in imports, and they were permanently separated from work.49 State workforce agencies could look at the detailed industry code of employment of a separated employee. The agency would then verify that this industry had experienced a significant increase in imports as documented by the Census Bureau, or has suffered a verified trade injury as documented by the U.S. International Trade Commission. This would be akin to the proposals for industry-wide certification that Congress debated in the process that resulted in the 2009 reauthorization of TAA, but unlike those proposals, this approach would not be based on past petitions but rather on underlying data.50
- Option 2: Offshoring decision. No data set exists to determine whether a worker was at a factory that moved work out of the United States. However, since 1988, the Worker Adjustment and Retraining Notification (WARN) Act protects workers and their families by requiring companies (with 100 employees or more) to notify workers and the state dislocated worker unit when they are laying off fifty or more workers. Congress should amend WARN to require companies to include whether the layoff is due to a shift in production overseas, which would provide a form of proof for individuals who seek TAA even if a petition has not been filed on their behalf. However, this form of proof won’t be available to all workers. That’s because employers file WARN notices for only one half of plant closures, as employers maneuver around its requirement in an effort to keep their actions undisclosed, and the law is difficult to enforce.51 In these cases, separated workers should be able to self-report that their job moved overseas; state agencies could use evidence such as news reports, company websites, and communications with state economic development officials, unions, or employees to document the offshoring. To facilitate individual eligibility, TAA should delegate authority to state workforce agencies to request corroborating information from employers, who would be required by law to provide it.52
Expanding Eligibility for TAA to Include Dislocations from Policy Choices
A third plank of improvement to TAA would be to add policy eligibility—addressing workers who lose their jobs due to federal governmental policy changes in areas such as the environment or national security, including new proposals being considered to address climate change by limiting fossil fuels, or defense downsizing.
A suggested approach would be to amend TAA to include a policy-based component, with a conditional trigger. The TAA policy component enacted would direct future actions of Congress to designate impacted industries and occupations to be covered by a new category—policy adjustment assistance—and allow for both group petitioning at individual workplaces and for the Department of Labor to make national certifications for industries or occupations based on evidence of policy impact. Once eligible, individuals would receive the same benefits and services as other TAA recipients. New funds would be authorized for policy adjustment assistance alongside enabling legislation. For example, a climate change bill could specify that policy adjustment assistance could be directed to laid off workers in the oil and gas industry. Defense legislation that include the decommissioning of weapons systems could include policy adjustment assistance for those involved in the manufacturing and maintenance of those systems.
Any expansion of TAA eligibility would require changes to data collection, including disaggregation of job losses to trade, technology, or policy. These data are a very important marker of the cause of permanent dislocation, especially when it comes to trade.
Improving TAA Notification
Notifying workers that they are eligible for TAA has proven to be a challenge for states. One straightforward step for improvement would be to require firms to provide a list of workers involved in plant closings—including those with a petition covered by TAA and by those covered by a WARN notice—and direct states to perform proactive outreach to these groups. To supplement this, Congress could appropriate a modest sum for TAA navigator grants that would be directed to labor unions and community groups to conduct outreach and enrollment activities for TAA-eligible workers before and after a layoff, following the model of the $1.4 million in Trade Adjustment Assistance Outreach Partnership Grants authorized by the American Recovery and Reinvestment Act of 2009.53 Another approach could utilize the model of successful peer-to-peer networks that are funded by states using rapid response dollars: states continue to use this approach to educate displaced or soon to be displaced workers about available services and benefits and refer or enroll workers in appropriate programs.54
Improving Training Effectiveness
TAA regularly meets or exceeds its performance goals in federal regulations. In 2018, 76 percent of participants who exited TAA found a job.55 These figures are consistently higher than what the WIOA dislocated worker program has delivered.56 These results are achieved with a population that is older than the average for the nation’s workforce and concentrated in areas that have experienced overall economic declines because of trade.57
The program has been branded as ineffective, however, largely on the basis of a recent federal evaluation that has, in the national consciousness, eclipsed the findings of other research on the program. This evaluation stated that those in TAA on average earned about $3,000 less during a four-year follow-up period than did those who were not in the program. The root of the problem is that only 37 percent of those who completed training were able to find employment in the occupations they trained for, so averaging their salaries over the short term masks the program’s success for workers who do find work in a field related to their training. For example, TAA recipients who completed their training and found a job in their fields received a $5,000-to-$6,000-per-year earnings boost.58 However, a recent study more carefully compared differences among workers approved or denied TAA, rather than comparing TAA recipients with other groups of unemployed workers who had not lost their jobs from trade. This study found that workers who received TAA training earned $50,000 more over a ten-year period (exceeding the cost of TAA), even though they were no more likely to have a post-secondary credential.59
The goal of reforming TAA training services should be to help more workers enter and complete training programs where there is strong demand for the skills they have learned, including but not limited to programs that more effectively combine work-based and classroom learning like apprenticeships.
Proposed reforms include the following:
- Provide support for workers in training. TRA benefits are not large enough to allow dislocated workers to provide their basic needs while in training, and 25 percent fail to complete training courses.60 Building on proposals by the Aspen Institute, TAA could provide a bonus payment to workers who are successfully progressing through their program (at the midway point of an occupational training program or the end of a semester).61 In addition, TAA should be returned to its 2009 level of benefits, offering a full 130 weeks of benefits to those who make satisfactory progress in training and allowing an additional twenty-six weeks of TRA benefits for workers who need remedial education before entering classroom or occupational training.
- Promote apprenticeships. TAA should allow states flexibility to expand the usage of apprenticeships. The standard TAA model does not apply neatly to apprenticeships, as employers typically pay for the training and participants earn wages as apprentices rather than TAA benefits. States should be allowed to pilot alternate approaches. These include using TAA training dollars to pay for related instruction (as in done in WIOA), converting TAA dollars to grant to employers to offset training costs (these are offered as tax credits in twelve states), or lastly, providing a TRA payment to apprentices to supplement their limited income.62
- Improve accountability for employment and wage outcomes. TAA gives latitude to workers to select programs that have a “reasonable expectation of employment following completion of such training.” However, workers don’t always have the information to make informed choices about training that will most likely lead to good paying jobs. Programs eligible for expanded TAA training should report on the wage and employment outcomes of program completers, and be taken off of the list of eligible training providers if they don’t meet goals (meeting or exceeding the standards set out in WIOA).63 And, as they are with the WIOA program, states should be required to negotiate minimum levels of performance for TAA training to drive accountability for results.64
- Build capacity for sectorally focused training programs. TAA operates like a voucher program, giving states little in the way of resources to develop the capacity of its education and training system to meet the challenges of dislocated workers. The effectiveness of the program could be improved by giving states regular capacity building support with designated purposes, including building sectoral partnerships between employers in demand sectors, developing new career programs that teach basic skills in the context of occupational training, creating new registered apprenticeships, and developing new programs of study at community colleges.65 This fund could be patterned after the previously established but now dormant Trade Adjustment Community College and Career Training grant program, which delivered 185 grants in all fifty states, and built 1,992 training programs.66 This is one way TAA can help to connect its services to the broader need for the development of viable economic sectors in communities impacted by job loss, but community economic development for such communities continues to be an underdeveloped area of public policy.
More Effectively Supporting Eligible Dislocated Workers
Permanently dislocated workers need more than retraining. They need income to pay rent and put food on the table while they search for a new job (whether or not they opt for retraining), and help in protecting against major losses in health and retirement security caused by a major job loss. While some benefits provided by TAA don’t require training enrollment, the most generous do. The result is that most workers choose to enroll in the TAA program only if they are interested in retraining. For example, while 30 percent of dislocated workers who find a job end up working part time or in positions with wages that reflect a pay cut of 20 percent or more, only 5,618 workers received wage insurance payments in 2017 targeted to such workers.67
Further reforms would enable TAA to take more than a one-size-fits-all approach to economic dislocation. This more robust approach would include providing income support, including but not limited to wage insurance for those who do not opt for retraining, as well as serious help finding a job and support paying health care premiums.
The following reforms should be pursued:
- Separate TRA from TAA. Currently, the only way to get more than twenty-six weeks of TRA benefits is to be enrolled in training or have a waiver. In practice, this means that most of those on TAA do not generally receive more benefits than those on standard unemployment benefits. On the ground, this has made TAA primarily a program about training, because entering into training is the only way to receive additional cash TRA benefits. This may limit the efficacy of TAA training because some individuals may lean towards training over searching for employment because it is the only way to ensure a steady stream of income beyond twenty-six weeks. Changing TRA this way would have two additional benefits. It would recognize that permanently dislocated workers need a longer time to search for a job and can benefit from extended unemployment benefits. Also, it would recognize that one role of TAA is to compensate economic “losers” during industry transformations that may raise overall economic growth but hurt certain individuals and communities. This is a key tenet of proponents of a “just transition” following technological, environmental, and economic changes.68 Cash transfers provided by TAA can serve as such compensation. Congress could make basic TRA benefits into a fifty-two-week package, providing a net twenty-six-week extension of UI to all TAA recipients. Then additional TRA could provide another fifty-two weeks of benefits for workers to complete occupational training. Congress could also provide an optional extended TRA option of thirteen or twenty-six more weeks of benefits to individuals who are making satisfactory progress in education or training but need additional time to complete a post-secondary credential.
- Provide training waivers to workers who are close to retirement. The 2009 TAA reforms provided waivers that allowed workers to receive full extended TRA benefits if they were within two years of retirement. Moreover, many dislocated workers are looking for a bridge to a secure retirement, often after a lifetime of physically demanding work, rather than retraining for a new career. In this way, TAA can serve as a source of stop-gap income before more generous pension benefits and social security kick in. Restoring this waiver is an important part of reforming TAA to meet the needs of different workers.
- Federalize TRA benefits. TAA benefits are based on state unemployment insurance levels, which are capped by state legislatures seeking to limit state costs. But TAA benefits are paid federally, and could be set nationally. A reasonable national level would replace 70 percent of the worker’s prior average weekly wage, with the cap set at 100 percent of the average weekly wage in the state that the worker resides in.69
- Provide reemployment services. Congress could require that TAA recipients participate in reemployment service appointments now delivered to UI recipients by providing additional dollars to expand RESEA services to the TAA population. Delivery of reemployment services to TAA recipients would benefit those who want to work but not to participate in training, and could ensure that more workers benefit from wage insurance, which can help to make up the difference between pre-layoff and post-employment wages. While wage insurance is not a replacement for TAA training, a far larger number of trade impacted workers could be taking up this financial benefit if enrollment into TAA was more seamless and paired with reemployment services.
- Allocate resources for supportive services. While TAA case management services are required to make TAA recipients aware of support services like child care and transportation, resources for support services must come from WIOA or another source. Congress could allocate additional resources to states to provide these services to recipients who are enrolled in training and need to access them in order to maintain satisfactory performance and to successfully complete their programs.
- Maintain the value of wage insurance. Wage insurance values have remained unchanged since being cut back in 2011, while TRA benefits rise along with UI benefits levels. A long-term proposal would provide workers with wage insurance when they earn less than the average annual salary ($57,265 in 2018), and provide them with up to 10 percent of the annual average wage per year in a wage insurance payment. (The cap for wage insurance should be adjusted for inflation.) Currently wage insurance is available only to workers earning $50,000 per less per year, and caps out at a maximum of $10,000.
- Provide relocation allowances. The relocation allowance offered by TAA may be too small to incentivize TAA recipients to relocate to areas with more robust job opportunities, as only 179 TAA recipients availed themselves of these services over the past year.70 Congress could double the relocation amount, as even a significant uptick in usage is unlikely to dramatically increase costs.
Conclusion
Job flux and change is an enduring reality of the U.S. economy. The most recent data confirm that consequences of permanent job loss linger as displaced workers face long odds of finding work at a similar wage level. Workers face multiple threats to stable employment, including automation and technological change, trade and globalization, and changing government policies. These threats would be exacerbated if the economy slows and potentially moves into a recession. It’s time for policymakers to build a more serious response to permanent job loss related to multiple threats facing U.S. workers. A logical place to start is by reforming Trade Adjustment Assistance into a more effective and powerful response to worker dislocation.
Acknowledgments
The author thanks Amanda Novello for significant research assistance and Neil Ridley, Gerri Fiala, Roy Housemann, Annette Bernhardt, Ethan Pollack, Kermit Kaleba, Conor Mckay, Mark Muro, Jennifer Mishory and Joel Yudken for helpful comments on the draft.
Notes
- Pedro Nicolaci da Costa, “Job Uncertainty Looms Large For American Workers Despite Low Unemployment,” Forbes, March 29, 2019, https://www.forbes.com/sites/pedrodacosta/2019/03/29/job-uncertainty-looms-large-for-american-workers-despite-low-unemployment/#35f8f3e24a06.
- “Displaced Workers Summary,” Bureau of Labor Statistics, August 28, 2018, https://www.bls.gov/news.release/disp.nr0.htm.
- “Occupational Employment Statistics,” Bureau of Labor Statistics, https://www.bls.gov/oes/tables.htm, and Mckinsey Global Institute, “Automation Potential and Wages for US Jobs,” https://public.tableau.com/views/AutomationandUSjobs/Technicalpotentialforautomation?:embed=y&:display_count=yes&:showTabs=y&:showVizHome=no.
- “Data on TAA Petitions and Determinations,” U.S. Department of Labor, https://www.doleta.gov/tradeact/taa-data/petitions-determinations-data/.
- Andrew Stettener, “Mounting a Response to Technological Unemployment,” The Century Foundation, April 26, 2018, https://tcf.org/content/report/mounting-response-technological-unemployment/.
- “Employment status of the civilian population by sex and age,” Bureau of Labor Statistics, https://www.bls.gov/news.release/empsit.t01.htm.
- “Displaced Workers Summary,” Bureau of Labor Statistics, August 28, 2018, https://www.bls.gov/news.release/disp.nr0.htm.
- “Employment, Hours, and Earnings, Table B-1. Employees on nonfarm
payrolls by industry sector and selected industry,” Bureau of Labor Statistics, https://www.bls.gov/webapps/legacy/cesbtab1.htm, and Barry Hirsch and David Macpherson, “Union Membership and Coverage Database from the CPS,” Unionstats.com, http://unionstats.gsu.edu/. - “Automation potential and wages for US Jobs,” Mckinsey Global Institute, https://public.tableau.com/views/AutomationandUSjobs/Technicalpotentialforautomation?:embed=y&:display_count=yes&:showTabs=y&:showVizHome=no.
- Lawrence Mishel and John Bivens, “The Zombie Robot Argument Lurches On,” Economic Policy Institute, 2017, https://www.epi.org/publication/the-zombie-robot-argument-lurches-on-there-is-no-evidence-that-automation-leads-to-joblessness-or-inequality/.
- “Automation Potential and Wages for US Jobs,” Mckinsey Global Institute, https://public.tableau.com/views/AutomationandUSjobs/Technicalpotentialforautomation?:embed=y&:display_count=yes&:showTabs=y&:showVizHome=no.
- “Jobs Lost, Jobs Gained: Workforce Transitions In A Time Of Automation,” Mckinsey Global Institute,
https://www.Mckinsey.com/~/media/Mckinsey/Featured%20Insights/Future%20of%20Organizations/What%20the%20future%20of%20work%20will%20mean%20for%20jobs%20skills%20and%20wages/MGI-Jobs-Lost-Jobs-Gained-Report-December-6-2017.ashx. - See “A Future That Works: Automation, Employment, and Productivity,” Mckinsey Global Institute, January 2017, https://www.Mckinsey.com/~/media/Mckinsey/featured%20insights/Digital%20Disruption/Harnessing%20automation%20for%20a%20future%20that%20works/MGI-A-future-that-works-Executive-summary.ashx.
- Matt A.V. Chaban, “Work To Do: How Automation Will Transform Jobs in NYC,” Center for an Urban Future, March 2018, https://nycfuture.org/research/how-automation-will-transform-jobs-in-nyc. https://nycfuture.org/research/state-of-work-automation-impact-on-new-york-state and Lei Ding,
Elaine W. Leigh, and Patrick Harker, “Automation and Regional Employment In the Third Federal Reserve District,” Philadelphia Federal Reserve, October 2018 https://www.philadelphiafed.org/-/media/community-development/publications/special-reports/automation-and-regional-employment.pdf?la=en - Darrell West, The Future of Work: Robots, AI, and Automation (Washington, D.C.: Brookings, 2018).
- “Why Bookkeeping Automation Is the Future,” Work Is Changing, March 15, 2018, https://workischanging.ca/why-bookkeeping-automation-is-the-future/.
- “Automated bookkeeping workflows keep you organized and saves time,” Neat, https://www.neat.com/solutions/automated-bookkeeping/.
- “Occupational Outlook Handbook: Bookkeeping, Accounting, and Auditing Clerks,” Bureau of Labor Statistics, 2018, https://www.bls.gov/ooh/office-and-administrative-support/bookkeeping-accounting-and-auditing-clerks.htm.
- Ariane Hegewisch, Chandra Childers and Heidi Hartmann, “Women, Automation, and the Future of Work,” Institute for Women’s Policy Research, March 13, 2019, https://iwpr.org/publications/women-automation-future-of-work/.
- Timothy Aeppel, “North American companies boost spending on industrial robots: study,” Reuters, August 20, 2019, https://www.reuters.com/article/us-manufacturing-automation/north-american-companies-boost-spending-on-industrial-robots-study-idUSKCN1VA12C.
- Craig Torres, “Why the Robot Takeover of the Economy Is Proceeding Slowly,” Bloomberg Business Week, July 5, 2017, https://www.bloomberg.com/news/articles/2017-07-05/why-the-robot-takeover-of-the-economy-is-proceeding-slowly.
- Teo Reyes, director of Restaurant Opportunities Center, email to author.
- Melissa Hellman, “Bonney Lake Walmart’s robot zips along in tech revolution that’s raising big questions for workers,” Seattle Times, May 17, 2019, https://www.seattletimes.com/business/technology/walmarts-push-for-advanced-technology-has-workers-asking-how-theyll-coexist-with-robots/.
- Jim Baker, Maggie Corser and Eli Vitulli, “Pirate Equity, How Wall Street Firms are Pillaging American Retail,” United for Respect, July 2019, https://united4respect.org/pirateequity/.
- Abha Bhattarai, “Toys R Us owners set aside millions of dollars for laid-off workers after bankruptcy,” Washington Post, October 1, 2018, https://www.washingtonpost.com/business/2018/10/01/toys-r-us-owners-set-aside-millions-dollars-laid-off-workers-after-bankruptcy/?noredirect=on.
- “Data on TAA Petitions and Determinations,” U.S. Department of Labor, https://www.doleta.gov/tradeact/taa-data/petitions-determinations-data/.
- Additional workers impacted by trade dispute between the U.S., China and the European union may not be counted in these numbers. Workers who are impacted by decrease in exports faced by overseas tariffs are not covered by TAA, unless there is a concurrent increase in imports from other nations.
- “The Long-Term Decline in Prime-Age Male Labor Force Participation,” 2016, Executive Office of the President of the United States, 2016, https://obamawhitehouse.archives.gov/sites/default/files/page/files/20160620_cea_primeage_male_lfp.pdf.
- Darrell West, The Future of Work: Robots, AI, and Automation (Washington, D.C.: Brookings, 2018).
- Greg Bischak, “Defense Conversion,” The Institute for Policy Studies, 1997, https://ips-dc.org/defense_conversion/.
- “Databases, Tables and Calculators,” U.S. Department of Labor, Bureau of Labor Statistics, https://data.bls.gov/timeseries/CES1021210001.
- “The U.S. Energy and Employment Report (USEER),” Energy Futures Initiative (EFI) and the National Association of State Energy Officials (NASEO), 2019, https://www.usenergyjobs.org/2019-report.
- Robert Pollin and Brian Callaci, “The Economics of Just Transition: A Framework for Supporting Fossil Fuel-Dependent Workers and Communities in the United States,” October 13, 2016, Political Economy Research Institute, https://www.peri.umass.edu/publication/item/762-the-economics-of-just-transition-a-framework-for-supporting-fossil-fuel-dependent-workers-and-communities-in-the-united-states.
- “Labor, Environmental Leaders Release Historic ‘Solidarity for Climate Action’ Platform,” BlueGreen Alliance, June 24, 2019, https://www.bluegreenalliance.org/the-latest/labor-environmental-leaders-release-historic-solidarity-for-climate-action-platform/.
- While this proposal is ambitious, it is not a universal dislocated worker proposal that would provide expanded services to all who suffer a permanent job loss. The last proposal for universal dislocated worker program offered less in services than the TAA program, scaling back outlays per person for a program that would serve many more workers. See also, Andrew Stettener, “Mounting a Response to Technological Unemployment,” The Century Foundation, April 26, 2018, https://tcf.org/content/report/mounting-response-technological-unemployment/.
- “Trade Adjustment Assistance for Workers and TAA Reauthorization Act of 2015,” Congressional Research Service, United States Congress, https://fas.org/sgp/crs/misc/R44153.pdf.
- Sheena McConnell, “Individual Training Accounts: Testing Models of Paying Training 1999–2011,” report prepared for the U.S. Department of Labor, Employment, and Training Administration, Mathematica Policy Research, https://www.mathematica-mpr.com/our-publications-and-findings/projects/individual-training-accounts.
- “Health Coverage Tax Credit,” Internal Revenue Service, 2018, https://www.irs.gov/credits-deductions/individuals/hctc.
- “TAA Program Benefits and Services Under the 2015 Amendments,” Employment and Training Administration, United States Department of Labor, 2015, https://www.doleta.gov/tradeact/2015_amend_benfits.cfm.
- OECD nations include major industrial nations, primarily in North America, Europe and East Asia and dating back to the 1960s, the cooperative organization involving these countries have advocated for activation strategies focused on reemployment alongside income supports like unemployment benefits. See “Employment Policies and Data: Active labour market policies and activation strategies,” OECD.
- “Displaced Workers Summary,” U.S. Bureau of Labor Statistics, August 28, 2018, https://www.bls.gov/news.release/disp.nr0.htm, and authors analysis of TAA petitions with determination dates from 2015to 2017.
- Rob Atkinson, “How to Reform Worker-Training and Adjustment Policies for an Era of Technological Change,” Information Technology and Innovation Foundation, February 20, 2018, https://itif.org/publications/2018/02/20/technological-innovation-employment-and-workforce-adjustment-policies.
- A concrete standard could set the occupational job loss at least 8 percent in the prior three years.
- Rick McHugh and Phil Gilliam, “Getting Certified for Trade Adjustment Assistance,” National Employment Law Project, 2005, https://s27147.pcdn.co/wp-content/uploads/2015/03/TAA-Manual.pdf.
- Authors calculation of TAA data 2014–15.
- Jane McDonald-Pines, “Testimony before the Senate Finance Committee,” June 6, 2007 https://www.finance.senate.gov/imo/media/doc/060607testjmp.pdf
- Sigurd Nilsen, “Trade Adjustment Assistance: Industry Certification Would Likely Make More Workers
Eligible, but Design and Implementation Challenges Exist,” U.S. Government Accountability Office, June 2007, https://www.gao.gov/assets/270/263136.pdf. GAO’s analysis found that “From 2003 to 2005, 222 industries had three petitions certified within 180 days. Based on our analysis of 69 of these industries for which we could obtain complete data, the number of eligible workers in these industries could more than double if no additional criteria were used, but would expand by less than 10 percent if industries had to meet more restrictive criteria, such as demonstrated increases in the import share of the domestic market over a 3-year period.” The industry certification would be done at the detailed 4-digit level of NAICS classification. - United States Congress, Trade Act Extension Act of 2015, https://www.congress.gov/114/plaws/publ27/PLAW-114publ27.pdf.
- Current petitions for TAA typically use data about imports of articles, classifying goods and services with the harmonized trade schedule. State workforce agencies don’t have readily available information about the goods produced by individual workers, which could make individual based applications for TAA based on increased import penetration difficult to process.
- “Industry Certification Would Likely Make More Workers Eligible, but Design and Implementation Challenges Exist,” United States Government Accountability Office, 2007, https://www.gao.gov/assets/270/263136.pdf.
- Robert Robertson, “The Worker Adjustment and Retraining Notification Act, Revising the Act and
Educational Materials Could Clarify Employer Responsibilities and Employee Rights,” General Accountability Office, September 2003, https://www.gao.gov/assets/240/239817.pdf. - Individual eligibility could function similar to unemployment insurance which is based on fact finding by state officials from individuals and from employers, based on a set of criteria.
- “US Department of Labor announces $1.4 million in TAA technical assistance grants to provide technical assistance and outreach to dislocated workers,” U.S. Department of Labor, June 8, 2010, https://www.dol.gov/newsroom/releases/eta/eta20100608-0.
- Lynn Minick, “Rapid Response and Dislocated Worker Programs: What Should States Do? and What Are They Doing?” National Employment Law Project, July 2010, https://s27147.pcdn.co/wp-content/uploads/2015/03/RapidResponseBetterPractices.pdf.
- “2018 State TAA Program Statistics,” U.S. Department of Labor, https://www.doleta.gov/tradeact/taa-data/2018-state-program-statistics/TAPR_2018.cfm?state=US.
- See Program Year 2015 WIA Annual Report,” Summary of National Results, Employment and Training Administration, United States Department of Labor, 2015, https://www.doleta.gov/performance/results/ with entered employment rates of 60 to 68 percent.
- David Autor, David Dorn, and Gordon H. Hanson, “The China Syndrome: Local Labor Market Effects of Import Competition in the United States,” American Economic Review 103, no. 6 (2013): 2121–168, http://www.jstor.org/stable/42920646.
- Peter Schochet and Ronald D’amico, “The Evaluation of the Trade Adjustment Assistance Program: A Synthesis of Major Findings,” Mathematica Policy Research, December 30, 2012 https://www.mathematica-mpr.com/our-publications-and-findings/publications/the-evaluation-of-the-trade-adjustment-assistance-program-a-synthesis-of-major-findings
- Hyman, Benjamin, “Can Displaced Labor Be Retrained? Evidence from Quasi-Random Assignment to Trade Adjustment Assistance,” January 10, 2018, available at SSRN, https://papers.ssrn.com/sol3/papers.cfm?abstract_id=3155386.
- “Trade Adjustment Assistance for Workers Program, FY 2018 Annual Report,”U.S. Department of Labor, https://www.doleta.gov/tradeact/docs/AnnualReport18.pdf.
- A payment equivalent to two weeks of TRA benefits would provide a meaningful incentive and enable families to catch up on bills.
- Generally workers in apprenticeships don’t qualify for TRA because they are working for pay during their training.
- WIOA currently requires states to review their eligible training provider list every two years based on standards set in their states. TAA should follow WIOA’s standards, but additional more stringent federal standards would be beneficial for both programs. “Training and Employment Guidance Letter 41-14,” U.S. Department of Labor, June 26, 2015,
https://wdr.doleta.gov/directives/attach/TEGL/TEGL_41-14_Acc.pdf. - “Workforce Innovation and Opportunity Act (WIOA) State Negotiated Performance Planning, Guidance and Agreed Upon Goals,” U.S. Department of Labor, https://www.doleta.gov/performance/guidance/negotiating.cfm. TAA and WIOA now have common performance measures so states should be adept at negotiating goals for both.
- “What Works in Job Training,” U.S. Department of Labor, Commerce, Education, and Health and Human Services, July, 2014; see especially page 10 and the references therein, available at https://www.dol.gov/asp/evaluation/jdt/jdt.pdf. See also Mark Elliot and Anne Rader, “Escalating Gains: Project QUEST’s Sectoral Strategy Pays Off,” Economic Mobility Corporation, April, 2017, https://economicmobilitycorp.org/escalating-gains-project-quests-sectoral-strategy-pays-off/.
- “Trade Adjustment Adjustment Community College and Career Training Grants,” U.S. Department of Labor, Office of Inspector General, July 26, 2018, https://www.oig.dol.gov/public/reports/oa/2018/02-18-201-03-330.pdf.
- “Displaced Workers Summary,” U.S. Bureau of Labor Statistics, August 28, 2018, https://www.bls.gov/news.release/disp.t07.htm, and “Trade Adjustment Assistance for Workers Program, FY 2017 Annual Report,” U.S. Department of Labor, https://www.doleta.gov/tradeact/docs/annualreport17.pdf.
- “Guidelines for a just transition towards environmentally sustainable economies and societies for all,” International Labour Organization, October 22, 2018, https://www.ilo.org/wcmsp5/groups/public/—ed_emp/—emp_ent/documents/publication/wcms_432859.pdf.
- TAA benefits were set federally until 1982.
- “Trade Adjustment Assistance for Workers Program, FY 2018 Annual Report,” U.S. Department of Labor, https://www.doleta.gov/tradeact/docs/AnnualReport18.pdf.


