Of all the great economic anxieties, there’s something particularly disquieting about the potential of artificial intelligence and other forms of technology replacing human labor. Some estimates indicate that as many as 47 percent of current jobs could be replaced by technology.1 Even the most conservative estimates find nearly one in ten jobs at high risk of automation, which would still constitute a seismic change in the economy. While many have disputed that there is evidence of the rise of job-stealing robots, one does not have to look further than the rise of Amazon and the fall of traditional retail to see the potential for technology-related job loss.2 The uncertainty related to rapid advances in technology adds to the anxiety—take the 4.1 million Americans employed in driving occupations who could be quickly displaced by developments in autonomous vehicles.3 What matters is the pace of these changes—if they evolve over time, workers and communities have the chance to adapt to a new economy; but if they happen rapidly, large numbers of workers can get displaced without the skills needed to qualify for other available jobs.
Designing a policy response for such uncertainty is challenging. This report will focus on the trade adjustment assistance (TAA) program as a ready-made model that could be expanded to the challenge of technology-related job loss. While certain improvements are needed, TAA has the ingredients of a comprehensive response to job loss, including retraining, extended income support, case management, health care protection, wage insurance, and relocation assistance. It also provides a model for the delivery of additional assistance to workers who experience a shock from the economy, and a way for the “winners” in the economy to ensure that fewer workers are left behind by technological change.
The report will start with a review of the research to date on technology-related job loss, and the growing consensus on the types of tasks that are vulnerable to displacement. It will reflect on the research done on what we know about previous spells of major displacement and their impact on workers, especially the trade-related job losses addressed by trade adjustment assistance. It will then review the key elements of a policy response to this risk, focusing on the possibility of expanding trade adjustment assistance, proposing a pilot program that will first designate occupations as being vulnerable to technology-related job losses, and then open up applications by states to operate an economic adjustment program for workers in occupations experiencing significant job losses. Lastly, we will conclude with ideas for improving the underlying TAA program.
Technology and Unemployment
Will advances in technology lead to widespread unemployment? This is one of the most passionate public economic debates of our time, one set off by rapid advances in computer technology. While there is significant disagreement about whether technology would decrease levels of employment in the United States, there is substantial consensus about the types of tasks that may be at risk of being replaced by automated technologies.
Rapid Advances in Computing Technology
The rapid advances in the capacity of computing technology are raising the specter of “technological unemployment:” permanent job loss caused by labor-saving technology. In 1965, Gordon Moore, the co-founder of Intel, predicted that the per-dollar computing speed of microchips and other processors would double every year—a prediction so crucial that it’s become known as Moore’s Law. As chronicled by MIT’s Erik Brynjolfsson and Andrew McAfee in their book, The Second Machine Age, this prediction of exponential growth has largely come true.4 For example, in 1996, the government invested $55 million in ASCII RED, the first supercomputer to reach one teraflop of processing speed; nine years later, the Sony Playstation reached this same processing speed at a cost of $100 per unit. The increase in processing speed is the underlying resource making possible previously unimaginable advances in artificial intelligence (AI) and automation.
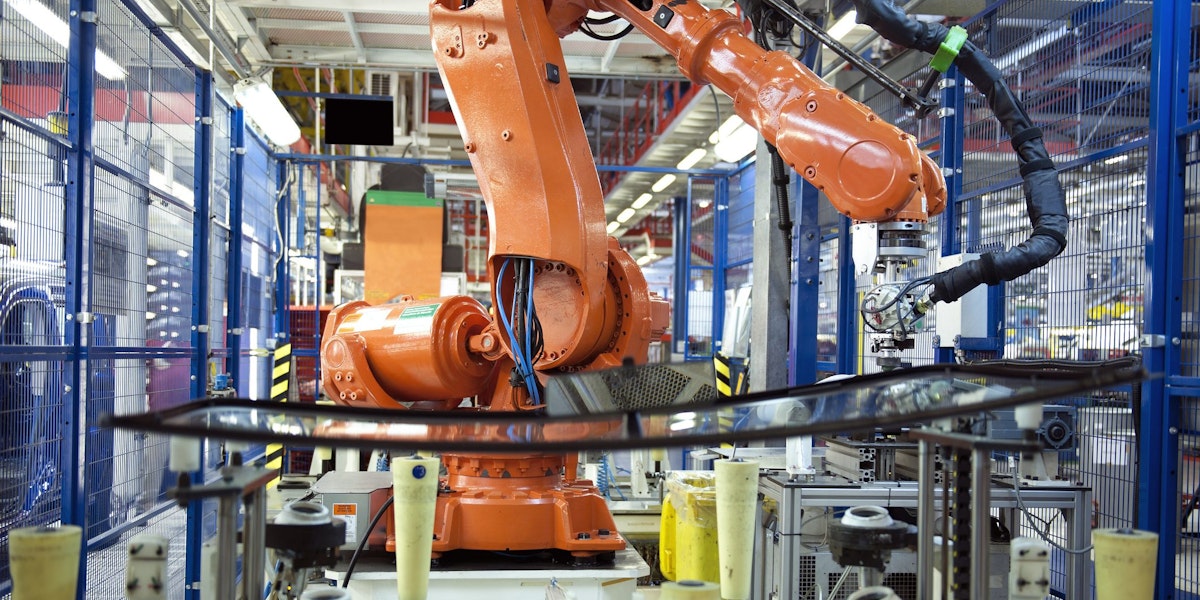
The process of automation, with robots or computer programs doing the work once completed by humans, has been happening for decades, from factories where robotic arms work in assembly lines to office software that completes routine clerical work. The speed of computing alone is making these processes more effective. The computing power in a smart phone, alongside databases and handheld software, has empowered automated retail to rapidly outpace traditional retailers and wholesalers, leading to rapid transformations in the economy.
Moreover, automated technologies, like industrial robots, have generally been limited to tasks that could be programmed in advance and were repetitive. Tasks that seem relatively simple, like repairing a windshield or picking and packaging the right size and style of box in a warehouse, have been beyond the practical reach of computers because there are too many permutations to program in advance.
Artificial intelligence has the potential to tackle this next frontier of automation. AI allows computer-driven processes to learn how to do more complicated tasks by analyzing data and learning from trial and error. The increased processing speed has allowed computers to learn these tasks so quickly and efficiently that they now mirror aspects of human intelligence. A common example has been game-playing, wherein AI programs can rapidly analyze different moves and countermoves and troves of data, using that processing advantage to best even the highest-level human players. Well-known examples include Alphabet Inc.’s AlphaGo, which became the first computer to beat a professional Go player, and IBM Watson, who bested Jeopardy! all-time champion Ken Jennings.
The increased availability of data is creating new frontiers for artificial intelligence. Not only can computers analyze data more quickly: now there is much, much more data available to analyze. This combination has the potential to have automation become a much more powerful component in the economy, by automating tasks previously thought to be too complex for machines. Take driving, which was a task identified by experts as recently as 2004 as being unlikely to be automated.5 The laser “eye” of the Google autonomous car can collect and analyze 1.3 million points of data per second, allowing it to create a 3D model of its surroundings that the car’s algorithms can react to and drive through.6 This capacity will be enhanced as more cars on the road collect this data and share it with nearby vehicles—a capacity that already exists in smartphones and enables route-enhancing apps like Waze. In terms of robotics, this technology will enhance the ability of robots to learn how to do tasks by sensing their environment, calculating different scenarios, and engaging in rapid trial-and-error calculations. The advances will enable computerized processes to more closely resemble human decision-making, hence the term “artificial intelligence.” Assuming that Moore’s Law holds, these advances in AI will continue to propel the capabilities of automated technology into previously, and even currently, unimaginable territory.
Technology’s Effect on Overall Employment and Wages Is Unclear
Employment changes due to technology are nothing new in the economy. Rapid advances in technology have decreased agricultural employment from 40 percent in 1900 to less than 2 percent today, even though agricultural output has increased.7 The underlying economic assumption is that AI and other “job-killing” technology improvements will only gain market share if they are more effective and productive than current labor.8 The increase in productivity will increase income and spending power for individuals and companies, creating demand for new types of good and services. For example, the conventional wisdom was that the growth of ATM machines would largely replace bank tellers.9 But in fact, they’ve allowed banks to increase the number of branches, each with fewer tellers focused more on customer service.
The key question is whether the rapid development of artificial intelligence will replace jobs faster than new uses for human talent are invented. This is a question that has been asked as far back as John Maynard Keynes, who warned of the possibility of technological unemployment, namely “unemployment due to our discovery of means of economising the use of labour outrunning the pace at which we can find new uses for labour.”10 And at least part of that question is whether the rate of technological change will come faster than the ability of workers to adapt and, if necessary, retrain for new jobs. In recent years, leading thinkers as diverse as Andrew Stern, former president of the Service Employees International Union,11 to Elon Musk of Tesla12 have predicted that technology will replace so many jobs that a universal basic income will be needed to support the population. The World Economic Forum predicts that a technology-driven ‘fourth industrial revolution” will only add one new job for every three jobs eliminated.13
Other analysts are more optimistic. McKinsey predicts that increases in productivity (0.8- to 1.4-percent increase in annual productivity growth) will maximize the current world workforce rather than replace it. David Autor, a professor of economics at MIT, concludes that the “complementarities between automation and human labor will [on the whole] increase productivity, raise earnings and augment demand for labor.”14
Most analysts agree that the largest effects of automation on employment will be in coming years, through further technological advances. The most concrete evidence to date comes from the introduction of industrial robots in manufacturing. From 1990 to 2005, the quality-adjusted cost of industrial robots dropped down by one-fifth, leading to a trebling of use of robots in relevant industrial sectors.15 A widely-cited econometric analysis by Daren Acemoglu and Pascual Restrepo, two economists at Boston University, estimates that each industrial robot reduces net employment by six workers, not just in the factories but in entire communities impacted by spillover effects.16 To date, on a national scale these effects are small, amounting to approximately 40,000 jobs lost—for context we should note that, in recent years, trade policy changes and the import shock from China have contributed to at least four times as many job losses.17 Indeed, the problem is that overall productivity growth in manufacturing has been growing too slowly due to limits in automation technology, as well as the slow pace of small- and medium-sized manufacturers to adopt high-productivity strategies, such as Toyota-style lean project management.18 One analysis finds that occupational churn in the United States has decreased to historic lows, indicating that overall technological-related job change has slowed down in recent years.19
The other primary concern is whether technology is contributing to increased inequality due to labor market polarization, with growth in the high- and low-paid ends of the workforce but slowing in the middle. Automated technologies (by robots and computers) are most adept at replacing tasks with well-codified procedures.20 The first wave of automation in factories and the rise in personal computers led to decreases in routine middle-class employment. Examples include well-paid blue collar jobs, like machine operators in factories, that required reliability and attention to detail, but were repetitive enough in nature that they could be. Similarly, secretarial and sales occupations required orderly record-keeping, production of documents, and scheduling that was able to be programmed into word processing, spreadsheets, and database applications. During this period there were larger increases in both non-routine jobs that were low-paid as well as those that were high-paid.21 Janitors and house cleaners are good examples of low-paid non-routine applications. Generally, the physical environment facing such cleaners is varied, as are the techniques need to clean (although in recent years technologies like iRobot’s Roomba have showed potential for automation). Professional jobs like management also embody a great degree of variability and would be described as anything but routine. In short, the rise of automated technologies helped to hollow out the U.S. middle class. The evidence of the causative role of technology on inequality is not conclusive, however. Another factor has been trade liberalization, which also contributed to the loss of blue-collar middle-class jobs over this period, and since 2000 the trend of growth in non-routine occupations at the top appears to have moderated.22
Task-Based Analysis and Identifying At-Risk Jobs
While there is great debate about the net employment impacts of artificial intelligence, automation, and related technologies, there is a growing research consensus on the types of work that could be impacted over the next several decades. Increasingly, research is using rich data on occupational duties contained in the U.S. Department of Labor O*NET database, which breaks down each occupation in the economy by the types of tasks for which they’re responsible.23 The database collects detailed information on 974 occupations using the standard occupational classification, and is updated periodically through a data collection program with 277 descriptors for each occupation.24
As described above, David Autor and his colleagues have analyzed this data and provide a broad typology of the types of jobs that are at greatest risk of being replaced by technology, including those that have already been impacted. Figure 1 further elaborates on the task-based analysis pioneered by Autor, and his colleagues. They divide occupational tasks by two major dimensions: whether the tasks are cognitive or manual, and whether the work required is routine or non-routine. As computing power increases, there will be more automated processes (including but not limited to robots) that are able to perform routine tasks more efficiently than humans; this applies to both cognitive and manual tasks. Non-routine, harder-to-automate work includes cognitive tasks that require problem solving, intuition, persuasion, and creativity, which can be divided into analytic work done by engineers and scientists or more interpersonal cognitive work like health care. As discussed, technology is also challenged to replicate non-routine manual occupations like repair jobs that require the ability to adapt to a variety of situations, complex visual and language recognition, and frequent interactions with other people. Their analysis finds that non-routine cognitive tasks occupied an increasing percentage of the economy from 1960 to 2000 at the expense of routine tasks, with trends flattening from 2000 to 2009.
Figure 1
| Jobs at Risk for Automation, by Task Type | ||
| Cognitive | Manual | |
| Routine | Endangered
(Sales and clerical occupations) |
Endangered (Production occupations) |
| Non-Routine |
Safer Cognitive-Analytic (Professional and technical occupations) Cognitive-Interpersonal (Health care occupations) |
Safer
(Repair occupations) |
| Source: Author and Price (2013).25 | ||
Carl Benedikt Frey and Michael A. Osborne, two researchers at the University of Oxford, also used an O*NET task analysis to look further at non-routine occupational tasks at risk of replacement due to further advances in machine learning and mobile robotics.26 Examples of non-routine cognitive jobs now being accomplished by technology include fraud detection, certain types of health care diagnosis, and monitoring of physical infrastructure, such as water pipes. Their main finding is that nearly half of U.S. workers (47 percent) are in occupations that could be replaced by technology in the coming decades, including a much larger share of low-wage service occupations than have been at risk in past waves of advances in computer technology.
Most importantly, for the purposes of thinking about how to prepare for possible worker displacement, Frey’s research (conducted in concert with robotics experts) identified a set of skills within jobs (as defined by O*NET) that serve as barriers to the computerization of tasks. These include unique human advantages in perception and manipulation (applying to non-routine manual tasks), such as the abilities of fingers to manipulate and assemble very small objects, and human advantages (over robots) in doing manual work in cramped worked spaces. They also codify aspects of human intelligence that AI has a harder time mimicking, including the creative ability to generate new ideas and solutions—a signature trait of many fields, such as business, engineering, health care, and education, and especially the fine arts and the broad area of social intelligence that requires gauging people’s reactions, negotiating, persuading, and assisting others.
While Frey and Osborne’s earlier research accelerated the debate about the impact of artificial intelligence and automation, further research by others has sharpened our understanding of the potential impact of the acceleration of technology. The McKinsey Global Institute has published an important series of reports using a similar task-level analysis. They first group tasks and then rank them by automatability. Collecting data, processing data, and predictable physical tasks score as most “automatable,” while managing people, applying expertise, interfacing with stakeholders, and unpredictable physical activities score as least automatable.
The institute finds that 50 percent of all working hours in the United States could be replaced if companies were able to “adapt currently demonstrated technology” in a cost-effective way to those tasks. While the conclusions are similar to those of Frey and Osborne, McKinsey’s finer-grained research has pointed out that most occupations have a mix of tasks, including ones that can as well as ones that can’t be outsourced.27 Figure 2 illustrates a critical take-away from the research. Mckinsey finds that less than five percent of occupations can be fully automated, while most U.S. jobs (60 percent) have 30 percent of tasks that could be automated. The future of these jobs that have at least 30-percent-automatable tasks is unclear: as technology takes on more tasks, jobs could be downskilled, if not eliminated. But with the right training, many of these workers could retain employment in jobs where technology complements their skills. Intelligent analyses of test results could, for example, transform radiology technicians from a highly-skilled to a medium- to low-skill job.28 Another challenge is how technology is facilitating the fragmentation of occupational roles, with firms able to contract out for smaller tasks rather than hire workers with benefits.29 Applying the methods developed by McKinsey, the Center for an Urban Future in New York concluded that only 7,000 jobs in New York City are fully automatable, but that one in three New Yorkers are in jobs that have 30 percent more of their tasks at risk of automation.30
Figure 2
Recent studies by the Organisation for Economic Co-operation and Development (OECD) have also questioned the larger estimates first advanced by Frey and Osborne.31 By using data with a greater amount of detail on occupations and the types of tasks in them (largely from Canada but verified against other international data), they find that just under 9 percent of the jobs in the United States are highly susceptible to automation and artificial intelligence (jobs where 70 percent of tasks could be replaced).32 This finding comes from the revelation that occupations are increasingly characterized by the extent to which they involve tasks that are more difficult to automate (perception and creative and social intelligence). Still, the authors find that across OECD nations, 14 percent of all jobs, representing 66 million workers in thirty-two nations, are at high risk depending on how quickly technologies come on line and how workers’ roles shift.
The World Economic Forum’s ongoing research has contributed to our increasing understanding that while technology will lead to large employment losses, the right reskilling approaches should allow workers to transition following technology-related job loss. The Forum’s initial work found that for every job gained through improvements in technology, three jobs would be lost, and that women would suffer disproportionately (for whom only one job would be gained for every five lost).33 However, a subsequent analysis comparing the skills of jobs that the Forum predicts will shrink to those that will remain viable finds that 96 percent of workers could find a good fit in a new job, often by reskilling into a entirely new field of occupations.34
Several other analyses have used similar task-based analysis. Mark Muro and colleagues at the Brookings Institution have analyzed the tasks of U.S. occupations and found that the proportion of tasks involving computers and technology has increased by 57 percent over the past fifteen years.35 Similar to Autor, they find that the share of jobs with high and medium digital skills have increased, like software developers and financial managers (high digital skills) and auto mechanics and registered nurses (medium digital skills). And those with low digital skills, like security guards and construction laborers, have decreased. This too indicates that jobs are being changed by the demands of technology alongside a changing occupational mix, with automotive mechanic serving as a prime example of a job that now requires significantly more use of computer diagnostics than it did just a few years ago. Brookings’ work is a good reminder that when analysts are talking about the impact of automation and artificial intelligence changing the nature of work, they are not simply referring to a robot literally sitting in the seat once occupied by a worker. Rather, analysts are identifying the broad set of computer-assisted technologies that are changing how tasks are completed.
A more recent analysis by Bain forecasts net employment losses of 30–40 million workers in the United States, with large impacts on low- and middle-income workers that will deepen income inequality.36 That net figure accounts for the 18 percent of employment losses that will be mitigated by income gains from increased productivity. As displayed in Figure 3, Bain forecasts that automation will heavily impact service-sector industries like retail, hotels, restaurants, and transportation, with employment losses after 2020 that could exceed major employment losses in agriculture, manufacturing, and construction during previous economic transformations. Bain notes that, in part, accelerating advances in automation and artificial intelligence are needed to maintain economic growth as the U.S. workforce decreases. A major portion of this growth is the development of “cobots,” robots that work in coordination with humans to get tasks done more productively, which may in fact make the United States more competitive with low-cost-labor nations like Mexico in manufacturing.
Figure 3
Research Findings Point Way to a Policy Response
In sum, the findings of the research done to date are promising for those developing public policy responses to the issue of technology-related job loss. There are now increasingly replicable methods for identifying tasks that are the most automatable, and which jobs have the highest concentration of such work. There’s a good understanding of which types of tasks are less likely to be impacted by technology due to constraints, such as the inability of artificial intelligence to replicate human creativity and certain physical requirements. There’s less clear, but still solid, understanding of how automation, artificial intelligence, and other computer technologies put jobs at risk. Also unclear is the pace of technological change, and to what extent workers will lose employment altogether as opposed to their jobs merely changing. In others words, it’s unclear whether there will be net employment loss, changes in the types of jobs in the economy but without major employment losses, or little change in occupational employment due to technology.
If net employment loss ends up being the result, there will need to be both policies to permanently boost the incomes of Americans and provide retraining. If there is less net employment loss, but significant changes in occupational mix and occupational demands, retraining and temporary adjustment policies will be more effective. Any policy response designed in the next several years needs to be geared towards addressing this substantial uncertainty, and with an awareness of the significant consequences of permanent job loss and the challenges of getting rehired at good wages.
Impacts of Worker Displacement
Americans fear the prospect of widespread technology-related job losses because of the dismal experience of Americans who permanently lose their jobs. However, many observers, including leading progressive thinkers,37 have argued that productivity-enhancing technology grows the economy and thus will increase net employment.
Even if this is true economy-wide, there is overwhelming evidence that those individuals who are directly impacted by permanent job losses experience lasting damage to their career. Since the early 1980s, the Bureau of Labor Statistics has conducted the Displaced Worker Survey, which seeks to understand the impact on workers whose positions have been eliminated. Experienced workers who lose their jobs face a double disadvantage: they lose out on extra pay they’ve earned as a result of demonstrated loyalty and company-specific knowledge; and they are more likely to have skills made obsolete by technology and economic changes.
Figure 4
The ways in which these workers whose jobs have been eliminated are disadvantaged include:
- High rates of unemployment: Figure 4 displays data from the most recent Labor Department survey (2016), which reveals that 35 percent of those who had been laid off in the past three years had not been reemployed.38 In January 2016, 15.9 percent of these workers were unemployed at a time when the national unemployment rate was 4.9 percent. Another study found that among those laid-off workers who exhausted unemployment benefits without finding a job during the last recession, 38 percent still remained without a job four to six years later.39
- Reemployment pay cuts: Those who do find new jobs often endure big pay cuts: workers laid off during the last recession had an average earnings decline of 17.5 percent, greater than during the prior two recessions.40 More than two-thirds of those unemployment insurance (UI) exhaustees who found employment had to switch their industry or occupation to do so.41 Displaced workers face a very difficult road in getting back to their pre-layoff wage, with wage scarring as long as 20 years post-displacement.42 Men lose an average of 1.4 years of post-displacement earnings if mass layoffs occur when the national unemployment rate is low (below 6 percent) and 2.8 years if it is high (above 8 percent).43
- Health impacts: The health impacts of permanent job loss are severe. Not only do long-term unemployed workers face stress, more than half put off needed health care.44 The mortality effects of displacement are severe, with an increase in death rates of 10 to 15 percent many years after a layoff.45 Research has found a consistent link between permanent job loss and suicide, contributing to this increase in mortality.46
- Older workers are less likely to be employed, and face greater earnings losses than do younger workers.47 For example in 2011, the average period of unemployment for older job seekers (over fifty-five) was 52.2 weeks compared to 37.5 weeks for younger workers.48 To give a sense of the relative difficulties, displaced men ages fifty to sixty-one are 39 percent less likely to be reemployed than otherwise similar men ages twenty-five to thirty-four.49 Older workers cite job hiring as the most likely site of age discrimination, and the EEOC received more than 20,000 complaints of age discrimination in 2016.50
The damage on workers is greatest when large numbers of workers lose jobs in a short period of time. Over their working lifetime, those who are displaced when the national unemployment rate is 8 percent lose 2.8 years of their pre-displacement earnings, compared to 1.4 years among those laid off when the unemployment rate is low (6 percent or less.)51 This is one reason that the promise that liberalized trade will bring greater living standards and new jobs has fallen flat. For example, the liberalization of trade with China in 2000 rapidly exposed U.S. workers to import competition and job loss in manufacturing. Among those who lost their jobs because of the rapid increase in trade with China, 10 percent end up on federal disability insurance and permanently out of the labor force. High levels of trade exposure decrease the overall employment levels of entire communities, not just those who lost their jobs.52
Policy Responses to Technology and Unemployment
Workers and communities need help cushioning the significant impacts of displacement described above. As major advances in technology threaten further waves of worker displacement, it’s time to think about more aggressive responses. Technologists and other leaders concerned about large job losses have proposed a universal basic income to provide minimum living standards and increase the leverage of displaced workers. As an alternative to a universal basic income, proponents of a federal jobs guarantee would have the government hire displaced workers and other long-term unemployed into beneficial community work, such as tutoring.
Workers and communities need help cushioning the significant impacts of displacement described above. As major advances in technology threaten further waves of worker displacement, it’s time to think about responses that could scale to meet potentially massive disruption. The United States spends only 0.1 percent of its GDP on active labor market policies to support transitioning workers, compared to 0.6 percent among other OECD nations.53 Even if one accepts only the lowest, most conservative estimates of impending technology-related job losses, the current level of spending would still be insufficient. A more robust response would have a number of critical elements:
- Funding for retraining: Retraining grants should not just focus on short-term training, but include the availability of longer-term training programs that often are needed to switch into a new occupation.54 Importantly, training grants should include both short-term training and longer programs, like those at community colleges that can lead to a degree or a recognized post-secondary credential.
- Income Support: Workers permanently dislocated from their jobs face an extended period of time wherein they will face no or lower wages. Ideally, wage replacement programs that allow workers to complete full-time training will result in reemployment at a good wage.55 If that’s not viable, wage replacement should provide a bridge to retirement, make up for lost wages upon reemployment at a new job, or supplement earnings for workers working part-time while retraining in a classroom, in an on-the-job training program, or through an apprenticeship.
- Work-based learning: Reemployment approaches should facilitate easy access to work-based learning, including but not limited to apprenticeships, accommodating those dislocated workers who are more likely to learn by doing than while in a classroom.
- Reemployment services: Workers should receive personalized reemployment services that guide them into new positions, and even new occupations, using their existing skills. This should include help with relocation expenses if necessary, but many experienced workers who have not had to look for a job for many years can benefit from job search assistance that targets their own community.56
- Community economic development: Reemployment services only work if there are jobs available. Communities suffering from an overall general decline in employment need strategic federal economic development assistance.
- Early warning: The government should play a proactive role in monitoring occupations that could be at risk through adaptations of currently available technologies and be prepared to seamlessly deliver services to a wide group of workers as soon as significant dislocations begin.57 When appropriate, government should incentivize companies to retrain workers in ways that adapt them to new automated technologies and that maximize those technologies’ potential, rather than simply replacing the workers.58
There are a variety of approaches to expand assistance to workers threatened by dislocation towards the vision outlined above. These include the creation of a universal program for all dislocated workers, the expansion of the Just Transition framework, and the expansion of Trade Adjustment Assistance (TAA) to technology-impacted workers. This paper goes into depth about the possibility and merits of expanding TAA, providing more details to an idea that has been briefly mentioned in the literature but not fleshed out. Before doing so, we will highlight the two other leading approaches, both of which also merit close attention from policymakers and researchers.
Universal Dislocated Worker Benefit: One approach is to create a stronger, universal program for displaced workers, regardless of why an individual has lost their job. Mark Muro of the Brookings Institution makes a compelling case for a universal adjustment benefit that would include access to job search counseling, training grants, relocation grants, and wage insurance, and which would apply to workers permanently losing their jobs due to trade, technology, or other reasons.59 In its fiscal-year 2014 budget proposal, the Obama administration proposed consolidating different U.S. programs, including dislocated workers benefits provided by the Workforce Innovation and Opportunity Act (WIOA)60 and Trade Adjustment Assistance into a combined universal dislocated worker program that would provide each worker with an $8,000-per-person training voucher and a seventy-eight-week extension of unemployment benefits so workers can complete that training. This fiscal-year 2014 proposal would have increased annual spending on dislocated workers by an average of $1.8 billion per year, essentially doubling current spending.61 The advantage of these universal benefit proposals is that they would be far simpler to access and use than is our current patchwork of programs, and could adapt to a variety of threats to employment (including trade, globalization, climate change, and technology).
Just Transition: Just Transition, another framework gaining momentum in the labor movement, envisions a collaborative process among community, labor, and government and has been a key part of proposals to help industrialized nations move towards a clean economy.62 In the example of the decommissioning of the Diablo Canyon nuclear plant in Southern California, an agreement negotiated extended pre-layoff notice to workers, retraining and redeployment provisions, and a “just transition” fund that made up for property tax dollars lost by the local community.63 The focus of Just Transition on redeveloping communities is particularly welcome: retraining strategies can only work in local economies that are able to develop other employment opportunities. Applying the Just Transition process to technology-related job loss would require companies engaging in significant job losses to negotiate transition packages with their employers and community level readjustment efforts like the Base Realignment & Adjustment Commission to redevelop communities with high levels of job loss.64
Protection of health benefits: Dislocated workers need continued access to health insurance and should have the option of maintaining access to their employer-based coverage through COBRA.
Expanding Trade Adjustment Assistance: Another option suggested by a number of experts, such as Robert Atkinson of the Information Technology Innovation Foundation, is to expand the existing Trade Adjustment Assistance program to cover technology-related job loss.65 The main contribution of this report is to flesh out this option, which could provide a path for a relatively simple pathway to the policy vision outlined above. Congress has been more generous with funding TAA’s more targeted approach of support, allocating around five times more per participant to retraining than the WIOA Dislocated Worker program. TAA already has many of the elements listed above, unlike the more limited WIOA Dislocated Worker program. While the latter could be reformed into a generous universal program for all dislocated workers, including those who lose their job through technology, the historic stinginess of our aid to dislocated workers speaks to the political challenge to that approach. Extending TAA to include technology-related job loss provides a ready-made avenue for providing more generous reemployment assistance to the next major historical threat to employment in the United States.
The Case for Expanding Trade Adjustment Assistance
Our Most Generous Program for Dislocated Workers
Since the 1960s, Congress liberalized trade with the goal of boosting the economy, knowing that certain groups of workers would be negatively impacted. TAA was meant to cushion these negative impacts, helping redeploy human capital to a changing economy all while bolstering public support for trade.66 Created in 1962, Trade Adjustment provides federal support both for tuition for retraining, extended income support so workers can provide for themselves and their families while they retrain, and an increasing array of reemployment options. Significant expansions to the program were made in the Trade Act of 2002 and the American Recovery Reinvestment Act in 2009, but then narrowed in 2011.67 The program was most recently reauthorized in 2015 through 2021. The current benefits provided by TAA include:
- Trade readjustment (TRA) benefits: TRA benefits provided extended income support beyond what is provided by unemployment insurance. TAA qualifies workers for 104 additional weeks of payments (at the same level) beyond what UI provides. Workers can only receive the full TRA allotment if they are in a retraining program, but can get a waiver of training in limited circumstances for the first twenty-six weeks of assistance.68
- Retraining: TAA pays for a wide variety of training programs, including post-secondary education, classroom training, apprenticeship, and customized training, as well as remedial education like language classes for workers for whom English is not their first language. The average per-participant spending on training in TAA is $11,000. That’s far greater than the average short-term training provided by the WIOA dislocated worker services, which is just $2,861 per participant.69
- Continued health care benefits: TAA recipients can maintain their employer-based health insurance through the health care tax credit (HCTC), which covers 72.5 percent of a family’s premiums. Like the credits provided by Affordable Care Act, the HCTC is paid each month directly to insurance companies.70
- Wage insurance: TAA provides wage insurance, known as Reemployment Trade Adjustment Assistance (RTAA). RTAA recipients receive up to $10,000 over a two-year period. RTAA payments are equal to half of the difference between a TAA recipient’s pre-layoff salary and their new job. Only workers earning $50,000 or less in their new jobs are eligible for RTAA.71
- Relocation and job search allowances: TAA recipients can receive up to 90 percent of the expenses of relocating outside of their community in order to secure a good-paying job, up to a maximum of $1,250.
- Case management and reemployment services: All TAA recipients are eligible for job counseling and case management, including assessments, development of an individualized employment plan, career counseling, and referrals to supportive services like child care.
Eligibility for TAA benefits is limited to workers employed at a firm that is trade-impacted. Each group of workers must petition for eligibility: petitions can be filed by the company, a union, or any group of three workers on behalf of a firm or subdivision of that firm. To prove that trade is a primary cause of their job loss, they must demonstrate one of the following:
- An increase in competitive imports and a decrease in sales of the petitioning company in a narrowly defined similar good or service;
- A shift in production to a foreign country, including moving of production overseas;
- The U.S. International Trade Commission has found that the firm was a victim of unfair trade; or
- That they have been laid off from a firm that supplies a TAA-certified firm.
The Department of Labor investigates petitions and makes determinations on them. A typical petition is reviewed and decided within fifty days of receipt.72 Workers have twenty-six weeks after the petition is certified or after the date of the “adverse impact” (layoff or plant closing) to begin services.
TAA has evolved since its initial passage in 1962 to include a comprehensive set of services recommended by experts and based on international experiences. A lack of income support is one of the main reasons unemployed workers cannot complete training.73 The basic twenty-six weeks of unemployment benefits are not enough time for most workers to find, enroll, and complete a meaningful training course. TAA allows for a wide variety of training options, spanning classroom training to apprenticeship—and it is one of the only retraining programs that would provide long enough retraining for a dislocated worker to claim a post-secondary credential. Unemployment rates remain far lower for workers with college degrees than for those without.74
Starting with 2002 reform legislation, TAA has been expanded to include services beyond retraining. Most dislocated workers take a pay cut when they are re-employed, and wage insurance compensates them for part of that earnings loss. While wage insurance is not a silver bullet for the major challenges of long-term unemployment, this option is particularly relevant for certain workers who may be less motivated to pursue extended retraining programs. Older workers are one such population. RTAA has slowly increased as part of the TAA program, with 12 percent of participants receiving benefits. In addition, many commentators have noted that globalization has increased geographic inequality, and that workers should have the option of relocating to a new community that has greater employment options; TAA now offers such help. The combination of services that TAA provides more than earn its reputation as a Cadillac program.75
Understanding the Results of TAA
In recent years, TAA has gotten an undeserved reputation as an ineffective program.76 TAA does not have an easy job: its recipients are older than the average workforce, adding to reemployment challenges, and moreover they are concentrated in trade-impacted communities that have experienced overall declines in employment and income.77 Despite these barriers, in 2015, 73 percent of TAA participants found employment in the quarter after completing the program, and 92 percent of those retain that employment six months after acquiring it.78 That’s better than the WIOA dislocated-worker program, which posted scores of 65 and 84 percent on the same measures over the same time period.79 As shown in figure 5, this trend has held in recent years, with TAA consistently outperforming WIOA.
Figure 5
While WIOA’s benefits and population have been different, the solid and superior performance of TAA with dislocated workers is not the picture of a failed program.
The negative reputation is largely the result of an evaluation of TAA funded by the U.S. Department of Labor (DOL) that found that those receiving assistance from the program earned about $3,000 less during a four-year follow up period than did those who were not in the program. On its face this finding is not surprising. TAA recipients can be out of work for up to two years in order to attend full-time retraining programs while receiving benefits, making a four-year assessment a problematic framework. The authors of the assessment recognize this, emphasizing that a longer follow-up period would be needed to find out if incremental gains in monthly earnings made up for the time spent away from the labor market in a retraining program.80
The authors of this well-designed evaluation dug deeper than this headline, providing data that reveals some of the strengths of TAA—chiefly that individuals who completed TAA training and found a job in the field in which they’d trained had earnings gains likely to dwarf short-term earnings losses. For example, TAA recipients who completed their training and found a job in their fields received a $5,000-to-$6,000-per-year earnings boost.81 The problem was that only 37 percent of those who completed training were able to find employment in the occupations they trained for.82 This is not simply a failing of the program or its model, but rather reflects the fact that TAA recipients are laid off in communities with few good jobs, regardless of what retraining can be accomplished. As detailed in Amy Goldstein’s book, Janesville: An American Story, community colleges seeking to engage TAA participants faced a labor market where even occupations termed “in-demand” faced major downturns in hiring as decreases in manufacturing reverberated through local economies.83
The current TAA program serves a population facing significant barriers to being reemployed. As stated above, during the recession, as few as half of those permanently separated from a job in the past three years were employed when surveyed.84 The dates of the DOL’s TAA evaluation also count against the significance of its findings, in that it compared workers certified for TAA between November 2005 and October 2006.85 Thus, workers who opted for extended retraining entered the labor market just as the recession began in December 2007, while the comparison group was looking for work while the labor market was strong. (Moreover, the TAA program adopted a number of critical reforms in 2009, which were not available to workers studied under the evaluation).
A more apt comparison is among TAA recipients and those not on TAA who exhausted their regular unemployment benefits and were forced to look for work in a declining labor market. And the DOL evaluation does find that TAA participants compared favorably to those who exhausted their unemployment insurance without finding work but were not in TAA. In the last four quarters of the follow-up period, TAA participants were 11.3 percentage points more likely to be employed than were a comparison group of unemployed workers who had exhausted their benefits and were not eligible to to benefit from TAA. Indeed, those who were in TAA would only have to earn $757 more per year for the rest of their career (after the four-year period in which they earned less) to be better off than UI exhaustees over their lifetime.86 A longer-term evaluation would likely find that those who completed TAA and moved on to employment did better than those who just exhausted UI with no option to extend benefits for additional training. In short, it’s time for a closer look at the results of TAA, and to put to bed the idea that it’s an “ineffective” program.
Improving TAA
Historically, the greatest TAA-related concern among those researching active reemployment measures is that the generous benefits provided by TAA have been difficult to access. A Demos analysis found that 1.5 million jobs were lost to trade from 2002 to 2007, but only 1 million of those jobs were certified for TAA.87 Structurally, the group petitioning process is laborious and limits the numbers of workers who become certified for TAA, and even if certified, many don’t collect. For decades experts and Congressional leaders have explored alternative means for certification, such as certifying entire industries and not just individual workplaces.88
Another major concern is the limited wage replacement provided by TRA benefits. TRA benefits were reduced from 70 percent of prior earnings to UI levels (typically capped at 50 percent) in 1982, and were only payable (with limited exceptions) to workers in retraining programs. This modification substantially reduced the share of jobless workers receiving TAA benefits.89 It also made it more difficult for many workers to complete training. Struggling to pay bills on a TRA check that is at most half of their prior wages, many TAA recipients drop out of training before being able to complete their program, or fail to sign up for training at all. International examples like Denmark’s flexicurity program pay up to 90 percent in wage replacement for workers in retraining.90
As Congress considers the reauthorization of TAA in 2021, it will have the opportunity to improve the program in multiple ways.The first set of reforms should involve bringing the program back to the standard set by the American Recovery and Reinvestment Act. TAA legislation passed in 2011 peeled back several important reforms made in the Recovery Act, reforms that need to be restored:
- Benefit length: One key issue is allowing workers enough time to complete meaningful training and education. In particular, TAA recipients should be allowed an additional twenty-six weeks of TRA benefits for workers who need remedial education, before entering occupational or classroom training. TAA should return to its 2009 status, offering jobless workers time to complete a full two-year program after their regular unemployment benefits, by offering a total of 130 weeks (a net of 104 weeks after the twenty-six weeks of UI). Current rules limit the last thirteen weeks to students demonstrating progress, which could dissuade enrollment in longer-term programs.
- Wage insurance: Wage insurance is not a silver bullet to the problem of job loss, and should not weaken the focus of TAA on retraining for good-paying careers.91 That being said, wage insurance is covering a slowly increasing percentage of TAA benefits (now 12 percent of what TAA participants receive) and constitutes a useful benefit for workers that go back to work with a pay cut. Wage insurance should be restored to the $12,000 max over two years (an equivalent of $500 per month) and the cap should be increased from $50,000 to $55,000.
- Training waivers: The 2011 legislation eliminated three reasons that workers could waive training and still receive extended TRA benefits: when they had a definite date to be recalled to work; when they had marketable skills and did not need retraining; and when they were within two years of retirement. Restoring this last provision is of high priority. Part of TAA’s role is to compensate workers and communities for the collateral damage of free trade, and creating a reliable bridge to retirement is a cost-effective way to do so.
Beyond returning to its 2009 assistance levels, there are several other ideas that might strengthen the TAA program. These include several ideas that have been proposed in previous reauthorization debates, as well as other, more speculative changes:
- Easing certification: Simplifying the certification process would make it easier for more bona-fide trade-impacted workers to receive benefits. The U.S. Government Accountability Office (GAO) found that a prior congressional proposal to certify an entire industry as TAA-eligible if firms in that industry had three TAA certifications in the past 180 days could as much as double the number of workers covered.92
- Link automatic investigations to WARN Notices: Under the Work Adjustment and Retraining Notification (WARN) Act of 1988, any firm that lays off more than fifty workers must give at least sixty days notice to the workers and the government. WARN should be modified to require firms to notify the government when the layoff is a result of a shift of production overseas or as a result of import competition for a similar article or service. This WARN notice should trigger an automatic investigation by the state rapid-response unit to initiate a TAA petition for approval by the U.S. DOL. In this model, states would have a responsibility of including TAA screening and application support in their rapid response requirements, interviewing workers, unions, and employers, and filling out the required details for the petition. Federal rapid-response funding should be increased accordingly.
- Improving notification: States should be required to notify all workers potentially eligible for UI. To facilitate this, companies should be required to submit a list of employees and suppliers at certified facilities. State DOLs should use UI and business records to proactively reach out to all workers, and Congress should provide resources to state UI agencies to complete a data match and do proactive outreach to impacted workers.
- Further promotion of on-the-job training and apprenticeships: The Trump administration’s fiscal-year 2019 budget proposes to refocus TAA “on apprenticeship and on-the-job training [OJT], earn-as-you-learn strategies that ensure that participants are training for relevant occupations.”93 However, TAA already removed some of the policy barriers to OJT and apprenticeships in 2002 reforms, specifically allowing customized training for employers and removing a requirement that employers must retain OJT participants for six months after the training is over.94 However, those in OJT and apprenticeships lose access to TRA benefits because they are working—instead, workers could be incentivized to choose OJT or apprenticeships by allowing them to collect a partial TRA check.95 In addition, TAA could operate on a sliding scale up to 75 percent of the cost of OJT, as WIOA does (TAA currently pays 50 percent).96
- Prioritize sectoral partnerships: WIOA now requires states to develop sectoral partnerships to bring together businesses and the training/education community to develop training that is related to the current and future needs of sectors. TAA is now a mandatory partner of state WIOA planning, and the Department of Labor should closely monitor the synergy of TAA training and the increased use of sectoral partnerships in local labor market areas.
- Paths for workers not interested in retraining: In practice, workers enroll in TAA primarily if they are interested in training. In particular, WIOA and Wagner–Peyser staff should do a better job of enrolling anyone TAA-eligible among their clients for the purposes of receiving relocation assistance or wage insurance, if the client and program agree that such would be the best path forward. One approach would be to require an automated data match between TAA certification and UI, so that UI claimants attending reemployment services appointments (RESEAs) would be automatically notified about wage insurance.
- Buy into social security: Retraining and reemployment become more challenging for workers approaching retirement age. In addition to waiving retraining, TAA could be used to buy into social security benefits. TAA-certified workers could be allowed to collect social security early, such as at age fifty-eight. The funds from TAA (equivalent to 104 weeks of income support) could be added to the total lifetime actuarial value of social security benefits, meaning that this expansion would come at no cost to social security. For the TAA-eligible worker, they may receive a smaller social security than if they had retired at age 62. TAA would limit the reduction by replacing $36,600 of the lost actuarial value of social security.
- Permanent reauthorization: The parameters of TAA have frequently changed, with significant rule changes in 2002, 2009, 2011, 2014 and 2015. This has caused significant confusion for workers and their advocates concerning the benefits they are eligible for, and hase caused frequent backlogs at U.S. DOL. Worker advocates have held up petitions to wait for a more favorable policy environment. With globalization a feature of the U.S. economy, there’s a case for a permanent authorization of TAA, like unemployment insurance or a longer, ten-year authorization done for the Children’s Health Insurance program.
Expanding TAA to Include Technology: The Extra T in TAA
What follows is an outline of how TAA certification might be expanded to better reach workers threatened by technological unemployment, resulting in what could be called a Trade and Technology Adjustment Assistance (TTAA) program. This would be a single program in terms of benefits provided but with added qualification rules for technology on top of the current rules for trade. The idea would be to utilize the existing structure of the TAA program to respond to the challenges of job loss due to technology, with a new certification scheme developed to reach those workers impacted by technological job loss. Critical elements of TAA are well-suited to the challenge of technological unemployment. Special benefits are accrued to workers who suffer from job displacement for a specific reasons, in this case technology. An application, followed by an investigation, certifies eligibility for a group of workers in a certain occupation. Lastly, TAA has the mix of robust services needed for the potentially serious levels of technological unemployment, including extended unemployment benefits for workers who need retraining, wage insurance for those who take lower-paying jobs, protections of health insurance and pension coverage, relocation assistance, job counseling, and case management. Figure 6 provides a schematic for how the Trade Adjustment Assistance program could be adapted for technology. A natural way for this expansion to occur would be as a temporary expansion of eligibility during the next reauthorization (hopefully with a period of at least five years of implementation), with a process-related evaluation that would inform the contours of a permanent program.
Figure 6
| Expanding TAA for Technology (TTAA) | ||
| Certification of Occupations | Application | TTAA Services |
| U.S. Department of Commerce or an independent commission designates a list of occupations at risk of being automated, based on the skills defined by DOL’s O*NET definitions. | States apply on behalf of workers in an designed occupation that has declined beyond a designated level over the past year, or past two years.
Unions, locals, or representatives of workers could file with state sign off.
Application provides evidence of technology replacing employment in the occupation.
All workers in the state from approved occupations will be eligible for TAA. |
States/locals certify workers from eligible occupation and provide case management. Workers get:
+ Paid classroom or apprenticeship training
+ Readjustment allowances if out of work and in training
+ Wage insurance if reemployed at a lower wage
+ Case management
+ Relocation allowances |
Pre-Certification of Occupations
The group certification process of TAA has consistently raised concerns about its ability to be timely and responsive to job loss. A certification process that would offer a more streamlined experience for accessing TTAA benefits would significantly ameliorate, if not resolve, this issue.
The first part of the proposal takes advantage of the increasing convergence among researchers about the types of occupations that are at risk due to artificial intelligence, automation, and information technology. We don’t know which jobs will be replaced by technology, but we do know with some certainty about the kinds of jobs that could be replaced. This allows us to prepare for a more robust set of benefits for those workers whose jobs are made suddenly obsolete by technology. While predictions of the pace of change have moderated over the past year, rapid advances in technology (e.g. self-driving cars) could quickly lead to workers losing their jobs before Congress or individual states could mount a response. To address this major challenge, we propose pre-certifying a list of occupations that could see a quick increase in unemployment. This would allow for a rapid response of benefits and services to workers struggling to get back to work, frequently in occupations that are quite different than their prior employment.
To perform these pre-certifications, an independent commission would create a list of occupations at risk of being replaced by technology, based on an analysis of the current federal O*Net definition of the tasks within each of the federally defined occupations. The commission would establish a risk score for each occupation, based on its task distribution and limitations to technological adoption, such as the amount of creativity, interpersonal interaction, and finger dexterity required. Those meeting a minimum risk score would be deemed pre-certified for assistance through TAA due to technology. State rapid response agencies could use this data to carefully monitor employment levels in these occupations, as well as technological development that could impact employment. Owing to its dual function, this independent commission would be staffed by the National Institute for Standards and Technology (of the U.S. Department of Commerce) and the U.S. Department of Labor.
As emphasized in the research summarized above, technological capacities and the digital nature of occupations are constantly changing. To respond, the commission would update its criteria on an annual basis as technology changes, and apply those criteria to the most up-to-date O*Net definitions. It is anticipated that the risk profile of occupations will change from year to year. Like bank tellers, certain jobs may become more complementary to emerging technologies and be less at risk than currently anticipated. This will show up in the analysis of changing tasks within occupations.
Petitioning for Technology and Trade Adjustment Assistance
Learning from the experience of TAA, a process where entire occupations of workers could be certified as proposed eligible to receive benefits would be most effective. Such a process would dovetail well with the industry-wide certification for the existing TAA program discussed above. Unlike TAA certifications, which are filed at the factory level, TTAA petitions would be filed at the occupational level. Given the importance of state involvement and learning in the early years of the TTAA program, these TTAA petitions should be made for workers across a particular state. State agencies would thus be a likely initiator of a TTAA petition, as they are in a position to be aware of multiple announced layoffs and most readily prepared to deliver rapid response and dislocated-worker services. In other words, state DOLs would be empowered to petition for these enhanced adjustment services when workers in their state are being impacted. However, other eligible petitioners would include local governments,97 companies, unions, or other groups of workers.98 But these petitions, as well, if granted, would certify all workers in the impacted occupation in that state.
Each petition would need to include evidence of job loss within the occupation over the past three years and evidence of the introduction of new technologies within that economic sector during that three-year time period.99 Evidence for technology-related job loss would include one of the following:
- Examples of layoffs directly attributable to the introduction of a specific piece of technology into a workplace—for example, a company that lays off a long-haul truck driver because it has switched to a self-driving fleet. The application could include data on capital expenditures on technology, data on the penetration of technologies (such as International Federation of Robotics data on industrial robot usage), and secondary sources (such as interviews) about the technological nature of the employment changes.
- An increase in technology-related substitutes among new companies that diminishes employment in an existing occupation. For example, if large numbers of grocery-store clerks are laid off during the time period that use of online grocery delivery service increases, the clerks could be eligible for TTAA. The introduction of technology could be demonstrated by increasing sales among such technology-related substitutes in the year before the impacted layoffs.
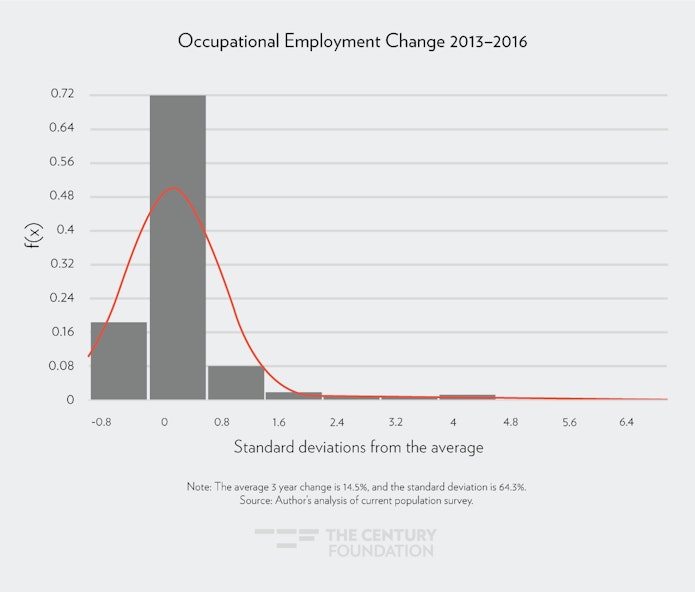
In addition, the program would need to set a minimum level of occupation decline, such as 8 percent over a three-year period. To put this in perspective, even over the three-year period of economic growth from 2013–2016, 10 percent of occupations decreased by 14 percent or more. A targeted program would thus need to require both a decrease in occupational size and the link to technology. Figure 7 displays a probability density function for three-year occupational job loss. While the average occupation increased by 14 percent over this period, 10 percent declined by 14 percent or more.
Figure 7
Services
This straightforward expansion would make the same mix of services available to both trade- or technology-certified workers. As stated above, TTAA workers would be eligible for up to two years of paid retraining with income support so they could pay their bills while they train for a new career. The current menu of standard options for TAA recipients outside of training would be available likewise for those on TTAA, including wage insurance and relocation allowances. In addition, TTAA recipients would have access to subsidized COBRA to continue their employer-based insurance.
Pilot Program
TTAA could be developed as a five-year pilot program in the next TAA reauthorization, with positive results leading to further expansion. In two scenarios, McKinsey predicts that the large increase in impacts of automation on job loss will occur either from 2025 to 2030 or from 2030 to 2035, depending on the pace of change.100 The purpose of a TTAA program would be to establish a workable model that can be scaled alongside demand. We can anticipate job losses even before 2025, especially among those applications that have more than 70 percent of their tasks replaceable by automation, with number potentially rapidly increasing after 2025.
Given this, a pilot program approach would be particularly viable now. In the appendix, details for a cost estimate are provided. It focuses on the 9 percent of jobs most at risk for automation and McKinsey’s estimate that technology adoption could reach 20 percent of tasks by 2025. The take-up rate is based on the percentage of workers who would exhaust unemployment benefits and be likely to apply for a program like TTAA rather than find a job on their own. That produces an estimate of 103,000 program participants from 2020 to 2025. The per-participant training cost in TAA is currently $11,986, and the per participants payment of TRA benefits is $8,555 per participant. Wage insurance would account for $25 million per year. This would require a Congressional commitment of $1.8 billion dollars over five years, including 5 percent of administrative costs.101 This allotment would allow for $10 million annually (5 percent) of funds to go to state and federal administration of the program, including the establishment of the annual list of occupations. The pilot program would allow multiple applications per state to the federal government until program funds are exhausted, based on an estimated cost per participant in each petitioned occupation.
Important Development Considerations
Finding the Political and Funding Nexus
Throughout the TAA program’s long history, its relationship with trade liberalization has been a crucial factor. As Congress acted to loosen regulations of international trade, there was bipartisan support for a program to support those who would lose more from the changing trade rules than they would gain. An expansion of TAA to technology-related employment does not have as easy a policy nexus, as public policy is not as clearly responsible for such job displacement. However, many forms of artificial intelligence and automation, like autonomous vehicles, may need Congressional or regulatory permission to expand. These may provide political opportunities for enacting a program like TTAA in exchange for government approval of the technology. Moreover, like TAA, many consumers will benefit from the lower prices, convenience, and efficiency brought forward by automation and artificial intelligence. A political argument can be made to balance out such broadly felt gains with targeted help for those Americans for whom employment loss is a consequence of that convenience.
TAA has been funded out of general revenue, a nod to the idea of taxing the broadly shared welfare gains promised (but not necessarily delivered) by trade agreements. Congress could fund a TAA program with general revenue under the same kind of logic. More specifically, a value-added tax (VAT) would get at the idea of taxing the purchase of cheaper technologically produced goods to fund TTAA and other valuable social programs, recognizing the twin roles of trade and technology in the declining cost of goods. For example, the percent of U.S. consumer spending on food has declined from 20 percent of income to 8 percent of income from 1960 to 2000.102 Finding a scalable funding source, like a VAT, may be needed in the decades to come, as there is a real possibility that millions of Americans might need retraining through a program like TTAA.
Over the years, several union leaders have proposed using import duties as a direct source of funding for improvements to TAA.103 A similar policy nexus and funding source could go towards the TTAA expansion. A “robot tax” has already been proposed as a possible way to pay for a universal basic income, and could be a way to pay for a program like TTAA.104 A more targeted example would be a vehicle-miles tax on self-driving cars, part of which could be directed to retraining programs.105 The nature of internet companies is that there are fewer winners, with each able to gain larger profits. For example, Instagram built an internet-age photo company worth a billion dollars with only a few hundred employees, while Kodak needed thousands of employees for photo production using twentieth-century technology.106 In this type of economy, a tax on these big winners may be the best way to foster shared prosperity, and technology leaders like Bill Gates have recognized as much.107
How to certify occupational loss?
A seemingly minor but important detail is how to base a program on a worker’s occupation rather than on industry. Unemployment insurance records typically track the workers’ industry, and not their occupation (although several states are experimenting with tracking the latter).108 Regular TAA defines eligible workers as being from a firm that is certified as trade-impacted, or from a secondary supplier. The TTAA program will need to create a new model. A questionnaire-based approach would first query a worker’s separating employer (as identified by the unemployment insurance system) to determine whether the worker meets the the standard occupational definition. Similar to how UI handles typical employer queries, if there is no response from the employer, the state agency would ask the separated employee directly.
Conclusion
The capacity of artificial intelligence, automation, and related technologies to replace labor is rapidly increasing. While the first set of studies forecast large society-wide losses of jobs, more recent research has centered on a smaller set of jobs where most of the tasks could be replaced by technology. Establishing a technology-related certification for TAA benefits would provide a powerful tool for either scenario. But it would be particularly powerful if increasing productivity in the economy creates new demand for workers who can be retrained into new careers. Just as the institution of a universal high school education and the expansion of higher education prepared America for the opportunities of the twentieth-century technology revolution, greater government investments in readjustment programs like the one outlined above can make a major difference in America.
Acknowledgements
The author would like to thank Amanda Novello for research assistance, and the following commenters: Annette Bernhardt, Mark Muro, Neil Ridley, Gerri Fiala, Kelly Ross, Brad Markell, Armando Viramontes, Jen Mishory, Jon Cardinal, Denise Forte, Conor McKay, Monica Rondon, and Roy Houseman.
Appendix
Table 1
| Workers Taking Up TTAA Benefits | ||
| Number | Source | |
| A. U.S. Employment | 154,000,000 | BLS109 |
| B. Job Loss Estimates | 9.0% | OECD110 |
| C. Technology Adoption 2020-2025 | 20.0% | McKinsey111 |
| D. 50 percent reskilled jobs | 50.0% | Author’s analysis of World Economic Forum112 |
| E. UI Take Up Rate (Job Losers) | 51.0% | Wayne Vroman, Monthly Labor Review113 |
| F. Exhaustion rate | 36.4% | U.S. DOL114 |
| G. TTAA take-up rate | 40.0% | 80 percent of UI take-up rate to account for ramp up time |
| Total five-year participants | 102,919 | A x B x C x D x E x F x G |
| Participants per year | 20,584 | |
Explanation: This estimate starts with the total number of workers employed in the United States as of January 2018. It then uses the OECD estimates of job loss in the United States based on those jobs at high risk of automation (9 percent), and uses McKinsey’s aggressive estimate that technological adoption will move fast enough to eliminate 20 percent of these jobs. Based on World Economic Forum research, it surmises that fifty percent of these workers can be reskilled into different job classifications and won’t suffer displacement. Among those displaced, take up proxies are used. First, an estimate is created of how many workers would exhaust UI, a good proxy for the percent who might be interested in this program and would not apply on their own. Finally, it’s assumed that a smaller share of these likely participants would participate in the five-year pilot than do in an established program like UI.
Table 2
| Five-Year Costs of TTAA Expansion | |||
| Per Participant115 | Participants per year | Cost | |
| Training | $11,986 | 15,500 | $185,783,000 |
| Trade Readjustment Assistance | $8,555 | 15,500 | $132,602,500 |
| Wage Insurance | $5,000 | 5,000 | $25,000,000 |
| Annual Total | $343,385,500 | ||
| Administrative Costs (5%) | $17,169,275 | ||
| 5 year total | $1,802,773,875 | ||
The cost estimates look at these anticipated 20,500 annual participants. We assume 15,500 will access training and TRA and 5,000 will opt for wage insurance. A 5-percent administrative cost is added for case management and similar supports, creating an annual cost of $343 million and $1.8 billion over five years.
Notes
- Carl Benedikt Frey and Michael A. Osborne, “The Future of Employment: How Susceptible Are Jobs To Computerisation?” Oxford Martin Programme on the Impacts of Future Technology, September 13, 2013, https://www.oxfordmartin.ox.ac.uk/downloads/academic/The_Future_of_Employment.pdf.
- Lawrence Mishel and John Bivens, “The Zombie Robot Argument Lurches On,” Economic Policy Institute, 2017, https://www.epi.org/publication/the-zombie-robot-argument-lurches-on-there-is-no-evidence-that-automation-leads-to-joblessness-or-inequality/.
Michael Shavel, Sebastian Vanderzell, and Emma Currier, “Retail Automation:Stranded Workers? Opportunities and Risk for Labor and Automation,” Global Thematic Research, 2017, https://irrcinstitute.org/wp-content/uploads/2017/05/FINAL-Retail-Automation_Stranded-Workers-Final-May-2017.pdf. - Algernon Austin, Cherrie Bucknor, Kevin Cashman, and Maya Rockeymoore, “Stick Shift: Autonomous Vehicles, Driving Jobs, and the Future of Work,” Center for Global Policy Solutions, 2017, http://globalpolicysolutions.org/report/stick-shift-autonomous-vehicles-driving-jobs-and-the-future-of-work/.
- Erik Brynjolfsson and Andrew McAfee, The Second Machine Age: Work, Progress, and Prosperity in a Time of Brilliant Technologies (New York: W. W. Norton & Company, 2016).
- The New Division of Labor: How Computers Are Changing the Way We Work (Princeton University Press and Russell Sage Foundation, 2004) (with Frank Levy),(2004).
- Brynjolffson and McAffee, ibid.
- Stanley Lebergott, “Labor Force and Employment 1800-1960,” Wesleyan University, 1966, http://www.nber.org/chapters/c1567.pdf.
- Lawrence Mishel and John Bivens, “The Zombie Robot Argument Lurches On,” Economic Policy Institute, 2017, https://www.epi.org/publication/the-zombie-robot-argument-lurches-on-there-is-no-evidence-that-automation-leads-to-joblessness-or-inequality/.
- David H. Autor, “Why Are There Still So Many Jobs? The History and Future of Workplace Automation,” Journal of Economic Perspectives, 2015, https://economics.mit.edu/files/11563.
- John M. Keynes, ‘Economic possibilities for our grandchildren’. Essays in persuasion, 1933 pp. 358–73. https://gutenberg.ca/ebooks/keynes-essaysinpersuasion/keynes-essaysinpersuasion-00-h.html#Economic_Possibilities.
- Sean Illing, “Why we need to plan for a future without jobs,” Vox, November 24, 2016, https://www.vox.com/conversations/2016/10/17/13245808/andy-stern-work-universal-basic-income-technology-artificial-intelligence-unions.
- Catherine Clifford, “Elon Musk: ‘Robots will be able to do everything better than us,’” CNBC, July 17, 2017, https://www.cnbc.com/2017/07/17/elon-musk-robots-will-be-able-to-do-everything-better-than-us.html.
- “The Future of Jobs: Employment, Skills and Workforce Strategy for the Fourth Industrial Revolution,” World Economic Forum, Global Challenge Insight Report, January, 2016, http://www3.weforum.org/docs/WEF_Future_of_Jobs.pdf.
- David H. Autor, “Why Are There Still So Many Jobs? The History and Future of Workplace Automation,” journal entry, Journal of Economic Perspectives, 2015, https://economics.mit.edu/files/11563.
- Georg Graetz and Guy Michaels, “Robots at Work,” Centre for Economic Performance, London School of Economics, Mark, 2015, http://cep.lse.ac.uk/pubs/download/dp1335.pdf.
- Daron Acemoglu and Pascual Restrepo, “Robots and Jobs: Evidence From U.S. Labor Markets,” Boston University, 2017, https://economics.mit.edu/files/12763.
- Lawrence Mishel and Josh Bivens, “The Zombie Robot Argument Lurches On,” Economic Policy Institute, May 24, 2017, http://www.epi.org/publication/the-zombie-robot-argument-lurches-on-there-is-no-evidence-that-automation-leads-to-joblessness-or-inequality/.
- Stephen Ezell and Robert Atkinson, “The Case for a National Manufacturing Strategy,” The Information Technology and Innovation Foundation, April, 2011, http://www2.itif.org/2011-national-manufacturing-strategy.pdf.
- False Alarmism: Technological Disruption and the U.S. Labor Market, 1850–2015.
- Lawrence Katz and Robert A Margo, “Technical Change and the Relative Demand for Skilled Labor: The United States in Historical Perspective,” National Bureau of Economic Research, 2014, http://www.nber.org/chapters/c12888.
- David Autor and Brendan Price, “The Changing Task Composition of the US Labor Market,” Massachusetts Institute of Technology, 2003, https://economics.mit.edu/files/11600.
- Lawrence Katz and Robert A. Margo, “Technical Change and the Relative Demand for Skilled Labor: The United States in Historical Perspective,” National Bureau of Economic Research, 2014, http://www.nber.org/chapters/c12888.
- “O-Net Online,” National Center for O*’Net OnLine, https://www.onetonline.org.
- “O-Net Resource Center,” National Center for O*’Net OnLine, https://www.onetcenter.org/overview.html.
- David Autor and Brendan Price, “The Changing Task Composition of the US Labor Market,” Massachusetts Institute of Technology, 2013, https://economics.mit.edu/files/11600.
- Carl Benedikt Frey and Michael A. Osborne, “The Future of Employment: How Susceptible Are Jobs To Computerisation?” Oxford Martin Programme on the Impact on Future Technology, 2013, https://www.oxfordmartin.ox.ac.uk/downloads/academic/The_Future_of_Employment.pdf.
- “A Future That Works: Automation, Employment, and Productivity,”, Mckinsey Global Institute, Mckinsey and Company, 2017, p. 70, https://www.mckinsey.com/~/media/McKinsey/Global%20Themes/Digital%20Disruption/Harnessing%20automation%20for%20a%20future%20that%20works/MGI-A-future-that-works_Full-report.ashx.
- “Testimony of Annette Bernhardt,” California Little Hoover Commission, January 25, 2018, http://www.lhc.ca.gov/report/artificial-intelligence-applications-and-implications#schedule.
- David Weil, The Fissured Workplace: Why Work Became So Bad for So Many and What Can Be Done to Improve It (Cambridge, MA: Harvard University Press, 2017), http://www.hup.harvard.edu/catalog.php?isbn=9780674975446&content=reviews.
- Matt A.V. Chaban, “Work To Do: How Automation Will Transform Jobs in NYC,” Center for an Urban Future, 2018, https://nycfuture.org/research/how-automation-will-transform-jobs-in-nyc.
- Ljubica Nedelkoska and Glenda Quintini, “Automation Skills Use and Training,” Directorate for Employment, Labour and Social Affairs, Organization for Economic Co-operation and Development, Employment and Migration Working Papers No. 202, 2018, https://read.oecd-ilibrary.org/employment/automation-skills-use-and-training_2e2f4eea-en#page8.
- Melanie Arntz, Terry Gregory and Ulrich Zierahn,”The Risk Of Automation For Jobs In Oecd Countries:a Comparative Analysis,” OECD Social, Employment And Migration Working Papers No. 189, 2016 http://www.ifuturo.org/sites/default/files/docs/automation.pdf.
- “The Future of Jobs: Employment, Skills and Workforce Strategy for the Fourth Industrial Revolution,” Global Challenge Insight Report, World Economic Forum, 2016, http://www3.weforum.org/docs/WEF_Future_of_Jobs.pdf.
- “Towards a Reskilling Revolution: A Future of Jobs for All,” World Economic Forum, Boston Consulting Forum, 2018, http://www3.weforum.org/docs/WEF_FOW_Reskilling_Revolution.pdf?utm_source=newsletter&utm_medium=email&utm_campaign=&stream=top-stories.
- Anthony Fiano, “Digitalization and the American Workforce,” Brookings Institution, 2017, https://www.brookings.edu/research/digitalization-and-the-american-workforce/.
- Karren Harris, Austin Kimson, and Andrew Schwedel, “Labor 2030: The Collision of Demographics, Automation and Inequality,” Bain and Company, 2018, http://www.bain.com/publications/articles/labor-2030-the-collision-of-demographics-automation-and-inequality.aspx?mc_cid=cea0b760ba&mc_eid=ceb0b04944.
- Lawrence Mishel and, John Bivens, “The Zombie Robot Argument Lurches On,” Economic Policy Institute, 2017, https://www.epi.org/publication/the-zombie-robot-argument-lurches-on-there-is-no-evidence-that-automation-leads-to-joblessness-or-inequality/.
- “Worker Displacement 2013-2015,” Bureau of Labor Statistics, August 25, 2016 https://www.bls.gov/news.release/disp.nr0.htm.
- Karen Needels, Walter Nicholson, Joanne Lee, and Heinrich Hock, “Exhaustees of Extended Unemployment Benefits Programs: Coping with the Aftermath of the Great Recession,” June 16, 2016, https://www.mathematica-mpr.com/our-publications-and-findings/publications/exhaustees-of-extended-unemployment-benefits-programs-coping-with-the-aftermath-of-the-great.
- Karen Needels, Walter Nicholson, Joanne Lee, and Heinrich Hock, “Exhaustees of Extended Unemployment Benefits Programs: Coping with the Aftermath of the Great Recession,” June 16, 2016, https://www.mathematica-mpr.com/our-publications-and-findings/publications/exhaustees-of-extended-unemployment-benefits-programs-coping-with-the-aftermath-of-the-great.
- Karen Needels, Walter Nicholson, Joanne Lee, and Heinrich Hock, “Exhaustees of Extended Unemployment Benefits Programs: Coping with the Aftermath of the Great Recession,” June 16, 2016, https://www.mathematica-mpr.com/our-publications-and-findings/publications/exhaustees-of-extended-unemployment-benefits-programs-coping-with-the-aftermath-of-the-great.
- Steven Davis and Till von Wachter, “Recessions and the Costs of Job Loss,” Brookings Institution, Brookings Paper on Economic Activity No. 2, 2011, https://www.brookings.edu/wp-content/uploads/2011/09/2011b_bpea_davis.pdf.
- Steven Davis and Till von Wachter, “Recessions and the Costs of Job Loss,” Brookings Institution, Brookings Paper on Economic Activity No. 2, 2011, https://www.brookings.edu/wp-content/uploads/2011/09/2011b_bpea_davis.pdf.
- Marilyn Geewax, “The Impacts Of Long-Term Unemployment,” National Public Radio,
December 12, 2011, https://www.npr.org/2011/12/09/143438731/the-impacts-of-long-term-unemployment. - Daniel Sullivan and Til von Wachter, “Job Displacement and Mortality: An Analysis Using Administrative Data,” Quarterly Journal of Economics, Volume 124, Issue 3, August 1, 2009, p. 1265–1306, https://academic.oup.com/qje/article-abstract/124/3/1265/1905153?redirectedFrom=fulltext.
- Allison Milner, Andrew Page, and Anthony LaMontagne, “Long-Term Unemployment and Suicide: A Systematic Review and Meta-Analysis,” PLoS One 8(1), January 16, 2013, https://doi.org/10.1371/journal.pone.0051333.
- Allison Milner, Andrew Page, and Anthony LaMontagne, “Long-Term Unemployment and Suicide: A Systematic Review and Meta-Analysis,” PLoS One 8(1), January 16, 2013, https://doi.org/10.1371/journal.pone.0051333.
- Maria Heidkamp, “Older Workers, Rising Skill Requirements, and the Need for a Re-envisioning of the Public Workforce System,” Council for Adult and Experiential Learning, 2012, http://cdn2.hubspot.net/hubfs/617695/premium_content_resources/adult_learning/pdfs/TMT_Reenvision_Public_Workforce_System.pdf.
- Richard Johnson and Corina Mommaerts, “Age Differences in Job Loss, Job Search, and Reemployment,” Urban Institute, Retirement Policy Discussion Paper Series, January, 2011, https://www.urban.org/sites/default/files/publication/27086/412284-Age-Differences-in-Job-Loss-Job-Search-and-Reemployment.PDF.
- “Staying Ahead of the Curve 2013: AARP Multicultural Work and Career Study, Perceptions of Age Discrimination in the Workplace-Age 45-74,” American Association of Retired Persons, April, 2014, https://www.aarp.org/content/dam/aarp/research/surveys_statistics/econ/2013/Staying-Ahead-of-the-Curve-Age-Discrimination.pdf; and Kimberly Palmer, “10 Things You Should Know About Age Discrimination,” American Association for Retired Persons, 2018, https://www.aarp.org/work/on-the-job/info-2017/age-discrimination-facts.html.
- Steven David, Til von Wachter, Robert Hall, and Richard Rogerson, “Recessions and the Costs of Job Loss [with Comments and Discussion],” Brookings Institution, Brookings Papers on Economic Activity, 2011, p. 1–72, http://www.jstor.org/stable/41473597.
- Autor, David H., David Dorn, and Gordon H. Hanson. “The China Syndrome: Local Labor Market Effects of Import Competition in the United States.” The American Economic Review 103, no. 6 (2013): 2121-168. http://www.jstor.org/stable/42920646.
- “The Long-Term Decline in Prime-Age Male Labor Force Participation,” 2016, Executive Office of the President of The United States, 2016, https://obamawhitehouse.archives.gov/sites/default/files/page/files/20160620_cea_primeage_male_lfp.pdf.
- Robert Lalonde and Daniel Sullivan, “Retraining Displaced Workers,” The Hamilton Project, December 2010 http://www.hamiltonproject.org/assets/legacy/files/downloads_and_links/10_displaced_workers_lalonde.pdf.
- Mangum, Garth, Stephen Mangum, Andrew Sum, James Callahan, and Heal Fogg, “A Second Chance for the Fourth Chance: a Critique of the Workforce Investment Act,” Sar Levitan Center for Social Policy Studies, Johns Hopkins University Institute for Policy Studies, 1999.
- Lou Jacobson, “Evaluation of Labor Exchange Services in a One-Stop Delivery System
Environment,”U.S. Department of Labor Employment and Training Administration Occasional Paper 2004-09 https://wdr.doleta.gov/research/FullText_Documents/Evaluation%20of%20Labor%20Exchange%20in%20One-Stop%20Delivery%20System%20-%20Final%20Report.pdf. - A similar early warning strategy has been applied to industrial layoffs. See for example, Steel Valley Authority, ”The Layoff Aversion Guidebook,” http://www.nelp.org/content/uploads/2015/03/LayoffAversionSummary1.pdf, accessed April 18, 2018.
- Ljubica Nedelkoska and Glenda Quintini, “Automation Skills Use and Training,” Directorate for Employment, Labour and Social Affairs, Organization for Economic Co-operation and Development, Employment and Migration Working Papers No. 202, 2018, https://read.oecd-ilibrary.org/employment/automation-skills-use-and-training_2e2f4eea-en#page8.
- Mark Muro and Joseph Parilla, “Maladjusted: It’s Time to Reimagine Economic ‘Adjustment’ Programs,” report, Brookings Institution, 2017, https://www.brookings.edu/blog/the-avenue/2017/01/10/maladjusted-its-time-to-reimagine-economic-adjustment-programs/.
- Before being renamed 2016, WIOA was known as the Workforce Investment Act (WIA). All references in this report to the act, past and present, will use “WIOA.”
- “FY 2014 Congressional Budget Justification Employment and Training Administration,” Universal Displaced Workers Program, Department of Labor, https://www.dol.gov/dol/budget/2014/PDF/CBJ-2014-V1-05.pdf. In FY 2013, $1.25 billion was spent on WIOA dislocated-worker benefits and $550 million on trade adjustment assistance. “Fiscal Year 2014 Budget of the U.S. Government: Appendix,” Executive Office of the President of the United States, 2014, https://www.gpo.gov/fdsys/pkg/BUDGET-2014-APP/pdf/BUDGET-2014-APP.pdf.
- Robert Pollin and Brian Callaci, “The Economics of Just Transition: A Framework for Supporting Fossil Fuel- Dependent Workers and Communities in the United States,” Political Economy Research Institute, University of Massachusetts, 2016, https://www.peri.umass.edu/publication/item/762-the-economics-of-just-transition-a-framework-for-supporting-fossil-fuel-dependent-workers-and-communities-in-the-united-states.
- “Just Transition,” Just Transition Centre, May, 2017, https://www.oecd.org/environment/cc/g20-climate/collapsecontents/Just-Transition-Centre-report-just-transition.pdf.
- Oscar Gonzales, “Economic Development Assistance for Communities Affected by Employment Changes Due to Military Base Closures (BRAC),” June 2009 https://fas.org/sgp/crs/misc/RL34709.pdf.
- Rob Atkinson, “How to Reform Worker-Training and Adjustment Policies for an Era of Technological Change,” Information Technology and Innovation Foundation, February 20, 2018 https://itif.org/publications/2018/02/20/technological-innovation-employment-and-workforce-adjustment-policies.
- “Trade Adjustment Assistance for Workers and TAA Reauthorization Act of 2015,” Congressional Research Service, United States Congress, https://fas.org/sgp/crs/misc/R44153.pdf.
- “Trade Adjustment Assistance for Workers and TAA Reauthorization Act of 2015,” Congressional Research Service, United States Congress, https://fas.org/sgp/crs/misc/R44153.pdf.
- “TAA Program Benefits and Services Under the 2015 Amendments,” Employment and Training Administration, United States Department of Labor, 2015, https://www.doleta.gov/tradeact/2015_amend_benfits.cfm. The 2011 extension of TAA limited the reason for a training waiver to the inability to be in training because of health or a lack of available training to enroll.
- Sheena McConnell, “Individual Training Accounts: Testing Models of Paying Training 1999-2011,” report prepared for the U.S. Department of Labor, Employment, and Training Administration, Mathematica Policy Research, https://www.mathematica-mpr.com/our-publications-and-findings/projects/individual-training-accounts.
- “Health Coverage Tax Credit,” Internal Revenue Service, 2018, https://www.irs.gov/credits-deductions/individuals/hctc.
- “TAA Program Benefits and Services Under the 2015 Amendments,” Employment and Training Administration, United States Department of Labor, 2015, https://www.doleta.gov/tradeact/2015_amend_benfits.cfm.
- “Trade Adjustment Assistance For Workers Programs,” Employment and Training Administration, United States Department of Labor, 2015, https://www.doleta.gov/tradeact/docs/AnnualReport16.pdf.
- Mangum, Garth, Stephen Mangum, Andrew Sum, James Callahan, and Heal Fogg, “A Second Chance for the Fourth Chance: a Critique of the Workforce Investment Act,” Sar Levitan Center for Social Policy Studies, Johns Hopkins University Institute for Policy Studies, 1999.
- “Employment status of the civilian population 25 years and over by educational attainment,” Bureau of Labor Statistics, July 8, 2015, https://www.bls.gov/webapps/legacy/cpsatab4.htm.
- “Episode 750: Retraining Day,” Planet Money, National Public Radio, January 27, 2017 https://www.npr.org/sections/money/2017/01/27/512060753/episode-750-retraining-day.
- “Trade Adjustment Assistance: Let the Ineffective and Wasteful Job-Training Program Expire,” The Heritage Foundation, 2014, https://www.heritage.org/trade/report/trade-adjustment-assistance-let-the-ineffective-and-wasteful-job-training-program.
- David Autor, David Dorn, and Gordon H. Hanson. “The China Syndrome: Local Labor Market Effects of Import Competition in the United States” American Economic Review 103, no. 6, 2013, p. 2121-168, http://www.jstor.org/stable/42920646.
- “2015 National TAA Program Statistics,” Employment and Training Administration, United States Department of Labor, 2015, https://www.doleta.gov/tradeact/TAPR_2015.cfm?state=US.
- “Program Year 2015 WIA Annual Report,” Summary of National Results, Employment and Training Administration, United States Department of Labor 2015, https://www.doleta.gov/performance/results/.
- Ron D’Amico and Peter Schochet, “The Evaluation of the Trade Adjustment Assistance Program: A Synthesis of Major Findings,” Mathematica Policy Research and Solicy Policy Research Associates,December, 2012, https://www.mathematica-mpr.com/our-publications-and-findings/publications/the-evaluation-of-the-trade-adjustment-assistance-program-a-synthesis-of-major-findings.
- Ron D’Amico and Peter Schochet, “The Evaluation of the Trade Adjustment Assistance Program: A Synthesis of Major Findings,” Mathematica Policy Research and Solicy Policy Research Associates, December, 2012, https://www.mathematica-mpr.com/our-publications-and-findings/publications/the-evaluation-of-the-trade-adjustment-assistance-program-a-synthesis-of-major-findings.
- Ron D’Amico and Peter Schochet, “The Evaluation of the Trade Adjustment Assistance Program: A Synthesis of Major Findings,” Mathematica Policy Research and Solicy Policy Research Associates, December, 2012, https://www.mathematica-mpr.com/our-publications-and-findings/publications/the-evaluation-of-the-trade-adjustment-assistance-program-a-synthesis-of-major-findings.
- Amy Goldstein, Janesville An American Story (New York: Simon and Schuster, 2017).
- Henry S. Farber, “Job Loss in the Great Recession and Its Aftermath: U.S. Evidence From the Displaced Workers Survey,” National Bureau of Economic Research, Working Paper No. 21216, May, 2015, http://www.nber.org/papers/w21216.
- Peter Z. Schochet, Ronald D’Amico, Jillian Berk, and Nathan Wozny, “Methodological Notes Regarding the Impact Analysis,” Mathematica Policy Research, August 30, 2012, https://www.mathematica-mpr.com/our-publications-and-findings/publications/methodological-notes-regarding-the-impact-analysis.
- Ronald D’Amico and Peter Z. Schochet, “The Evaluation of the Trade Adjustment Assistance Program: A Synthesis of Major Findings,” Mathematica Policy Research, December 30, 2012, https://www.mathematica-mpr.com/our-publications-and-findings/publications/the-evaluation-of-the-trade-adjustment-assistance-program-a-synthesis-of-major-findings.
- Ramya M. Vijaya, “Broken Buffer: How Trade Adjustment Assistance Fails American Workers,” Demos, 2010, http://www.demos.org/sites/default/files/publications/Broken_Buffer_FINAL.pdf.
- “Trade Adjustment Assistance: New Ideas for an Old Program,” Technology Innovation and U.S. Trade Advisory Panel, 1987, http://ota.fas.org/reports/8730.pdf.
- “Trade Adjustment Assistance: New Ideas for an Old Program,” Technology Innovation and U.S. Trade Advisory Panel, 1987, http://ota.fas.org/reports/8730.pdf.
- “Flexicurity,” Denmark.DK, the official website of Denmark, http://denmark.dk/en/society/welfare/flexicurity, accessed on April 17, 2018.
- Andrew Stettner, “Wage Insurance is not a Silver Bullet to the Problem of Job Loss,” The Century Foundation, January 20, 2016, https://tcf.org/content/commentary/wage-insurance-for-job-loss-not-a-silver-bullet/.
- “Industry Certification Would Likely Make More Workers Eligible, but Design and Implementation Challenges Exist,” , Reports to Congressional Requesters, United States Government Accountability Office, 2007, https://www.gao.gov/assets/270/263136.pdf.
- “An American Budget 2019,” Budget of the United States Government, Office of Management and Budget, 2018, p. 77, https://www.govinfo.gov/content/pkg/BUDGET-2019-BUD/pdf/BUDGET-2019-BUD.pdf.
- Kate Dunham, “Linkages Between TAA, One-Stop Career Center Partner, and Economic Development Agencies,” SPR Project No. 1147, Social Policy Research Associates, The United States Department of Labor Employment and Training Administration, Office of Policy Development Evaluation and Research, p. 7, 2009, https://wdr.doleta.gov/research/FullText_Documents/Linkages%20Between%20TAA%20One-Stop%20Career%20Center%20Partners%20and%20Economic%20Development%20Agencies%20-%20Final%20Report.pdf.
- Kate Dunham, “Linkages Between TAA, One-Stop Career Center Partner, and Economic Development Agencies,” SPR Project No. 1147, P. 7, Social Policy Research Associates, The United States Department of Labor Employment and Training Administration, Office of Policy Development Evaluation and Research, p. 7, 2009, https://wdr.doleta.gov/research/FullText_Documents/Linkages%20Between%20TAA%20One-Stop%20Career%20Center%20Partners%20and%20Economic%20Development%20Agencies%20-%20Final%20Report.pdf.
- “Employment and Training Administration Advisory System,” No. 3-15, United States Department of Labor, 2015, https://wdr.doleta.gov/directives/attach/TEGL/TEGL_03-15.pdf.
- Petitioning could be limited to state workforce areas as designated by the WIOA, with a required state sign-off.
- TAA allows up to as few as three workers to apply for eligibility. Eligible entities for a TTAA petition could be a professional society, a worker center, or a similar organization, and the law would establish a minimum requirement of membership for these non-union organizations.
- These would be detailed occupations as defined by O*Net and data from the bureau of Labor Statistics.
- “A Future That Works: Automation, Employment, and Productivity,” Mckinsey and Company, Mckinsey Global Institute, 2017, p. 70, https://www.mckinsey.com/~/media/McKinsey/Global%20Themes/Digital%20Disruption/Harnessing%20automation%20for%20a%20future%20that%20works/MGI-A-future-that-works_Full-report.ashx.
- “Trade Adjustment Assistance: New Ideas for an Old Program,” Technology Innovation and U.S. Trade Advisory Panel, 1987, http://ota.fas.org/reports/8730.pdf.
- J. Bradford DeLong, “NAFTA and other trade deals have not gutted American manufacturing — period,” Vox, January 24, 2017 https://www.vox.com/the-big-idea/2017/1/24/14363148/trade-deals-nafta-wto-china-job-loss-trump.
- Rick McHugh, “Hearing on Trade Adjustment Assistance,” Testimony before the Committee on Finance, Subcommittee on International Trade, September 17, 1985, https://www.finance.senate.gov/imo/media/doc/HRG99-364.pdf.
- Kevin Delaney, “The robot that takes your job should pay taxes, says Bill Gates,” Quartz, February 17, 2017, https://qz.com/911968/bill-gates-the-robot-that-takes-your-job-should-pay-taxes/.
- Keith Laing, “Cash- Strapped States Eye Self-Driving Car Taxes,” article, The Detroit News, August 21, 2017, http://www.detroitnews.com/story/business/autos/mobility/2017/08/21/self-driving-car-taxes-states/104802708/.
- Bjornson, MIT.
- Kevin Delaney, “The Robot That Takes Your Job, Should Pay Taxes, Says Bill Gates,” Quartz, February 17, 2017, https://qz.com/911968/bill-gates-the-robot-that-takes-your-job-should-pay-taxes/.
- Author’s interview with Gerri Fiala, March 6, 2018.
- Bureau of Labor Statistics, “Table A-1: Employed”, Employment Situation January 2018, https://www.bls.gov/news.release/archives/empsit_02022018.htm.
- Melanie Arntz, Terry Gregory and Ulrich Zierahn,”The Risk Of Automation For Jobs In Oecd Countries:a Comparative Analysis,” OECD Social, Employment And Migration Working Papers No. 189, 2016, http://www.ifuturo.org/sites/default/files/docs/automation.pdf.
- “A Future That Works: Automation, Employment, and Productivity,”, Mckinsey Global Institute, Mckinsey and Company, 2017, p. 13, https://www.mckinsey.com/~/media/McKinsey/Global%20Themes/Digital%20Disruption/Harnessing%20automation%20for%20a%20future%20that%20works/MGI-A-future-that-works_Full-report.ashx.
- “Towards a Reskilling Revolution: A Future of Jobs for All,” World Economic Forum, Boston Consulting Forum, 2018, http://www3.weforum.org/docs/WEF_FOW_Reskilling_Revolution.pdf?utm_source=newsletter&utm_medium=email&utm_campaign=&stream=top-stories.
- Wayne Vroman, “Unemployment insurance recipients and nonrecipients in the CPS,” Monthly Labor Review, October 2009.
- U.S. Department of Labor, “UI Quarterly Data Summary,” 4th Quarter 2017 https://workforcesecurity.doleta.gov/unemploy/content/data_stats/datasum17/DataSum_2017_4.pdf.
- “Trade Adjustment Assistance for Workers Program, Fiscal Year 2016,” U.S. Department of Labor, accessed April 18, 2018, https://www.doleta.gov/tradeact/docs/AnnualReport16.pdf.


