
With frequent media reports about highly paid presidents and expensive college sports programs,1 observers have good reason to wonder: Are these colleges putting sufficient resources into educating students? Tools already exist for prospective college students and their families to estimate the total costs of attending a school, or how much financial aid they can expect to receive, and even some information about what they might expect to earn after graduation. But what about the education itself? Can a student find out what their tuition dollars actually buy?
To examine that question, The Century Foundation (TCF) has sought to open up the black box of college spending to see which institutions are providing their enrollees a better value. As part of this initiative, TCF has enlisted the aid of an expert on college finances, John Cheslock, an education professor and senior research associate at the Center for the Study of Higher Education at Penn State. Specifically, Cheslock has examined data submitted to the U.S. Department of Education by 5,493 colleges of all types—community colleges, research universities, for-profit trade schools, small liberal arts colleges, and the rest—looking for the best indicator of a high-value program. His work (available here) explains the advantages and disadvantages of the various measures, and suggests different calculations that could be useful, depending on the question being asked.
Attempting to assess the value of a college education by looking at each school’s spending habits can produce inaccuracy, if one is not careful. Cheslock warns, for example, that combining multiple categories of a college’s expenditures to yield an overall measure of spending on “education” can be misleading, due to categories that are not defined well enough to be sure that extraneous items such as marketing or executive salaries are not included. But one category of spending that is clearly educational, and definitely important for student success, is the money that a college spends on instruction: paying the teachers who interact with the students.
This report examines the results of Cheslock’s study and explores their implications for students and for policymakers alike. It begins with a look at just which types of colleges are most likely to spend a high portion of their tuition revenues directly on instruction. It then discusses how other expenditures may matter for student success, such as spending on support services, but that this can be problematic to use as a measure of educational value. The report then focuses on the spending patterns of the for-profit and online education sector in particular, where large expenditures on advertising and marketing are paired with low levels of instructional spending. The report concludes with some lessons and recommendations for policymakers on how best to use and improve on this type of data reporting, to make higher education more transparent and more valuable to students and taxpayers alike.
Public colleges and universities are, overall, the best value from a teaching-per-tuition-dollar perspective.
The Schools that Spend the Most on Instruction
Instructional expenditures are a useful first-blush indicator of how much of the tuition paid by a student—or paid on their behalf by a parent, lender, or scholarship provider—is going to education. This spending category captures a college’s investment in the formal instruction program: the faculty and other resources required for offering coursework. While other activities that colleges spend money on are important for student success—think career counseling, student activities, and cultural programming—instructional spending points clearly to an institution’s intention to provide an education. Looking at the instructional spending amounts and ratios at the largest colleges reveals some patterns (see Figure 1).
- Schools that answer to owners and investors—for-profit institutions—as a group, spend the least on instruction, generally less than half of the tuition revenue they receive from students.
- Public colleges and universities are, overall, the best value from a teaching-per-tuition-dollar perspective. Their support from state and local taxpayers frequently allows public institutions to spend more on instruction—sometimes much more—than they received in tuition revenue.
- Instructional spending by nonprofit colleges varies enormously, with many spending more than $20,000 per student on instruction—even when they charge some students less than that in tuition—because of access to donated funds and other revenue. At the same time, many more-tuition-dependent institutions spend less in absolute dollars than some public institutions, and less as a proportion of tuition revenue.
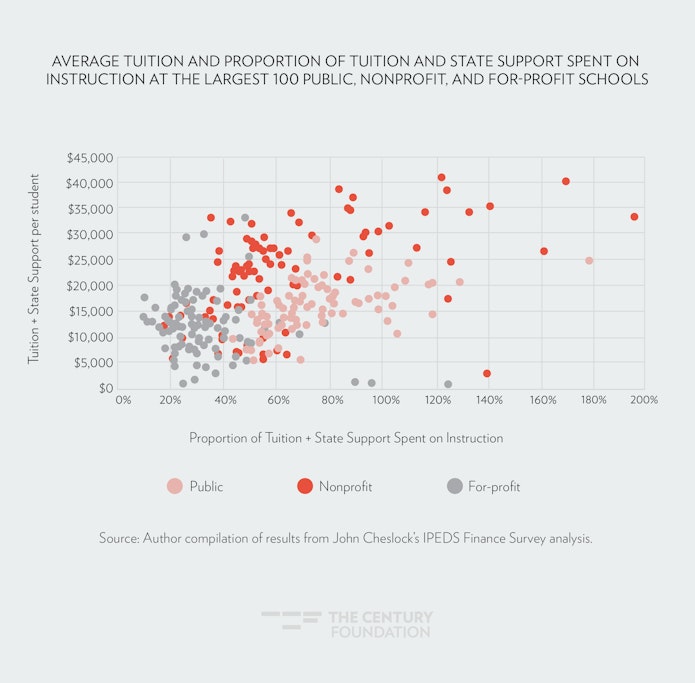
While a prospective student seeking the best value may be interested in what portion of his or her tuition bill is spent on instruction, a policymaker or taxpayer may want to understand what happens after state operating subsidies are included in that amount. As Figure 2 shows, even after accounting for that support, the vast majority of public colleges still spend more than half of their combined tuition and taxpayer support on instruction. This high-value spending pattern occurs at institutions enrolling nine out of every ten public college students.
Figure 1
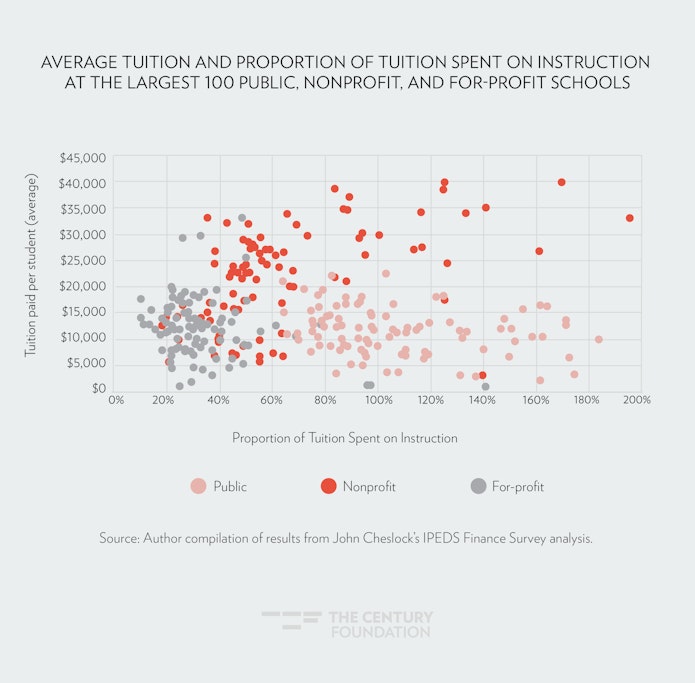
Figure 2
Not All College Spending Improves Student Success
Two categories of expenditures are the most important in promoting student success in college: spending on instruction, and spending on academic support.2 These research findings hold true across a range of types of institutions, and the link is the strongest at open-access and other less-selective colleges. In addition to contributing to lower dropout rates, spending in these categories is also associated with higher post-graduation earnings and lower student loan defaults.3 It makes sense: more faculty allows for smaller class sizes and more attention to individual students’ needs, as well as more course offerings that prevent students from languishing on waitlists.
Instructional spending at its base involves employing more faculty or reducing teaching loads and class sizes. It follows that high faculty–student ratios are linked to higher graduation rates and higher-paying jobs after college.4 The well-coordinated use of resources for instruction and student support can improve graduation and transfer rates, and even lower the overall cost of each degree conferred by a college.5
So if academic and other student supports can be as important as instruction as a college expenditure, why not include them in TCF’s recommended tuition-dollar measure? The reason is that, while the amount schools spend on instruction is pretty clearly an investment in students’ education, the same cannot be said for the other spending that colleges report in the same categories. Even though expenditures on academic and other support services are critical to student success—tutoring and financial aid advising, health care and mental health care services, the information technology infrastructure for communicating with students, career services and other outreach to employers and the community, and much of the administrative systems for managing the whole enterprise—there are costs that colleges report in these categories that do not help students succeed at all. And because current data sources are severely limited, they do not allow for these elements to be analyzed separately.
In particular, the figures reported to the Department of Education as being for student support services can include amounts—sometimes very large amounts—dedicated not to education, but to marketing and recruiting. And those amounts have been growing, particularly among the for-profit higher education sector.
If you watch television at home on any given night, you may see commercials selling you confidence through a Strayer University degree, empowering yourself with Southern New Hampshire University’s flexible options, or, if you’re a single mom, convincing you that an IT degree from the University of Phoenix will save your career.6 Advertising by colleges reportedly reached an all-time high in 2016, at $1.65 billion, an increase of 18.5 percent that occurred despite declines in the for-profit sector.7
Online ads are the largest single component of college advertising expenses. Between August 2016 and January 2017 alone, the University of Phoenix spent $27 million just to get clicks when people search for colleges in online searches.8 The list of top online search advertisers is dominated by for-profit colleges, but includes some of the major online nonprofit and public institutions.
Table 1
| Top Ten Education Advertisers Online, and Their Instructional Spending | ||||
| Institution | Amount spent August 2016–January 2017 | Average clickthrough rate | Average cost per click | Percent of tuition spent on instruction |
| University of Phoenix | $27,000,00 | 5.7% | $14.98 | 21% |
| Capella University | $13,800,000 | 5.5% | $11.72 | 10% |
| DeVry University | $13,500,000 | 4.7% | $13.98 | 24% |
| Southern New Hampshire University | $11,700,000 | 5.7% | $22.07 | 18% |
| Ashford University | $11,000,000 | 4.6% | $21.57 | 19% |
| Walden University | $8,100,000 | 5.2% | $13.08 | 31% |
| Purdue University Global | $8,100,000 | 4.2% | $16.47 | 18% |
| American Public University System | $4,700,000 | 4.2% | $16.40 | 27% |
| South University | $4,200,000 | 5.0% | $14.87 | 28% |
| Liberty University | $4,100,000 | 4.2% | $16.53 | 24% |
| Source: Online advertising data from Kantar Media; John Cheslock’s analysis of IPEDS Finance Survey data. | ||||
These online ads are only the tip of the iceberg, it seems. After a prospect clicks on an ad, the college incurs additional marketing expenses; some colleges employ hundreds of recruiters who contact prospective students as quickly as possible after a click, with the goal of converting them to “starts.”9 While college admissions staff at nonprofit and public colleges see their role as providing students with information for them to compare their options and choose the college that best fits their interests and needs, the recruitment approach at growth-focused schools is frequently very different. There, the admissions representatives are really more like salespeople, attempting to usher a prospect along from their web site click to enrolling, usually with federal grants and loans that eliminate the need to discuss the tuition price and how it might compare to other options.10 An investigation last year by ProPublica revealed an aggressive approach to student recruitment at Liberty University, which even has a subset of recruiters dedicated to enrolling prospective students who are members of the military—a subgroup of students with access to a rich pipeline of federal funds for education assistance.11 Diane Auer Jones, U.S. deputy undersecretary of education, said in January that “the biggest consumer protection issue” in higher education is marketing and advertising: “these aggressive marketing techniques are a problem, and we need to investigate them.”12
Both instructional expenses and student supports are important. But the inclusion of advertising and marketing expenditures among student support categories in the data sources for analyzing spending makes it impossible, without more detailed information from colleges, to determine how much schools are spending to support the education of enrolled students. That makes instructional spending the best proxy currently available across all schools.
At Online Schools, Instructional Spending Tends to Be Low
Some of the lowest instructional spending levels can be found at colleges with large online enrollments. Of the twelve colleges in the United States with 70 percent or more online students and total enrollments of 20,000 or more students in 2014–15, Colorado Technical University spends the smallest proportion of its tuition money, 9 percent, educating students, followed by online graduate school Capella University, at 10 percent.
Table 2
|
Top Twelve Online Educators, and Their Instructional Spending |
||||
| Institution | Enrollment (FTE) | Students enrolled exclusively online | Percent of tuition spent on instruction | Amount spent per student |
| University of Phoenix–Arizona | 169,921 | 78% | 21% | $2,381 |
| Kaplan University–Davenport Campus (now Purdue University Global) | 73,901 | 97% | 18% | $1,425 |
| Liberty University | 66,478 | 83% | 24% | $2,431 |
| Walden University | 60,970 | 100% | 31% | $3,022 |
| Grand Canyon University | 57,483 | 80% | 17% | $1,864 |
| Ashford University | 51,967 | 99% | 19% | $2,178 |
| Western Governors University | 49,566 | 100% | 38% | $2,596 |
| American Public University System | 40,875 | 100% | 27% | $2,087 |
| Southern New Hampshire University | 33,790 | 83% | 18% | $2,258 |
| University of Maryland–University College | 27,461 | 82% | 32% | $3,330 |
| Colorado Technical University–Colorado Springs | 24,258 | 93% | 9% | $1,338 |
| Capella University | 22,833 | 100% | 10% | $1,801 |
| Source: Author compilation from IPEDS and John Cheslock’s analysis of IPEDS Finance Survey data. | ||||
Why is instructional spending low at online colleges? The most charitable explanation, which is likely at least partly true, is that while online education has the potential to create efficiencies in instruction, it also requires more spending on information systems and other forms of student support. The less charitable explanation, which is also likely at least partly true, is that the faculty labor used in online education is largely a contingent and/or part-time workforce, and therefore costs less. And a third explanation—also likely true at some or even many schools—is that low-spending, high-tuition online education is a cash cow, with large chunks of tuition going not for education, but instead being used for:
- subsidizing intensive marketing for growth,
- high levels of profit for investors and owners at for-profit institutions, or
- at public and nonprofit schools, funds redirected to other parts of the university or set aside for the future.
Online providers interviewed regarding these figures urge caution in interpreting them.13 They argue that it may be that some instructional spending is being reported in other categories because of the different way that online instruction is organized. For example, course development that would be a professor’s job at a traditional university might be categorized as institutional support at an online institution because it is separated from the instructors’ role. There is evidence this may be the case at some institutions based on financial reports that sometimes separate marketing expenses from other educational spending. For example, Capella Education reported that in 2014 it spent 44 percent of its revenue on instructional costs and services excluding marketing.14 This is in contrast to its instruction-only spending in 2014–15, which came to 10 percent of revenue (see Table 2).
Officials at online schools also acknowledged that their use of adjuncts reduces salary expenses and avoids the cost of benefits as well.15 While this strategy would reduce instructional expenses, it also should lead to lower tuition, which would bring the instructional spending ratio up. Instead, it may be that many institutions are capturing that cost reduction and using it for marketing, profit, or subsidies of other programs.
Online education certainly can reduce costs by way of less overhead for facilities and maintenance, and ideally, these cost savings could be passed on to the student, or, importantly for students with more needs, used to improve the quality of the offering.16 Many online colleges target students with weaker academic backgrounds—precisely the type of student who needs attentive, high-quality teachers the most17—and the online education model has the potential to serve these students well. An institution that saves on overhead for facilities could hire more full-time faculty and reduce student-faculty ratios so that the students are set up for success.
Policymakers Should Use the Data—and Improve It
Spending on instruction and student support is critical for outcomes such as college completion, career success, and student loan repayment. Colleges that spend more on instruction and student support can have smaller class sizes, offer more and a greater variety of courses, and provide students with advisors and other assistance throughout the college experience. Research that specifies the link and effect of spending on student success have found that the greater the resources per student at a school, the more likely the student is to complete college, and to do so within a shorter period of time.18
As financial aid and government-sponsored student loan debt has grown, lawmakers have grown concerned about how that money is being used by colleges. In 2018, two bills were introduced in Congress that would specifically prohibit the use of federal funds on marketing, with one of the bills focusing the ban on institutions that fail to spend at least half of tuition revenue on instruction.19 Governor Andrew Cuomo similarly announced a plan at the beginning of 2019 that requires for-profit colleges in New York to shift their spending or tuition so that at least half goes to instruction.20
Quality educational outcomes are the result of the student engagement that comes from quality interactions with expert instructors.
The available data on college spending should be used to provide prospective students with information about what their tuition buys, and to give taxpayers assurance that their investment is not being wasted. Quality educational outcomes are the result of the student engagement that comes from quality interactions with expert instructors.
One immediate use of available data is as a consumer information tool: instructional spending levels should be freely available and searchable by college name to inform students. TCF will soon be launching an interactive tool for the public to review the instructional spending of any school.
Other recommended uses of available instructional and support spending data include:
- creating a taxpayer accountability tool, through which the general public can see where their tax dollars are well spent;
- federal and state lawmakers setting a threshold spending level that, if exceeded, would trigger the application of requirements for institutions to reveal additional expenditure information;
- applying additional or tiered levels of oversight to schools below particular spending levels in certain categories; and
- determining eligibility in funding programs based in part on spending levels or ratios.
The use of spending data for accountability would be new , however, so colleges would need to be given time to be able to address any errors in reporting. Lawmakers should therefore delay implementation of any actions based on a new measure for a period to allow for those adjustments. An additional measure that might be considered is to use multiple years of data, such as a three-year rolling average, to avoid any single-year aberrations in revenue or spending or changes in internal expenditure classification systems.21
In addition, policymakers should also take steps to improve the data reporting by colleges so that it better track students supports separately from marketing and recruitment expenses. One lawmaker, in fact, has already taken action: Representative Mark Takano (D-CA), the chair of the House Veterans Affairs Committee, asked the director of the finance survey that colleges complete to ensure that marketing and recruitment expenses are reported separately from the student services category.22 While a prior panel had decided against this approach, out of concerns about how best to define marketing,23 one way to address potential gaming of a definition would be to confine the non-marketing category to spending on students who have enrolled and started classes.
The data collected by the U.S. Department of Education is always evolving out of need. For example, in 2017, the agency revised the survey to expand the types of students on which it collects data, as well new data on graduation and outcomes measures. This move now gives researchers a clearer picture of student and institution performance by providing them with data on part-time and non-first-time students at every college receiving federal financial aid.24 The finance portion of the survey has been updated seven times since 1987, all in efforts to accommodate the nature of and to better align comparability across the different sectors within higher education.25
The public has never been more frustrated with rising college tuitions, nor more concerned about ballooning student loan debt, and so it has a right to understand better the value of a college education from any particular institution. Transparency and accountability for the way that colleges spend consumer dollars and taxpayer-financed loans and grants can help students make better choices and hopefully steer funding in the directions that is most beneficial to students and the public—actual teaching—and to provide an incentive for colleges to reduce other expenses that are contributing to higher tuition.
Acknowledgements
Thank you to Fernando Furquim, PhD candidate at the University of Michigan Center for the Study of Higher and Postsecondary Education, for contributing background research to this report.
Notes
- NPR compared the salary packages of the top compensated college presidents to the average student debt load of their students. See Anya Kamenetz, “More College Presidents Join the Millionaires’ Club,” NPR, December 13, 2017, https://www.npr.org/sections/ed/2017/12/13/569943593/more-college-presidents-join-the-millionaires-club. Many athletic directors and coaches are the highest paid public employees in their states. See “Who’s The Highest-Paid Person in your State?” ESPN, March 20, 2018, http://www.espn.com/espn/feature/story/_/id/22454170/highest-paid-state-employees-include-ncaa-coaches-nick-saban-john-calipari-dabo-swinney-bill-self-bob-huggins. A 2012 Senate investigation found the average CEO compensation of the publicly traded, for-profit colleges was $7.3 million. The five highest paid leaders of large public universities was $1 million on average, while the five highest paid nonprofit college leaders was $3 million on average. See “For Profit Higher Education: The Failure to Safeguard the Federal Investment and Ensure Student Success,” U.S. Senate, Health, Education, Labor and Pensions Committee, Majority Committee Staff Report and Accompanying Minority Committee Staff Views, July 30, 2012, https://www.help.senate.gov/imo/media/for_profit_report/PartI-PartIII-SelectedAppendixes.pdf.
- Ann M. Gansemer-Topf and John H. Schuh, “Institutional selectivity and institutional expenditures: Examining organizational factors that contribute to retention and graduation,” Research in Higher Education 47, no. 6 (2006): 613–42, https://link.springer.com/article/10.1007/s11162-006-9009-4; Ann M. Gansemer-Topf, Jillian Downey, Katherine Thompson, and Ulrike Genschel, ”Did the Recession Impact Student Success? Relationships of Finances, Staffing and Institutional Type on Retention,” Research in Higher Education 59, no. 2 (2018): 174–97, https://link.springer.com/article/10.1007/s11162-017-9462-2; Gary R. Pike, George D. Kuh, Alexander C. McCormick, Corinna A. Ethington, and John C. Smart, ”If and when money matters: The relationships among educational expenditures, student engagement and students’ learning outcomes,” Research in Higher Education 52, no. 1 (2011): 81–106.
- Amanda L. Griffith and Kevin N. Rask, ”The effect of institutional expenditures on employment outcomes and earnings,” Economic Inquiry 54, no. 4 (2016): 1931–45, https://onlinelibrary.wiley.com/doi/full/10.1111/ecin.12336; Terry T. Ishitani and Sean A. McKitrick, ”Are student loan default rates linked to institutional capacity?” Journal of Student Financial Aid 46, no. 1 (2016): 3, https://publications.nasfaa.org/jsfa/vol46/iss1/3/.
- Dan A. Black and Jeffrey A. Smith, “Estimating the returns to college quality with multiple proxies for quality,” Journal of Labor Economics 24, no. 3 (2006): 701–28, https://www.journals.uchicago.edu/doi/10.1086/505067.
- “Evaluation of Accelerated Study in Associate Programs (ASAP) for Developmental Education Students,” MDRC, https://www.mdrc.org/project/evaluation-accelerated-study-associate-programs-asap-developmental-education-students#overview.
- See Strayer University advertisement, “Strayer University + Queen Latifah: Mastering Confidence,” YouTube, January 9, 2019, https://www.youtube.com/watch?v=raSNKJPnYWE&feature=youtu.be; Southern New Hampshire University advertisement, “Stand Up: Set Your Own Course at SNHU (:30),” YouTube, December 11, 2017, https://www.youtube.com/watch?v=sfHYnKMVrfw&feature=youtu.be; and University of Phoenix advertisement, “We Can Do IT (:60)—University of Phoenix,” YouTube, May 22, 2017, https://www.youtube.com/watch?v=2TTd2FmYr0g&feature=youtu.be.
- See Bob Brock, “College Advertising at All-Time High,” Educational Marketing Group, October 5, 2017, https://emgonline.com/2017/10/college-advertising-at-all-time-high/#fn1; see also “2018 Cost of Recruiting an Undergraduate Student Report,” Ruffalo Noel Levitz, 2018, http://learn.ruffalonl.com/rs/395-EOG-977/images/RNL_2018_Cost_of_Recruiting_Report_EM-005.pdf, which found four-year private nonprofit institutions spent three times more than four-year public institutions on recruitment.
- Online advertising data from Jim Leichenko, “University of Phoenix Leads Online Education Advertisers in Paid Search,” Kantar Media, April 27, 2017, https://www.kantarmedia.com/us/thinking-and-resources/blog/adg-university-of-phoenix-leads-online-education-advertisers-in-paid-search.
- “Starts” are students who complete all financial aid requirements and begin attending classes, thus triggering the movement of federal student loan money to the institution. See “For-profit Schools: The Student Recruitment Experience,” U.S. Senate, Committee on Health, Education, Labor, and Pensions Hearing, August 4, 2010, https://www.govinfo.gov/content/pkg/CHRG-111shrg78780/pdf/CHRG-111shrg78780.pdf.
- Tressie McMillan Cottom, Lower Ed: The Troubling Rise of For-Profit Colleges in the New Economy (New York: The New Press, 2017).
- Alec MacGillis, “Billion-Dollar Blessings: How Jerry Falwell Jr. transformed Liberty University, one of the religious right’s most powerful institutions, into a wildly lucrative online empire,” ProPublica, April 17, 2018, https://www.propublica.org/article/liberty-university-online-jerry-falwell-jr.
- Remarks given during an Education Writers Association January 2019 event, https://www.ewa.org/covering-higher-educations-new-political-landscape.
- Personal communications between the author and officials from two large for-profit institutions and two large nonprofit institutions.
- Capella Education Company’s 2014 Securities and Exchange Commission filing can be found at https://www.sec.gov/Archives/edgar/data/1104349/000110434915000009/form10-k2014.htm.
- Personal communications between the author and officials from two large for-profit institutions and two large nonprofit institutions.
- P. Chau, “Online higher education commodity,” Journal of Computing in Higher Education 22 (2010): 177–91.
- A study by Eric Bettinger and Susanna Loeb of The Brookings Institution was the first to study online learning at for-profit institutions specifically and online courses at large non-selective institutions generally. See “Promises and Pitfalls of Online Education,” The Brookings Institution, June 9, 2017,https://www.brookings.edu/research/promises-and-pitfalls-of-online-education/.
- John Bound and Sarah Turner, “Cohort crowding: How resources affect collegiate attainment,” Journal of Public Economics 91, no. 5–6 (2007): 877–99, https://www.sciencedirect.com/science/article/pii/S0047272706001137; John Bound, Michael F. Lovenheim, and Sarah Turner, “Why have college completion rates declined? An analysis of changing student preparation and collegiate resources,” American Economic Journal: Applied Economics 2, no. 3 (2010): 129–57, https://www.aeaweb.org/articles?id=10.1257/app.2.3.129; John Bound, Michael F. Lovenheim, and Sarah Turner, “Increasing time to baccalaureate degree in the United States,” Education Finance and Policy 7, no. 4 (2012): 375–424, https://www.mitpressjournals.org/doi/10.1162/EDFP_a_00074.
- In the Senate, S.3752 was introduced by Senator Sherrod Brown and in the House of Representatives, Representative Grijalva introduced H.R. 7303. Both bills would restrict the use of federal funds on marketing activities. The Aim Higher Bill was introduced by Representative Bobby Scott. The bill would measure instructional spending as a proportion of collected tuition revenue.
- Yan Cao, “Governor Cuomo Demands Quality from For-Profit Colleges—Or Else,” The Century Foundation, January 17, 2019, https://tcf.org/content/commentary/governor-cuomo-demands-quality-profit-colleges-else/.
- Kolbe and Kelchen’s research found that large changes in values during a short period of time were indicative of changes in accounting or changes in budget office personnel. See T. Kolbe and R. Kelchen, “Identifying New Metrics Using IPEDS Finance Data,” National Postsecondary Education Cooperative, 2017, https://nces.ed.gov/ipeds/pdf/npec/data/NPEC_Paper_New_IPEDS_Finance_Metrics_2017.pdf.
- Letter from Representative Mark Takano to IPEDS project director Janice Kelly-Reid, dated December 26, 2018.
- A 2015 IPEDS Technical Review Panel considered ways to add expense categories like marketing to the Annual Finance Survey. The panel opted not to make changes to the survey because of difficulty in defining marketing. See “Report and Suggestions from IPEDS Technical Review Panel 46: Improvements to the Finance Survey,” https://edsurveys.rti.org/IPEDS_TRP_DOCS/prod/documents/TRP46_Summary.pdf.
- In October 2017, the Integrated Postsecondary Education Data System was expanded to include college completion information for part-time and non-first-time students and more detailed graduate rates. Doug Lederman, “The New, Improved IPEDS,” Inside Higher Ed, October 12, 2017, https://www.insidehighered.com/news/2017/10/12/new-federal-higher-ed-outcome-measures-count-part-time-adult-students.
- Allison Bell, “Improving the IPEDS Finance Component,” National Postsecondary Education Cooperative, March 2015, https://nces.ed.gov/ipeds/pdf/npec/data/NPEC_Paper_Improving_the_IPEDS_Finance_Component_2015.pdf.