
A changing economy in Michigan means that education beyond high school, whether it’s a degree or training for a specific skill or job, is more important than ever. But in Michigan, low- and middle-income families are seeing college costs continue to rise—for many, rising beyond their reach. Michigan has some of the highest public tuition levels in the nation—partly due to sharp cuts in state funding per student—while it also has experienced the nation’s worst wage declines of the twenty-first century. Without a strong financial aid system to make up for the widening gap between the cost of college and what families can afford to pay, many college-ready residents forgo education, or they take on significant debt that dampens the economic benefits of their degree. Understanding the nature of this affordability crisis is critical to building a holistic state strategy to address it.
This analysis of college affordability in Michigan in this report reveals some key trends:
- State lawmakers have reduced per student funding for university operations and grant aid to students, leaving Michigan students and their families to shoulder the cost of college, despite increasingly fragile family finances. For lower-income families, the total cost of attendance after aid averages about one-third of household income for a public university, and one-sixth for a community college.
- Access and affordability vary greatly by geography, race, income, and age, underscoring the importance of financial accessibility across institutions and for nontraditional college students. State grant aid is virtually unavailable for adults, and the financial burden for a median-income Michigan family can increase by as much as 50 percent from one county to another.
- Student debt is rising: student loan borrowers graduate from Michigan bachelor’s degree programs with more than $31,000 in debt, on average, and since 2000, the average student debt burden among graduates of public universities has increased 43 percent.
This report is the first in a series on the finance of Michigan higher education at The Century Foundation. The series is a part of a multi-state project looking at higher education finance and affordability efforts across the country.
The Financial Burden of College Shifts to Families
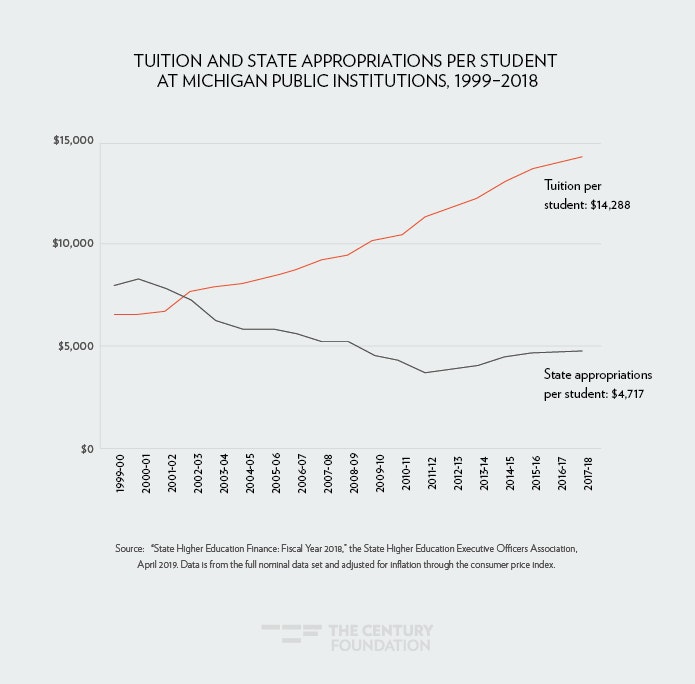
As agencies of the state, public institutions receive appropriations from the legislature to support operations, reducing the need to charge tuition to fund those costs. However, state appropriations per student declined 56 percent between 2000 and 2012, and since the post–Great Recession nadir, increases have made up only a quarter of the ground lost (see Figure 1).
Figure 1
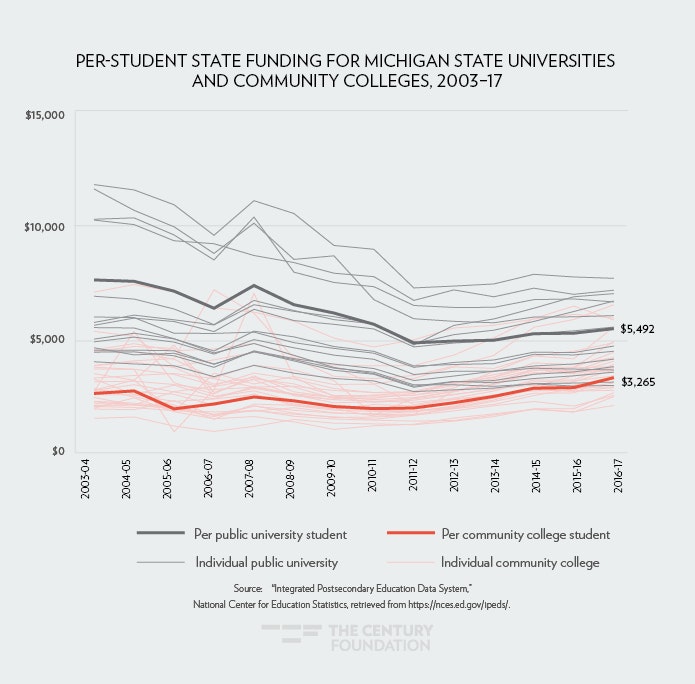
Currently, the state allocates $5,492 per public university full-time equivalent1 student, which ranks twelfth-lowest among the states, and $3,265 per community college student, which ranks fifteenth-lowest among the states.2 (See Figure 2.)
Figure 2
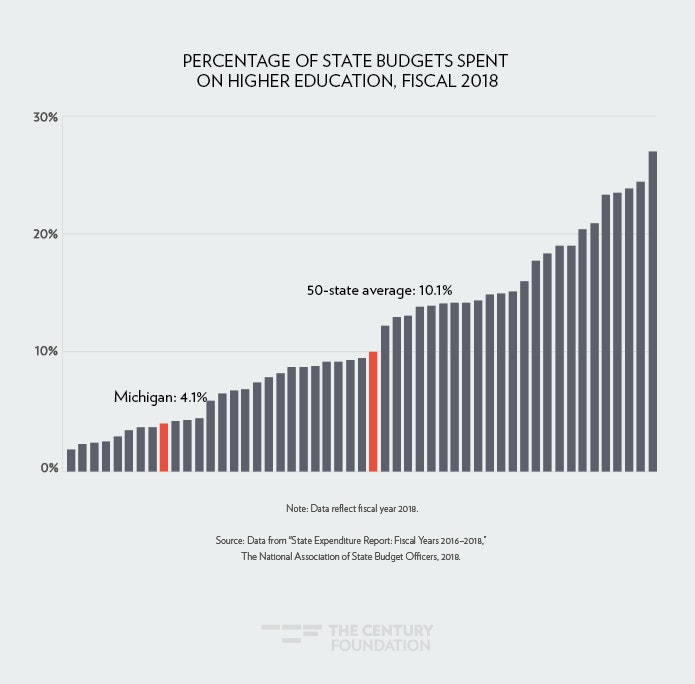
Compared to other states, Michigan devotes a smaller share of its budget to higher education: in fiscal year 2018, higher education comprised 4.1 percent of state expenditures, compared to a fifty-state average of 10.1 percent.3 (See Figure 3.) Low state investment makes the federal support Michigan receives for higher education critical.4 Michigan’s state grant aid is largely funded on the back-end by federal dollars, and federal Pell Grants comprise 29 percent of grant aid dollars received by Michigan students.5
Figure 3
Meanwhile, the percentage of students who receive Pell Grants—considered a proxy for low-income status—has risen from 20 percent in 2004-05 to 29 percent in 2016–176. Some of this increase is likely due to changes in eligibility for the Pell Grant starting in 2008, but in general, low-income students are attending college at higher rates. Nationally, the college-going rate of low-income students has been trending upward since the early 2000s.
Table 1
| Percentage of Low-Income Recent High School Completers Enrolling in College Nationwide, 2000–16 | ||||
| 2000 | 2004 | 2008 | 2012 | 2016 |
| 41.7% | 51.4% | 56.1% | 50.3% | 67.1% |
| Note: Data represent three-year rolling average. Source: “Digest of Education Statistics 2017: Table 302.30,” National Center for Education Statistics, 2017. |
||||
In general, low-income students are more likely to attend under-resourced high schools,7 may need support services in college,8 and have less ability to pay tuition out-of-pocket than higher-income students. With higher-need students and lower appropriations, public institutions have had to do more with less.
Differences in Funding by Institution
Given that Michigan has no coordinating board for higher education to develop a consolidated budget request, each of the forty-six public institutions separately requests funding from the legislature. Appropriations increases are not uniform: for example, increases to universities’ appropriations ranged from 0.3 percent to 4.2 percent in fiscal year 2014.9
In addition to receiving appropriations from the state, community colleges rely on funding from their local government, and these local appropriations vary widely: for every dollar Mid Michigan College receives in local funding per student, West Shore Community College receives $17. Trends over time in local funding also differ, and while some community colleges have higher local funding per student than they received in 2004, others have seen declines of one-third or more.10 (Appendix 1 shows trends over time for every community college.)
State Appropriations and College Access
Historically underrepresented students—in particular, low-income students, black students, and Latinx students—continue to be underrepresented at Michigan public institutions. Many of those students also attend institutions that receive lower-than-average state funding, with implications for completion rates and degree outcomes.
There is no clear correlation between Latinx enrollment and appropriations, but there is a general trend of lower-appropriation universities having higher black enrollment percentages. We estimate that the median black student enrolled in a public university is supported by $4,461 in state appropriations, compared to $5,466 for the median white student.11 Wayne State University is a notable exception to the trend, with high appropriations and black enrollment. (Appendix 2 provides this data for all public universities.)
The median black student enrolled in a public university is supported by $4,461 in state appropriations, compared to $5,466 for the median white student.
Under-resourcing hurts outcomes for students of color, and a disproportionately small share of degrees are awarded to black or Latinx graduates. As of 2017, the annual number of black and Latinx Michiganders earning bachelor’s degrees would need to more than double to match state demographics. (Appendix 3 shows underrepresentation at every credential level.)
Similarly, Pell Grant recipients are more highly concentrated in lower-appropriation institutions (as seen in Appendix 4). After they enroll, the six-year bachelor’s completion rates for Pell Grant recipients are disproportionately low: 39 percent at the median public university, compared to 58 percent for students not receiving the Pell Grant.12
Rising Tuition
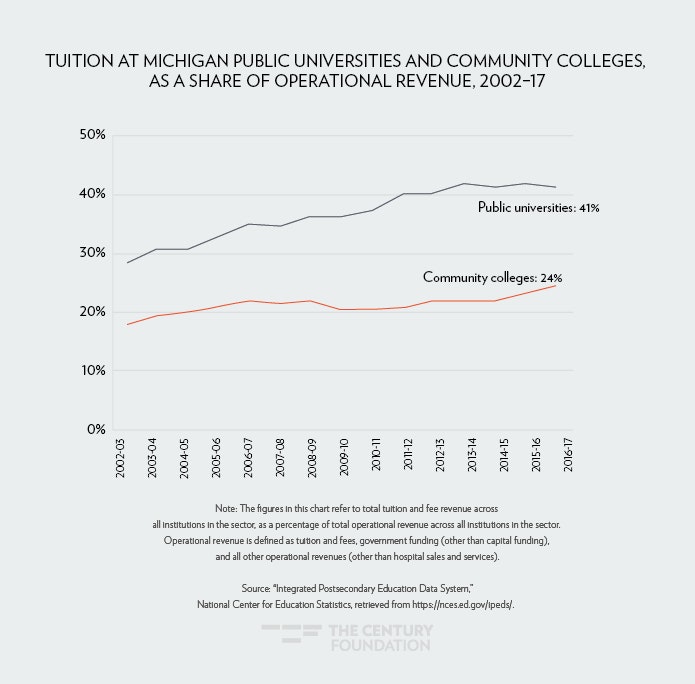
When institutions have fewer resources coming from the state, they depend more on tuition. Since the early 2000s, tuition’s share of revenue has grown by one-third at community colleges and nearly one-half at public universities, as shown below.13 (See Figure 4.) Michigan is now one of the most tuition-dependent states in the nation, and the amount of tuition that the state’s public universities collect per student is the highest in the nation.14
Figure 4
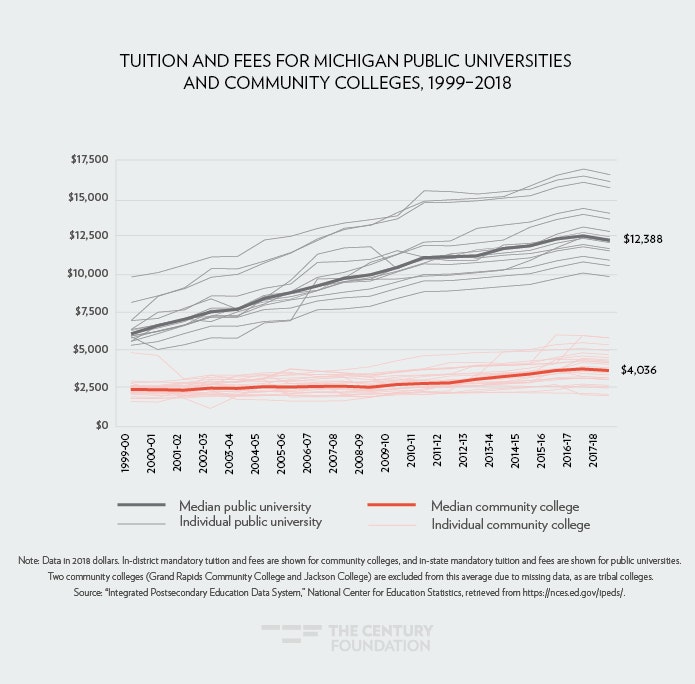
As institutions lose other forms of revenue, they frequently raise tuition to balance their budgets. This allows them to make up for disappearing state dollars, to generate a source of institutional aid to disburse to students, and to cover rising educational costs—but it can lead to high price increases for students and families. After accounting for inflation, the “sticker price”15 of tuition and fees for in-state students has doubled at the median Michigan public university since 2000. (See Figure 5.) At community colleges, the median tuition and fees for in-district students has risen by 55 percent over the same period.16
Figure 5
The Total Cost of Attendance
Even after the tuition bill is paid, a student must manage non-tuition costs, such as food, housing, health care, transportation, and more. Michigan is a particularly high-cost state for housing and transportation: there is a shortage of affordable housing for the lowest-income households, and car insurance premiums are nearly 80 percent above the national average.17 In total, 43 percent of Michigan households did not have the income to afford all basic needs in 2017, much less tuition.
After factoring in living costs, the full cost of attendance18 far exceeds already-high tuition and fees. With nearly all state aid in Michigan tied to tuition and fees, non-tuition costs are left unaddressed by the state’s aid framework.19 A student’s living arrangements will dictate their total cost of attendance, as seen in Table 2.20
Table 2
| Average Cost of Attendance, by Type of Institution and Living Situation | |||
| Community college | Public university | Private nonprofit four-year | |
| Living at home with family | $8,469 | $16,778 | $31,606 |
| Living off campus without family | $14,624 | $24,600 | $38,962 |
| Living on campus | * | $25,862 | $40,661 |
| *Data omitted due to the small share of students in these categories. Source: “Integrated Postsecondary Education Data System,” The National Center for Education Statistics, retrieved from https://nces.ed.gov/ipeds/ on June 18, 2019. Data reflects academic year 2016–17. |
|||
The cost of attendance is lowest when a student lives at home, but this is not an option for students in many rural parts of the state where there is no institution nearby.21 There are sixteen counties with below-average income and no public university in either their own county or an adjacent one (see Appendix 5). Living with a parent is also not an option for many older adult students. Moreover, many young people in low-income families must contribute to rent and other expenses, which are not necessarily captured by the cost of attendance estimates here.
Gaps in Student Aid Framework
While tuition has increased and the cost of attendance remains high, the student aid received by Michigan students has not kept pace, and its distribution among students is not in line with the state’s most pressing needs.
State and Local Grant Aid
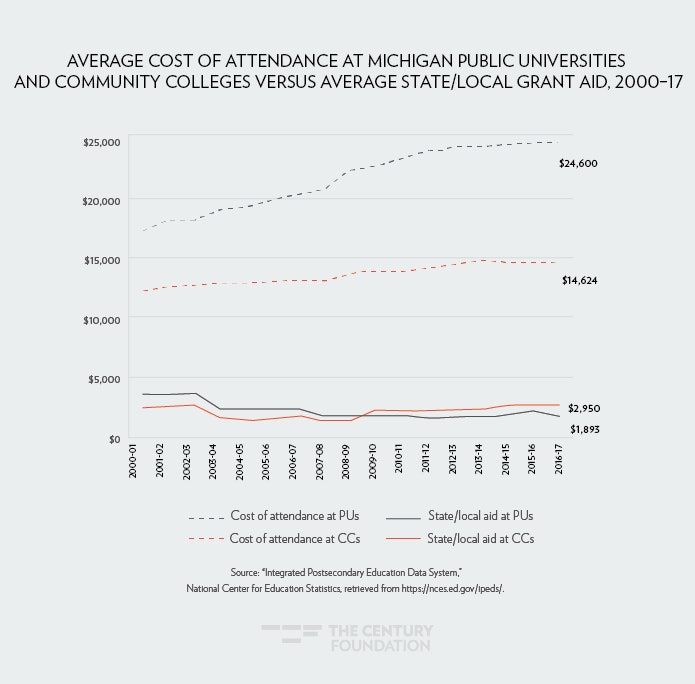
Along with base appropriations, state financial aid programs are a strong tool to reduce the cost burden placed on students and families. At the turn of the century, the average state/local aid award covered average tuition at community colleges, or about half of average tuition at public universities. (See Figure 6.) The rising cost of attendance and falling aid have created a very different picture today.22
Figure 6
The 21st Century Education Commission, a task force created by the governor’s executive order in 2016 and charged with envisioning how Michigan can reclaim its status as a top-tier state for education, calculated in 2017 that it would take $140 million per year merely to return to pre–Great Recession financial aid levels.23 However, the state would need much more to counteract the increases in tuition, and even in 2006–07 Michigan ranked in the bottom half of states for need-based aid per student.24
A return to prior aid levels would also require a greater state role in the finance of student aid. Currently, most Michigan student aid dollars do not come from the state general fund, but rather from federal dollars. Were it not for the federal TANF dollars allocated to student aid,25 Michigan would have the nation’s third-lowest state aid per student.26
Atop the insufficient volume of aid, the design of the state aid framework means that many students with financial need are ineligible. Michigan channels 83 percent of its state-facilitated grant aid through three programs,27 but these programs only reach a small fraction of students.28 (See Table 3.)
Table 3
| Three Largest Michigan Grant Aid Programs | |||
| Program | Basis for eligibility | Average award | Estimated percentage of in-state students receiving grant29 |
| Tuition Incentive Program (TIP) | Medicaid enrollment | $2,543 | 4.0% |
| Michigan Competitive Scholarship (MCS) | Unmet financial need* and top 20 percent ACT/SAT score | $787 | 6.1% |
| Michigan Tuition Grant (MTG) | Unmet financial need* and enrollment at a private nonprofit institution | $1,473 | 2.8% |
| Note: Note: Statistics reflect 2016–17 award year. * Financial need demonstrated via FAFSA. Source: Data comes from “Integrated Postsecondary Education Data System,” National Center for Education Statistics, retrieved from https://nces.ed.gov/ipeds/, and “2016-17 Annual Report: Student Grants and Scholarships,” Student Financial Services Bureau, Michigan Department of Treasury, https://www.michigan.gov/documents/mistudentaid/Annual_Report_2017_635957_7.pdf. |
|||
The state’s primary need-based aid program, the Tuition Incentive Program (TIP), has obscure eligibility requirements and a complicated two-phase structure,30 adding to the complexity low-income and first-generation students and their families already face in the college-going process. Meanwhile, the Michigan Competitive Scholarship (MCS) averages $787, a small amount for high-achieving students who are likely to attend a four-year university, and the Michigan Tuition Grant (MTG) averages $1,473, which covers only a small fraction of costs at Michigan private nonprofit institutions. Due to high tuition levels, the average MCS and MTG awards may be too small to meaningfully change enrollment behavior.
Once someone is ten years out of high school, they are virtually locked out of these programs, rendering these dollars inaccessible to mid-career adults looking to adapt their skillset.
Once someone is ten years out of high school, they are virtually locked out of these programs, rendering these dollars inaccessible to mid-career adults looking to adapt their skillset. Michigan once had a specific grant aid program for adults, the Adult Part-Time Grant; the adult share of enrollment has declined31 since this program’s termination in 2010.32
Fifteen Michigan localities offer “Promise Zone” scholarships, state-supported place-based guarantees of free tuition.33 By allowing areas with above-average poverty to capture half of property tax revenue growth for grant aid for residents, the state gives qualifying students in these high-need areas a guarantee of free tuition at the nearest community college, and sometimes additional benefits.34 The zones are well-placed to target underrepresented groups: they include 36 percent of the state’s families with children in poverty, 58 percent of black children in Michigan, and 32 percent of Latinx children.35 However, few are accessible to adults, and they generally do not cover expenses beyond tuition.
Michigan also promises free tuition for citizens of the state’s federally recognized native tribes attending Michigan community colleges and public universities.36 At public universities, these waivers totaled $10.6 million for 1,139 recipients in 2016–17.37 However, the state has underfunded the program in recent years and left institutions to cover a substantial shortfall, an estimated $6.7 million in 2019.38
Combined, state and local aid reaches 18.9 percent of community college students and 17.5 percent of public university students.39 (A full list of state grant aid programs and further details is provided in Appendix 6.) The legislature is currently considering two significant proposals for financial aid. The Michigan Reconnect grant would cover tuition (after all other aid has been applied) for residents who are age 25 and older, enrolled at least half-time, and seeking an associate’s degree or certificate.40 The Michigan Opportunity grant would cover tuition after other aid for residents who enroll at a community college full-time immediately following high school, and it would include a track for academically strong low- and moderate-income students to receive up to $2,500 in tuition assistance at a public university for two years.41
Institutional Aid
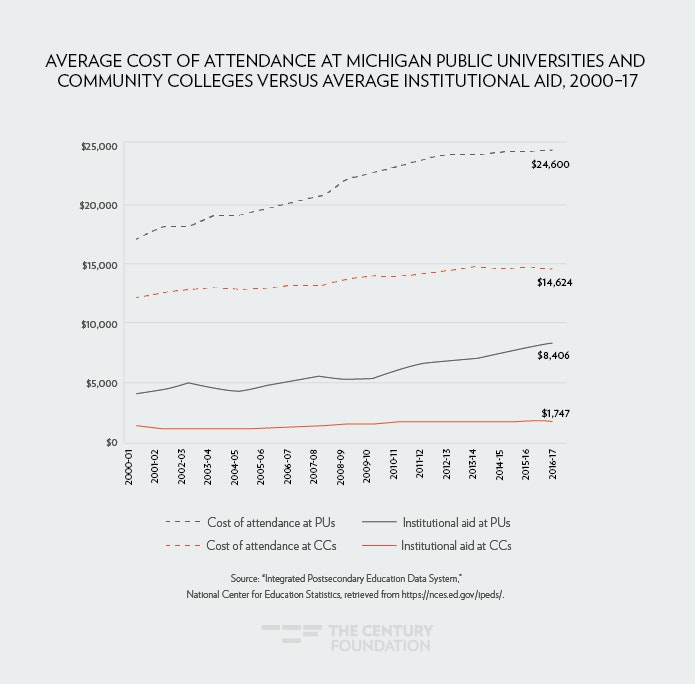
As tuition has risen and state aid has declined, institutions have increased the amount of campus aid they give directly to students, with the average award nearly doubling since 2000.42 A small percentage (16.2 percent) of community college students43 receive institutional aid, but a majority (66.3 percent) do at public universities. (See Figure 7.)
Figure 7
This increase in institutional aid has not neutralized the effects of rising tuition and declining state grant aid. Recent research finds that, compared to state need-based aid, institutional aid is less strongly associated with reduced costs after aid.44 One reason for this difference is the distinct function of institutional aid compared to state aid: whereas state grant aid is designed to motivate students to enroll in college when they otherwise would not, institutional aid is designed to motivate students to enroll in a certain college. In other words, state grant aid serves the state’s interests to get more Michiganders to go to college, while institutional aid serves the institution’s interests to enroll the best students. In fiscal year 2012, all but three of Michigan’s public universities delivered the majority of their institutional aid based on merit, as opposed to need.45
Institutional aid is currently out of state policymakers’ direct control. On one hand, heavy reliance on institutional aid limits policymakers’ ability to advance statewide goals: each institution makes institutional aid decisions independently using its own criteria about who receives it.46 On the other hand, the amount available for institutional aid at public institutions relates back, in part, to the base appropriations each institution receives from the state.
There is wide variation among public universities in the percentage of tuition covered by the average institutional aid award, as well as the percentage of students who receive institutional aid. Unlike state or federal aid that a student can take with them to their institution of choice, a student cannot expect the same institutional aid from one university to another, and the differences may be large. (Appendix 7 shows how the strength and scope of institutional aid varies by public university.)
Federal Aid
The average federal aid award to students in Michigan rose sharply in the years surrounding the Great Recession. After falling slightly, it is still about $1,000 higher in real dollars today as compared to 2000.47 Although the average Pell Grant can cover average community college tuition, it does not go as far at public universities. (See Figure 8.)
Figure 8
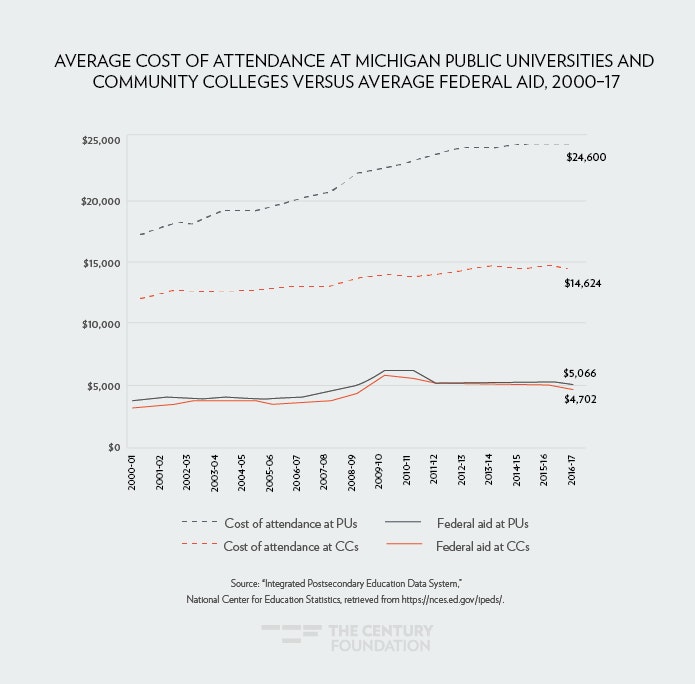
About half (50.4 percent) of students48 at community colleges receive federal aid; almost one-third (30.7 percent) do at public universities.
Net Price
Net price is the cost of attendance that remains after all grant aid is applied. At public universities, the average net price is generally lower for low-income families than for high-income families. (See Figure 9.)
Figure 9
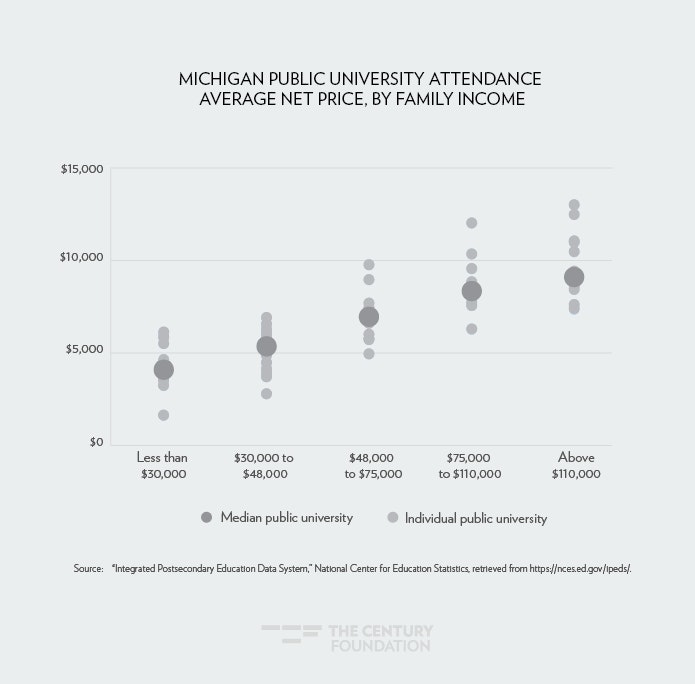
Although net price increases with income, net price as a share of income decreases as income rises. For example, the average net price at the median public university demands about 32 percent of income for a family making $30,000, compared to about 16 percent of income for a family making $110,000.49
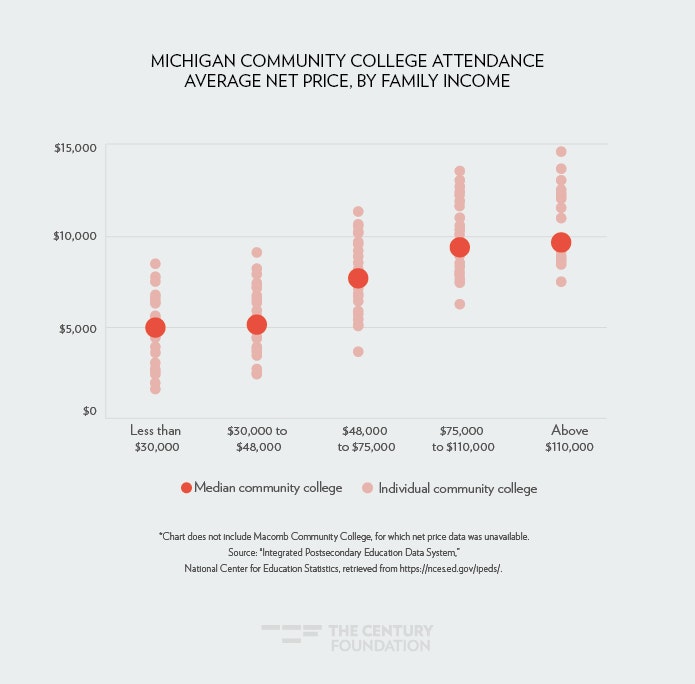
The same pattern is seen at community colleges—however, there is wide variation in net price across institutions, at all income levels. (See Figure 10.) This means that some community colleges are much more expensive than the average, even for low-income students: a very low-income student50 attending Northwestern Michigan College, for example, can expect to pay more out of pocket than a very high-income student51 attending Alpena Community College.
Figure 10
A student will generally not find cheaper options in the private sector. At all income levels, net price at the median private nonprofit four-year institution in Michigan is higher than net price for students at the median public university, with the difference being greatest for the lowest-income students.52
The Finance of Michigan’s Tribal Colleges
Michigan’s three tribal colleges—Bay Mills Community College, Keweenaw Bay Ojibwa Community College, and Saginaw Chippewa Tribal College—have been separated from our analysis thus far due to fundamentally dissimilar financing models, as they are largely dependent on federal dollars. In 2016–17, these three colleges together produced 62 associate’s degrees and 77 certificates, and enrolled 984 students.53
Table 4
| Michigan’s Tribal Colleges | |||
| Bay Mills Community College | Saginaw Chippewa Tribal College | Keweenaw Bay Ojibwa Community College | |
| Average cost of attendance after aid (includes non-tuition costs) | $5,159 | $6,600 | $6,366 |
| Percent of students identifying as Native | 55% | 53% | 75% |
| Note: All values reflect the 2016–17 academic year. Source: “Integrated Postsecondary Education Data System,” National Center for Education Statistics, retrieved from https://nces.ed.gov/ipeds/. |
|||
The tribal colleges’ operations are largely financed by the federal government. The state does not appropriate funding to the tribal colleges.54
Family Finances
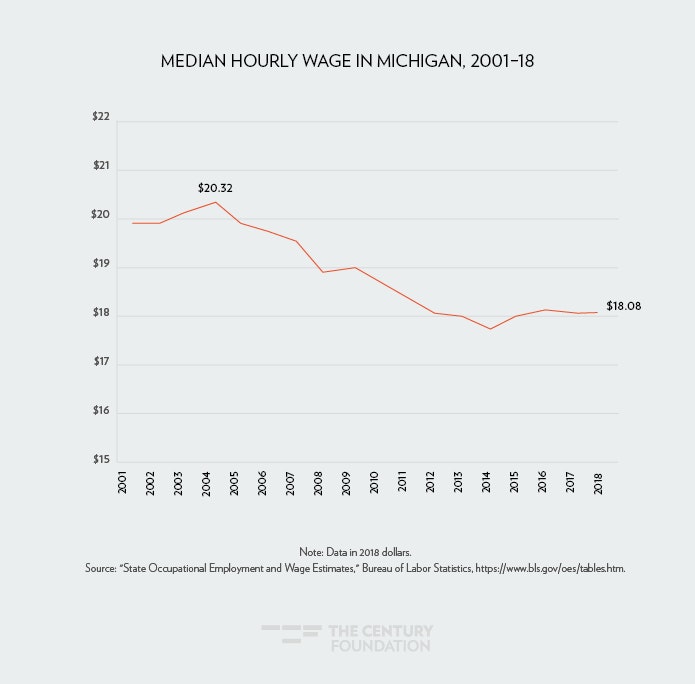
The shifting of higher education cost burdens to families is especially concerning in Michigan, where family finances have been hit harder than in any other state in recent years. (See Figure 11.) Wages in Michigan have substantially fallen across the income scale: three out of four wage-earners in Michigan earn at least 7 percent less today than in 2003,55 and Michigan’s poverty rate of 14 percent ranks fifteenth-highest.56 Moreover, these changes have disproportionately harmed black families57 and adults without a bachelor’s degree,58 populations whose increased degree attainment is critical.
Figure 11
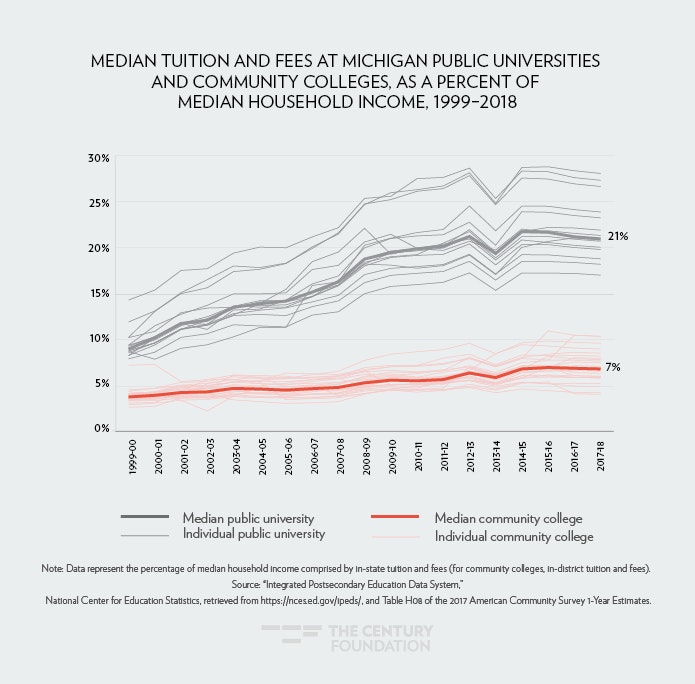
Lower household earnings exacerbate the problem of rising tuition for prospective students, and the share of median household income needed to pay tuition and fees has grown significantly over the past twenty years. (See Figure 12.)59 While tuition and fees at the median public university consumed 9 percent of median household income in 1999–2000, the share was 21 percent in 2016–17.60
Figure 12
The burden on family finances varies by location, partly explained by income differences. In Washtenaw County, average net price for nearby Eastern Michigan University61 comprises 17.5 percent of the median family income.62 In Wayne County, where income is lower, average net price for Wayne State University63 comprises 25.2 percent of median family income.64
Geographic variation in affordability may play a role in geographic variation in enrollment. Although there are eight school districts where more than 80 percent of high school graduates enroll in college within four years of graduation, there are six school districts where the rate is less than 65 percent.65
Expected public university net price demands 31.1 percent of the median single-race black household income compared to 23.6 percent of the median single-race white household income.
Rising tuition also has a greater impact on communities of color due to income disparities by race and ethnicity. Expected public university net price66 demands 31.1 percent of the median single-race black household income,67compared to 23.6 percent of the median single-race white household income.68
Unmet Need
After grant aid and the estimated contribution from the student’s family or their own prior earnings, Michigan public university students average $8,048 in unmet need for the full cost of attendance per year, and community college students average $3,695.69 Student jobs and loans typically fill this gap.
Data on student employment is limited, but the best available data suggests that, in Michigan, more than two-thirds of students from low-income families70 work for pay while enrolled, averaging twenty-eight hours worked weekly.71 Research has found that this workload jeopardizes low-income students’ likelihood to progress in college. Further data collection within the state is important to better understand the details and implications of work burdens among Michigan students.
Debt and Its Detriments
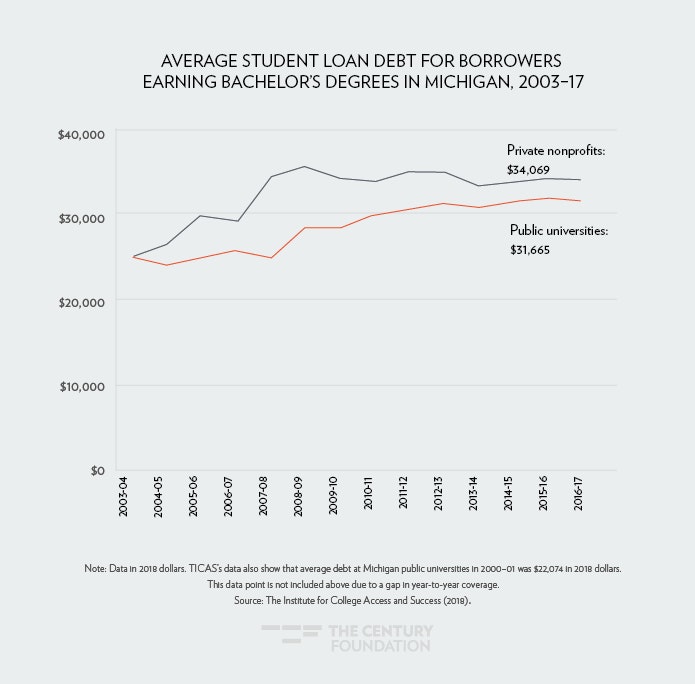
The trends of rising tuition and declining grant aid make many Michiganders rely on student debt to pay for college. Among loan borrowers who graduated in 2017 from Michigan public universities,72 student loan debt averaged $31,665,73 ranking eighth-highest among the states, and representing a 43 percent increase since 2000.74 (See Figure 13.)
Figure 13
Rising student loan debt poses a threat not only to students’ financial health, but also to the state economy: Increased postsecondary degree attainment can stimulate an economy, but its macroeconomic benefit may be blunted if it occurs by way of severe student debt burdens.
The problem of student debt is compounded when students do not graduate with a degree. At Michigan community colleges, an average of 17 percent of students complete their degree or credential within three years,75 which is the sixth-lowest rate in the nation. Six years after starting a bachelor’s degree program, an average of 62 percent of students at Michigan public universities have a degree, compared to 56 percent at private nonprofit four-year institutions and 38 percent at for-profit four-year institutions.76 College completion is linked to family resources, even among academically proficient students,77 and decreases to the price students pay after aid would likely improve completion rates.78
Looking Ahead
The current state of Michigan higher education poses serious challenges for someone who is considering pursuing a postsecondary degree. High tuition and little support for non-tuition costs mean that, for low- and middle-income students in particular, attendance will require working while learning and taking on student loans. And these students will need to know within a few years of leaving high school whether they want to go to college, because nearly all state and local aid is available only to recent high school graduates. Many families are struggling to pay for basic needs, putting pressure on young people to enter the workforce and start earning straight out of high school. Meanwhile, adults who are no longer fresh out of high school may be discouraged by both the lack of aid and the implicit message that the state of Michigan is indifferent to their desire to go to college. Given these trends, too many students do not enroll, or if they do, they take on high levels of debt.
As one senior advisor to the governor said in a recent hearing, “The status quo is not a financially neutral position—we go down.”
The Michigan state government literally cannot afford for these trends continue. As one senior advisor to the governor said in a recent hearing, “The status quo is not a financially neutral position—we go down.”79
Our analysis shows that the burden of college finance has fallen hard on the shoulders of students and families. The outcomes we see—disparities by race and income, unmet financial need, and rising student debt—reinforce existing inequities in college access and completion, rather than breaking them down.
Acknowledgments
The authors thank Michelle Miller-Adams and Brad Hershbein of the W. E. Upjohn Institute, and Patrick Cooney of Poverty Solutions at the University of Michigan, for reviewing a draft of the report and providing comments. The authors also thank the Lumina Foundation for its support of this project. The views expressed in this publication are those of the authors and do not necessarily represent those of Lumina Foundation, its officers or employees.
Download Appendixes Here
Notes
- Appropriations are measured in terms of dollars per “full-time equivalent student” (FTE), to compare across institutions where many enroll part-time, and to capture changes in costs that institutions may encounter as enrollments rise and fall. When this report refers to averages per student, it means “per FTE student” unless otherwise indicated.
- Data from “Integrated Postsecondary Education Data System,” National Center for Education Statistics, retrieved from https://nces.ed.gov/ipeds/ on June 18, 2019. (Hereafter referred to in notes as IPEDS.) Since some community colleges offer a small number of bachelor’s degrees and are then categorized in IPEDS as public four-year institutions, we classified public institutions as community colleges if at least 90% of their credentials awarded in 2017 were sub-baccalaureate.
- “2018 State Expenditure Report: Fiscal Years 2016–18,” National Association of State Budget Officers, retrieved from https://www.nasbo.org/reports-data/state-expenditure-report on July 10, 2019.
- Michigan is, in fact, the state with the highest percentage of expenditures (41.9 percent) funded by the federal government. See “Michigan is more reliant on federal aid than any other state,” Michigan League for Public Policy, January 17, 2019.
- IPEDS, retrieved from https://nces.ed.gov/ipeds/ on July 30, 2019.
- Low-income is defined here as Pell Grant recipients. Data from IPEDS, retrieved from https://nces.ed.gov/ipeds/ on July 31, 2019.
- Although Michigan’s per-student funding at elementary and secondary schools is roughly equal across low- and high-income districts, low-income students generally need higher resources to reach the same educational outcomes. Michigan is in the middle of the pack for its distribution of resources: see Bruce D. Baker, Danielle Farrie, and David Sciarra, “Is School Funding Fair? A National Report Card,” Rutgers University Education Law Center, February 2018, https://edlawcenter.org/assets/files/pdfs/publications/Is_School_Funding_Fair_7th_Editi.pdf.
- A helpful guide on retention of low-income students is “Beyond Financial Aid: How Colleges Can Strengthen the Financial Stability of Low-Income Students and Improve Student Outcomes,” Lumina Foundation, March 2018, https://www.luminafoundation.org/files/resources/beyond-financial-aid-2018-03.pdf.
- Kyle Jen and Bill Bowerman, “Fiscal Year 2013–14 Higher Education Appropriations Report,” Table 1, House Fiscal Agency, September 2013, https://www.house.mi.gov/hfa/PDF/HigherEducation/hiedrept_fy14.pdf.
- IPEDS, retrieved from https://nces.ed.gov/ipeds/ on June 18, 2019.
- The figures $4,416 and $5,466 are appropriations per full-time equivalent (FTE) student. These are estimates rather than exact calculations because the exact number of black and white full-time equivalent students is not known. In our estimates, we use the racial distribution of students by headcount as an approximation of the FTE racial distribution.
- Data is for 2017–18 from “College Scorecard,” U.S. Department of Education, https://collegescorecard.ed.gov/.
- IPEDS, retrieved from https://nces.ed.gov/ipeds/ on June 18, 2019.
- “State Higher Education Finance: Fiscal Year 2018,” State Higher Education Executive Officers Association, Boulder, Colorado, 2019.
- “Sticker price” tuition and fees refers to the price before any aid is applied.
- IPEDS, retrieved from https://nces.ed.gov/ipeds/ on June 18, 2019.
- Mark Vallet, “Car insurance rates by state,” Insure.com, last updated April 16, 2019, at https://www.insure.com/car-insurance/car-insurance-rates.html. Michigan lawmakers have signed a law that is expected to lower these premiums, taking effect July 2020. For more information, see Kathleen Gray, “Michigan’s new deal on auto insurance premiums: 10 things to know,” Detroit Free Press, May 24, 2019, https://www.freep.com/story/news/politics/2019/05/24/explainer-michigan-auto-insurance-premiums/1221083001/.
- Cost of attendance is the sum of tuition, fees, books, housing, food, transportation, and other non-tuition costs.
- Exceptions include the Fostering Futures Scholarship, which helps pay for books, supplies, room, and board, and three Promise Zone scholarships—the Battle Creek Legacy Scholarship, the Muskegon Area Promise, and the Pontic Promise—which offer support for books. The Fostering Futures Scholarship is limited to current or former foster youth, and Promise Zone scholarships are only available to residents of those zones.
- IPEDS, retrieved from https://nces.ed.gov/ipeds/ on June 18, 2019.
- In response to concerns about bachelor’s program access in rural areas, Michigan in 2013 permitted community colleges to offer bachelor’s degrees in certain fields. However, the impact has been small: community colleges produced 0.1 percent of bachelor’s degrees awarded in the state in 2016–17. For more information, see Perry Zielak, “Four-Year Degree Offerings at Michigan Community Colleges,” House Fiscal Agency, memorandum delivered October 9, 2017, https://www.house.mi.gov/hfa/PDF/CommunityColleges/CC_FourYearDegrees_memo_Oct17.pdf.
- The chart below represents the average award received by first-time full-time students who received state and/or local aid. It accounts for inflation.
- “The Best Education System for Michigan’s Success: A Blueprint for Educating Michigan’s Residents to Build the Best Businesses, Win the Best Jobs, and Achieve the American Dream,” 21st Century Education Commission, February 28, 2017, https://www.fundmischools.org/wp-content/uploads/2017/03/Snyder-21st-Century-Education-Commission-Report-.pdf.
- “38th Annual Survey Report on State-Sponsored Student Financial Aid: 2006-07 Academic Year,” National Association of State Student Grant and Aid Programs, 2008, https://www.nassgapsurvey.com/survey_reports/2006-2007-38th.pdf.
- For more information, see Caitlin Esch and Gina Delvac, “How welfare money funds college scholarships,” Minnesota Public Radio, June 10, 2016, https://www.marketplace.org/2016/06/10/how-welfare-money-funds-college-scholarships/.
- See (1) Public Act 249, State of Michigan, 98the Legislature, Regular Session, 2016, 91, https://www.legislature.mi.gov/documents/2015-2016/publicact/pdf/2016-PA-0249.pdf, and (2) “48th Annual Survey Report on State-Sponsored Student Financial Aid: 2016–17 Academic Year,” National Association of State Student Grant and Aid Programs, 2018, https://www.nassgapsurvey.com/survey_reports/2016-2017-48th.pdf.
- “2017–18 Annual Report: Student Scholarships and Grants,” Student Financial Services Bureau, Michigan Department of Treasury, February 19, 2019, retrieved from https://www.michigan.gov/documents/mistudentaid/Annual_Report_2018_646564_7.pdf.
- Outside of these three programs, state grant aid is targeted toward specific populations, such as foster children and the children of veterans. Another program, Talent for Tomorrow, debuted last year but, if pending legislation is enacted, would be folded into the Michigan Reconnect program.
- This is an estimate rather than a precise number because no available data provides the number of resident undergraduate students at public and private nonprofit Michigan institutions. Using IPEDS data, we calculated the share of in-state students among all first-time first-year students and multiplied this share by the total headcount of undergraduate students, providing an estimate of resident undergraduate students. All public and private nonprofit institutions were included in this calculation; for-profit institutions were not included, as Michigan state grant aid is not provided to students attending for-profit institutions.
- To be eligible, the student must have received Medicaid coverage for twenty-four months within a three-year period, between age 9 and high school graduation.
- The percentage of public institution enrollees who are adults, defined as age 23 at the time of entry to college, has decreased from 26 percent in 2008 to 20 percent in 2017, per data from IPEDS. This is a critical concern for state degree attainment given that the flow of high school graduates is in decline. See “Table 219.32. Public high school graduates, by sex, race/ethnicity, and state or jurisdiction: 2012–13,” National Center for Education Statistics, January 2016, https://nces.ed.gov/programs/digest/d18/tables/dt18_219.32.asp?current=yes, and “Knocking at the College Door: Projections of High School Graduates,” Western Interstate Commission for Higher Education, 2016, www.wiche.edu/knocking
- For more information, see Peter Ruark, “State Financial Aid Leaves Adult Learners Behind,” Michigan League for Public Policy, March 2017, https://mlpp.org/wp-content/uploads/2017/03/state-financial-aid-leaves-adult-learners-behind.pdf. As a technical note, an older student could qualify for the Michigan Tuition Grant if they have never before filed the FAFSA before, as grant eligibility is based on one’s unmet need at the first instance of a FAFSA filing. However, anyone for whom this is the case would apply for aid without knowing whether they qualify for the Michigan Tuition Grant.
- Fifteen have been approved by the legislature, but eleven are operations. See “Michigan Promise Zone Designations,” Michigan Department of Treasury, n.d., https://www.michigan.gov/treasury/0,4679,7-121-1753_37613-213451–,00.html.
- Seven Promise Zone programs offer benefits beyond the legislatively-mandated minimum guarantee of community college tuition. The Kalamazoo Promise, which preceded and inspired the model for the Promise Zones, also provides support for tuition at bachelor’s programs.
- Analysis performed by the Michigan College Access Network, shared with the authors by Chuck Wilbur.
- For more details see “Michigan Indian Tuition Waiver: Frequently Asked Questions,” https://www.michigan.gov/documents/mdcr/FAQRevs4-1-2106_520018_7.pdf, and Kim Kozlowski, “Michigan underfunds Native American tuition program.” The Detroit News, August 14, 2015, https://www.detroitnews.com/story/news/local/michigan/2015/08/12/michigan-underfunds-native-american-tuition-program/31507127/.
- Bill Bowerman and Perry Zielak, “Public University Summary Data, Fiscal Years 2012–13 to 2016–17,” Michigan House of Representatives, House Fiscal Agency, 2019, https://www.house.mi.gov/hfa/PDF/HigherEducation/Higher_Ed_HEIDI_Summary_Report_fy12-13andfy16-17.pdf.
- Maxwell Evans, “Michigan universities hit with state shortfall for tuition waivers,” Lansing City Pulse, April 19, 2019, https://www.lansingcitypulse.com/stories/michigan-universities-hit-with-state-shortfall-for-tuition-waivers,12687.
- Specifically, first-time full-time undergraduate students.
- For further details see H.B. 4456, “The Michigan Reconnect Act,” introduced on April 16, 2019: https://www.legislature.mi.gov/documents/2019-2020/billintroduced/House/pdf/2019-HIB-4456.pdf.
- For further details see H.B. 4464, “The Michigan Opportunity Initiative Act,” introduced on April 16, 2019, https://www.legislature.mi.gov/documents/2019-2020/billintroduced/House/pdf/2019-HIB-4464.pdf.
- Figure 8 represents the average award received by first-time full-time students who received institutional aid. It accounts for inflation.
- Specifically, first-time full-time undergraduate students.
- Charlie Eaton, Sheisha Kulkarni, Robert Birgeneau, Henry Brady, and Michael Hout, “The Organizational Ecology of College Affordability: Research Activity, State Grant Aid Policies, and Student Debt at U.S. Public Universities,” Socius: Sociological Research for a Dynamic World 5 (2019): 1–19.
- The other three were Michigan State University, University of Michigan–Ann Arbor, and University of Michigan–Flint. See Kyle Jen, “Fiscal Focus: State Appropriations, Tuition, and Public University Operating Costs,” Michigan House of Representatives, House Fiscal Agency, 2013, https://www.house.mi.gov/hfa/PDF/HigherEducation/State_Appropriations_Tuition,and_Public_University_OperatingCosts.pdf.
- This is not to ignore or belittle the innovative work done through institutional aid. Some Michigan institutions have recently made headlines for their equity-oriented institutional aid, including the University of Michigan’s Go Blue Guarantee (https://admissions.umich.edu/costs-aid/michigan-residents) of free tuition for low-income students and Wayne State University’s Warrior Way Back (https://wayne.edu/warriorwayback/) debt forgiveness program for former students without degrees.
- The chart below represents the average award received by first-time full-time students who received any federal aid. It accounts for inflation.
- Specifically, first-time full-time undergraduate students.
- Based on the data by income brackets graphed above, a student whose family makes $30,000 has an expected net price somewhere between $8,305 and $10,796 at the median public university, which would be between 27.7 percent and 36.0 percent of income. A student whose family makes $110,000 has an expected net price somewhere between $16,711 and $18,247 at the median public university, which would be between 15.2 percent and 16.6 percent of income.
- Family income less than $30,000.
- Family income above $110,000.
- At the median private nonprofit four-year institution in Michigan, an in-state student whose family earns less than $30,000 see an average net price of $16,569, compared to $8,305 at the median public university. Data from “Integrated Postsecondary Education Data System,” National Center for Education Statistics, retrieved from https://nces.ed.gov/ipeds/.
- Data from IPEDS. The student total refers to headcount, not full-time equivalent.
- The vast majority of state governments do not provide funding for tribal colleges. See Chrstine Nelson and Joanna Frye, “Tribal College and University Funding,” American Council on Education, May 2016, accessible at https://www.acenet.edu/news-room/Documents/Tribal-College-and-University-Funding.pdf. \
- See“Median Wages by State,” Governing, https://www.governing.com/gov-data/wage-average-median-pay-data-for-states.html.
- “American Community Survey 2017 1-Year Estimates, Table S1701,” U.S. Census Bureau, retrieved on July 11, 2019, from American Fact Finder, https://factfinder.census.gov/faces/nav/jsf/pages/index.xhtml.
- The median black worker in Michigan saw their wages drop 24 percent between 1982 and 2012, compared to a 1 percent increase for the median white worker in Michigan. See Melissa Anders, “1982–2012: Michiganders’ purchasing power drops significantly, especially among black workers,” MLive, August 30, 2013, https://www.mlive.com/business/2013/08/michigan_median_wage_black_whi.html.
- Since 1979, median wages have only risen for those with a bachelor’s degree or higher. See Table 2 in “Real Wage Trends, 1979 to 2018,” Congressional Research Service, updated July 23, 2019, https://fas.org/sgp/crs/misc/R45090.pdf.
- In-district mandatory tuition and fees are shown for community colleges, and in-state mandatory tuition and fees are shown for public universities.
- Calculated from “Integrated Postsecondary Education Data System,” National Center for Education Statistics, retrieved from https://nces.ed.gov/ipeds/, and Table H08 of the 2017 American Community Survey 1-Year Estimates, and 1999 American Community Survey 1-Year Estimates.
- Washtenaw County is also home to the University of Michigan–Ann Arbor. Eastern Michigan University was selected for this analysis rather than University of Michigan–Ann Arbor due to its higher acceptance rate, as this analysis focuses on the affordability of the most accessible institution.
- Based on 2016–17 the average net price data in IPEDS for first-time full-time in-state students in the $75,000-$110,000 income bracket, which contains Washtenaw County’s median family income. County-level income data is from 2017 American Community Survey 1-Year Estimates, Table S1903, U.S. Census Bureau, retrieved from American Fact Finder on June 18, 2019.
- Wayne County is also home to the University of Michigan–Dearborn. Wayne State University was selected for this analysis rather than University of Michigan–Dearborn due to its higher acceptance rate, as this analysis focuses on the affordability of the most accessible institution.
- Based on 2016–17 the average net price data in IPEDS for first-time full-time in-state students in the $48,000-$75,000 income bracket, which contains Wayne County’s median family income. County-level income data is from 2017 American Community Survey 1-Year Estimates, Table S1903, U.S. Census Bureau, retrieved from American Fact Finder on June 18, 2019.
- Data pulled from the Michigan School Data website, reflecting outcomes for the high school class graduating in 2013–14.
- “Expected public university net price” refers to the median of public universities’ average net price for a given income bracket. Data from IPEDS.
- Based on 2016–17 average net price data in IPEDS for first-time full-time in-state students in the $30,000–$48,000 income bracket, which contains the median household income for single-race black households. Data on median household income by race from 2017 American Community Survey 2017 1-Year Estimates, Table S1903, U.S. Census Bureau, retrieved from American Fact Finder on June 18, 2019.
- Based on 2016–17 average net price data in IPEDS for first-time full-time in-state students in the $48,000–$75,000 income bracket, which contains the median household income for single-race white households. Data on median household income by race from 2017 American Community Survey 1-Year Estimates, Table S1903, U.S. Census Bureau, retrieved from American Fact Finder on June 18, 2019.
- Sector-level averages provided by the Center for Law and Social Policy (CLASP) based on their analysis for the report by Lauren Walizer, “When Financial Aid Falls Short New Data Reveal Students Face Thousands in Unmet Need,” CLASP, December 2018, https://www.clasp.org/sites/default/files/publications/2018/12/2018whenfinancialaidfallsshort.pdf. The original data source is the National Postsecondary Student Aid Survey for the 2015–16 academic year
- Low-income is defined here as 200 percent of the federal poverty level or less.
- National Postsecondary Student Aid Study (NPSAS) 2015–16, U.S. Department of Education, National Center for Education Statistics. Data analysis system available from nces.ed.gov/datalab.
- This includes public universities and private nonprofit four-years. It does not include for-profit institutions.
- “Student Debt and the Class of 2017,” The Institute for College Access and Success, College Insight, 2019, https://ticas.org/sites/default/files/pub_files/classof2017.pdf.
- The average loan debt for all students, including non-completers, was about $18,000 for both public and private nonprofit four-year students, according to College Scorecard data for pooled 2016 and 2017 cohorts, U.S. Department of Education data available at https://collegescorecard.ed.gov/data/.
- This percentage does not include community college students who transfer to a bachelor’s degree program before completing an associate’s degree.
- College Scorecard data for pooled 2009–10 and 2012–13 cohorts tracked through 2015–16. Completion rates are for students entering the institution but include completion at a transfer institution within the three-year or six-year timeframe. U.S. Department of Education, data available at https://collegescorecard.ed.gov/data/.
- See “Addressing the College Completion Gap Among Low-Income Students,” College for America, 2017, https://collegeforamerica.org/college-completion-low-income-students/.
- For examples of financial support provided to students after enrollment and outcomes for college completion, see Mark Schneider and Kim Clark, “Completion Reforms That Work: How Leading Colleges Are Improving the Attainment of High-Value Degrees,” Third Way, 2018, https://www.thirdway.org/report/completion-reforms-that-work-how-leading-college-are-improving-the-attainment-of-high-value-degrees.
- Quote by Doug Ross, senior advisor to the governor, at the June 20, 2019 joint hearing of the Senate Talent and Economic Development Committee and the Senate Economic and Small Business Development Budget Subcommittee.