
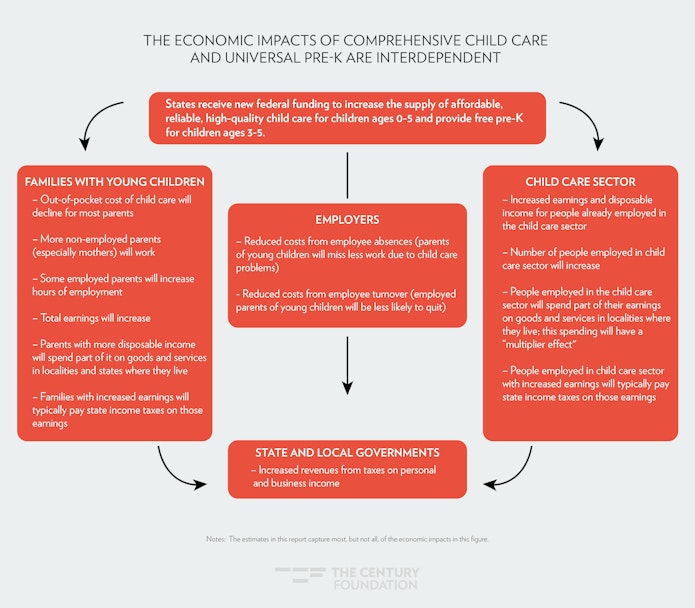
Comprehensive child care and early learning policy benefits everybody. From the benefits to the American economy and businesses, to the ways it improves healthy child development and educational outcomes, to the prospects for greater gender, racial, and economic equity, everyone in the United States has something to gain from a significant investment in these areas.
This report’s analysis reviews the specific ways the child care and universal pre-kindergarten (pre-K) policies that passed the House of Representatives as part of the Build Back Better Act in November 2021, and are still making their way through Congress, would generate economic activity in all fifty states and Washington, D.C. If implemented, the policies would have a tremendous positive impact on two generations of Americans—ensuring children have access to learning environments to give them a strong start in life, and supporting parents and other caregivers to pursue greater opportunities for themselves and their families. This report focuses on the shorter-term benefits to families and communities, but it is crucial to acknowledge that there are additional longer-term economic benefits for the children and communities impacted.
While the pandemic shone a spotlight on the crisis and made it worse, the decades-long failure of the U.S. government to invest in a comprehensive child care and pre-K system has long depressed economic growth in the United States. This report looks at the economic gains, by state, to families, businesses, and state governments that such an investment would provide: (1) $48 billion in increases to economic output from increased parental employment; (2) $60 billion in gains for businesses and state tax revenue from decreased child care-related disruptions; and (3) at least a $30 billion boost to the economy from the expansion of the child care sector and related indirect and induced job increases.1
Figure 1
Increased Parental Labor Force Participation and Earnings
When parents—especially mothers—lack affordable and stable child care options, there are serious consequences. The lack of affordable and reliable child care pushes mothers out of the labor force and reduces the hours they are able to work when they are in the labor force. This in turn causes interruptions to job and career advancement,2 including lost promotions and raises, lost opportunities to build new skills and expertise, and contributes to the motherhood earnings penalty.3 Over the lifecourse, it means lower retirement savings and higher poverty rates for mothers than for fathers as they age.4
Due to the intersecting impact of interpersonal discrimination and other forms of racism, Black and Latina mothers have faced even more acute challenges than their White counterparts, as have working-class5 mothers of all ethnicities and races when compared to upper-middle-class and higher-income mothers.6 These results have consequences for mothers, their children and families, and for the greater economic good.
If mothers of children under age 6 had the same employment rate as mothers of children ages 6 to 12, roughly 1.6 million more mothers would be employed.7 Similarly, if the maternal employment rate in the United States was as high as in other countries that guarantee affordable and reliable child care, many more mothers would be employed. For example, after Quebec implemented affordable universal child care in the 1990s, maternal employment rose sharply. If the United States had the same maternal labor force participation rate for mothers of young kids as Quebec, that would mean roughly 1.4 million more mothers of kids ages 0 to 2 in the labor force, and another roughly 800,000 more mothers of kids ages 3 to 5 in the labor force.8 In fact, research has shown that gains in women’s labor force participation is associated with higher gross domestic product.9 Conversely, national and state economic growth is slowed by women’s lower workforce participation, earnings, and tax revenues.
The pandemic exacerbated these challenges. It decreased the supply of child care options as programs shut down while increasing the costs of providing child care because of health and safety expenses and reduced enrollment. Prices for families rose as a result of those increased costs; at the same time, employment for many parents became more precarious as the pandemic wreaked havoc on sectors where mothers tended to be employed.10 Even if the pandemic and related disruptions ended tomorrow, the failure of the United States to build a child care and early learning system would continue to hinder maternal labor force participation.
Even if the pandemic and related disruptions ended tomorrow, the failure of the United States to build a child care and early learning system would continue to hinder maternal labor force participation.
Before the pandemic (at the end of 2019), 67 percent of prime-age mothers with children under age 6 were working. At the height of the pandemic in 2020, only 58 percent were.11 Mothers without bachelor’s degrees (often used as a proxy for working-class status) were especially hard-hit within this group; the share of these mothers who were employed fell by 22 percent, compared to a roughly 8 percent decline in employment among mothers with bachelor’s degrees.12 The child care relief funds enacted as part of the American Rescue Plan and previous pandemic relief packages helped to mitigate some of the challenges and stabilize many child care programs.13 That helped some mothers return to work, while others reduced hours, struggled to manage child care and work at the same time (especially if they were working from home)14 or simply patched together care from friends and family as best they could, since they could not afford to lose pay.15
Today, overall employment shares have largely returned16 to pre-pandemic levels. However, employment among prime age working-class17 mothers of children under age 6 remains below what it was in 2019, and the employment gap between mothers with and without bachelor’s degrees has grown by over 25 percent since then. Among those who work part-time, nearly a quarter of mothers without bachelor’s degrees cite child care issues as a reason for doing so, an almost 20 percent increase compared to 2019.18
What’s Possible with Legislation
The child care and universal pre-kindergarten (UPK) provisions in the House-passed Build Back Better Act (BBB) would lower child care costs for nine out of ten families with young children in the United States while improving the quality of the early education they receive, raising wages of poorly compensated child care workers, and covering the costs associated with higher quality care.19 Universal preschool for 3- and 4-year-olds will finally be available, and parents will have the choice to find the right program for their family in center-based, home-based, family-based, school-based, and Head Start programs. The programs build on federal–state partnerships, setting federal parameters while providing states with funding and flexibility to build the early childhood education system that families have long needed.
All of the costs of the program will be covered by the federal government for the first three years during the phase-in period. States will be able to immediately serve more children through child care funding—those in families with income up to 100 percent of state median income (SMI) in the first year, 125 percent SMI in the second, and 150 percent SMI in the third; and states can opt in to serving families up to 250 percent SMI if they are able. For pre-K, states can begin building out their programs in the first three years with 100 percent federal dollars and will receive significant pre-K dollars to serve their 3- and 4-year-olds (with no income cap) in the fourth year.
States will develop plans for full implementation by year four with stakeholder feedback to reach all eligible families. The policies will also invest in building out the supply of options—in homes, faith-based programs, centers, and, in the case of pre-K, schools, and more—so that families can find safe, nurturing care when and where they need it. That means that parents will have affordable, reliable, stable child care options to support their labor force participation. Since mothers are more likely than fathers to take responsibility for caring for children, employment gains from these policies are likely to be concentrated among mothers.20
Expected Economic Impact
While the bulk of the caregiving responsibility is on mothers, fathers are also impacted. This analysis found that the child care and UPK provisions could lead to roughly 3 million more parents—mostly mothers—entering the labor force or increasing their work hours nationally (about 1.1 million due to new entries and 2 million due to increased hours).21
The aggregate result of this is an estimated $48 billion annual increase in economic output from increased parental work across the United States.
The aggregate result of this is an estimated $48 billion annual increase in economic output from increased parental work across the United States. This does not take into account additional state tax revenue that will be raised by this increase, some of which is accounted for in the analysis in the next section.22
On a state-by-state basis, the estimated earnings increase among parents entering the workforce or increasing work hours ranges from around $70 million a year in Vermont and Wyoming to $1.8 billion in Illinois, $1.7 billion in Pennsylvania, $1.8 billion in New Jersey, and more than $2 billion in states with higher populations such as California ($6.7 billion), Florida ($2.4 billion), New York ($3.1 billion), and Texas ($4.5 billion). These income benefits would have a ripple effect, raising additional tax revenue and encouraging new spending in local economies. (See Table 1 and Map 1.)
Map 1
Table 1
|
Estimated Annual Earnings Increases among Parents Entering the Workforce or Increasing Work Hours Due to Proposed Child Care and Pre-K Policies |
|||||
|
Estimated Number of Parents Expected to Enter the Workforce or Increase Hours Due to Proposed Child Care and Pre-K Policies |
Estimated Annual Earnings Increase among Parents Entering the Workforce | Estimated Annual Earnings Increase among Parents Increasing Hours | Total Estimated Earnings Increase among Parents Entering the Workforce or Increasing Hours Due to Proposed Child Care and Pre-K Policies |
Estimated Annual Earnings Increase per Impacted Parent |
|
| National | 3,231,183 | $15,691,377,475 | $32,118,933,434 | $47,810,310,909 | $14,797 |
| Alabama | 46,165 | $219,155,291 | $348,443,920 | $567,599,211 | $12,295 |
| Alaska | 9,265 | $54,360,194 | $64,505,359 | $118,865,553 | $12,829 |
| Arizona | 75,806 | $371,130,732 | $646,964,145 | $1,018,094,877 | $13,430 |
| Arkansas | 31,164 | $112,364,725 | $259,924,802 | $372,289,527 | $11,946 |
| California | 391,270 | $2,597,365,427 | $4,157,141,502 | $6,754,506,929 | $17,263 |
| Colorado | 58,928 | $339,383,548 | $633,171,730 | $972,555,278 | $16,504 |
| Connecticut | 27,912 | $145,602,532 | $382,914,351 | $528,516,883 | $18,935 |
| Delaware | 8,285 | $31,015,242 | $72,256,212 | $103,271,454 | $12,466 |
| District of Columbia | 4,665 | $39,227,280 | $93,238,423 | $132,465,703 | $28,397 |
| Florida | 167,343 | $813,249,600 | $1,542,749,376 | $2,355,998,976 | $14,079 |
| Georgia | 102,778 | $441,270,421 | $800,477,032 | $1,241,747,453 | $12,082 |
| Hawaii | 12,907 | $48,781,340 | $133,144,666 | $181,926,006 | $14,095 |
| Idaho | 23,350 | $101,864,297 | $176,478,086 | $278,342,383 | $11,921 |
| Illinois | 117,519 | $511,385,620 | $1,279,981,733 | $1,791,367,353 | $15,243 |
| Indiana | 68,153 | $286,638,629 | $642,036,103 | $928,674,732 | $13,626 |
| Iowa | 33,179 | $79,161,994 | $356,809,082 | $435,971,076 | $13,140 |
| Kansas | 33,376 | $113,507,456 | $302,741,032 | $416,248,488 | $12,472 |
| Kentucky | 46,452 | $208,822,609 | $358,766,274 | $567,588,883 | $12,219 |
| Louisiana | 45,023 | $170,297,551 | $331,080,295 | $501,377,846 | $11,136 |
| Maine | 11,379 | $41,638,675 | $102,527,433 | $144,166,108 | $12,669 |
| Maryland | 57,841 | $239,487,080 | $738,052,067 | $977,539,147 | $16,901 |
| Massachusetts | 59,224 | $400,357,798 | $939,734,484 | $1,340,092,282 | $22,627 |
| Michigan | 91,250 | $313,850,933 | $840,417,566 | $1,154,268,499 | $12,650 |
| Minnesota | 62,184 | $229,143,761 | $748,053,051 | $977,196,812 | $15,715 |
| Mississippi | 26,866 | $116,416,632 | $182,689,895 | $299,106,527 | $11,133 |
| Missouri | 63,912 | $243,797,447 | $601,306,650 | $845,104,097 | $13,223 |
| Montana | 10,582 | $21,301,156 | $85,451,152 | $106,752,308 | $10,088 |
| Nebraska | 22,987 | $42,866,203 | $242,291,281 | $285,157,484 | $12,405 |
| Nevada | 32,520 | $150,881,100 | $298,210,743 | $449,091,843 | $13,810 |
| New Hampshire | 11,162 | $57,502,304 | $159,340,657 | $216,842,961 | $19,427 |
| New Jersey | 84,167 | $608,554,731 | $1,174,953,470 | $1,783,508,201 | $21,190 |
| New Mexico | 19,619 | $150,994,208 | $154,195,508 | $305,189,716 | $15,556 |
| New York | 175,060 | $1,048,228,996 | $2,125,204,773 | $3,173,433,769 | $18,128 |
| North Carolina | 102,138 | $437,331,773 | $846,744,249 | $1,284,076,022 | $12,572 |
| North Dakota | 9,535 | $34,525,790 | $115,944,730 | $150,470,520 | $15,782 |
| Ohio | 118,434 | $539,299,729 | $1,086,928,841 | $1,626,228,570 | $13,731 |
| Oklahoma | 44,599 | $182,457,325 | $349,286,189 | $531,743,514 | $11,923 |
| Oregon | 40,433 | $158,819,044 | $395,529,987 | $554,349,031 | $13,710 |
| Pennsylvania | 115,435 | $511,146,996 | $1,234,965,895 | $1,746,112,891 | $15,126 |
| Rhode Island | 9,036 | $29,642,890 | $107,003,356 | $136,646,246 | $15,123 |
| South Carolina | 48,508 | $233,968,644 | $407,651,058 | $641,619,702 | $13,227 |
| South Dakota | 9,994 | $31,566,029 | $91,230,849 | $122,796,878 | $12,287 |
| Tennessee | 68,737 | $310,627,561 | $557,902,912 | $868,530,473 | $12,636 |
| Texas | 332,523 | $1,628,130,856 | $2,862,404,794 | $4,490,535,650 | $13,504 |
| Utah | 47,236 | $190,056,832 | $400,612,616 | $590,669,448 | $12,505 |
| Vermont | 5,042 | $12,644,270 | $57,801,647 | $70,445,917 | $13,971 |
| Virginia | 82,416 | $317,512,063 | $913,796,023 | $1,231,308,086 | $14,940 |
| Washington | 85,460 | $401,826,290 | $921,253,978 | $1,323,080,268 | $15,482 |
| West Virginia | 15,439 | $95,880,534 | $93,898,579 | $189,779,113 | $12,292 |
| Wisconsin | 57,524 | $203,125,123 | $658,199,003 | $861,324,126 | $14,973 |
| Wyoming | 6,401 | $23,210,214 | $42,525,875 | $65,736,089 | $10,270 |
|
Source: Authors’ analysis of American Community Survey 1-year Sample, 2019 from Ruggles et al. IPUMS USA: Version 11.0 [dataset]. Minneapolis, MN: IPUMS, 2021, available at https://usa.ipums.org/usa/; GBA Strategies National Poll, 2018, available at https://cf.americanprogress.org/wp-content/uploads/2019/03/ECPP-ChildCare-Crisis-report-2.pdf. See Appendix for more details on sources and methodology. Notes: Parents include those with children under age 6 and household incomes at or below 250 percent state median income, and those with children ages 3 to 5 and household incomes above 250 percent state median income. Annual earnings increases are calculated in 2019 dollars. |
|||||
Support Businesses and Raise State Tax Revenues
A robust child care and early learning system gives parents the peace of mind that their children are in safe, healthy, and nurturing learning environments, so that they can minimize disruptions to their work day and increase their productivity. Since 13.4 percent of the workforce consists of parents of young children (ages 0 to 5), and an additional 11 percent of parents of school-age children (ages 6 to 12), how children are cared for while parents are working matters to businesses.23
A number of researchers have estimated the impacts of child care disruptions on businesses by looking at the related costs of turnover and absenteeism, as well as the effect on tax revenue. Long before the pandemic, child care disruptions were a major challenge for businesses.
For example, in 2019, the Council for a Strong America published a study that showed that the United States was losing $57 billion each year in economic productivity and revenue losses due to the lack of a child care system.24 Studies in a number of states—Louisiana, Maryland, Georgia, Washington, and Indiana—found states each lose over $1 billion annually in economic activity due to child care interruptions.25 In 2021, the U.S. Chamber of Commerce Foundation looked at five states and found child-care related economic losses ranging from $165 million in Alaska to $9.39 billion in Texas.
The pandemic made the child care-related disruptions to business much worse.26 From exposure-related child care and classroom shutdowns to parents needing to care for their quarantining children (the youngest for whom vaccines are not yet available), both parents and their employers have experienced a number of new challenges, made worse by the lack of a comprehensive system of care and early learning. Business leaders recognize child care is essential to keep them running. U.S. Chamber of Commerce Executive Vice President Neil Bradley noted, “For working parents, access to affordable child care is a key ingredient to be able to enter or return to the workforce… It was an issue pre-pandemic; it’s been exacerbated by the pandemic: closures in in-person schooling, child care centers that have closed, lack of available workers for child care centers that are open.”27
What’s Possible with Legislation
Creating a comprehensive child care and early learning system will help parents ensure their children have a safe, nurturing place to go while they are working. That peace of mind won’t end all child care-related disruptions to business—even without a pandemic, illness causes child care challenges—but it will substantially decrease them by expanding the array of affordable, reliable, stable child care options for parents. Business leaders are supporting these policies because they know how much the policies will support both their employees and their bottom lines. In December, ReadyNation, a national, bipartisan business network of more than 3,000 current and former executives, wrote to the Senate urging them “to pass a final version of the Build Back Better Act containing significant investments in our nation’s early care and learning system.”28
At the White House in January, Microsoft president Brad Smith pointed out just how important child care and early learning is for his business: “What we see is, we need to do more to help bring Americans back to work and one of the key ingredients that we see is that people can only come back to work if they have a way to take care of their children.” Cummins CEO Tom Linebarger, with close to 60,000 employees nationwide, made clear just how essential child care is to running a successful business: “It’s clearly an issue that needs to be addressed. We hear about it a lot—I get more notes about that than pretty much anything else I do.”29
In October 2021, Small Business for America’s Future conducted a national survey of of more than 1,000 small business owners across the nation, and found that the majority believe that the lack of affordable, high-quality child care for employees has had a negative impact on their business.30 Two-thirds of those surveyed support increases in federal funding for child care. Tiara Flynn, president and CEO of Sumnu Marketing in Nevada, put it this way: “The lack of affordable, high-quality child care directly impacts our ability to grow and sustain our businesses. …Small business owners can’t reach their full potential if their ability to operate and to hire and keep good employees is hamstrung by high child care costs.”31
Expected Economic Impact
While the policies advancing in Congress will not eliminate all child care disruptions, particularly in the midst of the pandemic, the policies proposed in BBB will reduce a significant amount of the absenteeism and turnover and raise tax revenue in most states. (See Table 2 and Map 2.) The authors’ analysis found that, nationwide, about $60 billion a year in losses to businesses could be mitigated by these policies.
map 2
Table 2
| Annual Business Losses and Tax Revenue Losses by Parents of Children Under 6 That Could be Mitigated by Child Care and Pre-K Investments | ||||||
| State | Turnover Cost to Employers | Absenteeism Cost to Employers | Direct Employer Costs Annually | Total Income Tax Revenue Losses Annually* | Total Losses Annually Due to Child Care Breakdowns | Annual Loss per Impacted Employee |
| National | $27,181,975,371 | $19,280,656,820 | $46,462,632,191 | $13,383,338,918 | $59,845,971,109 | $12,042 |
| Alabama | $263,692,068 | $283,915,745 | $547,607,813 | $284,299,292 | $831,907,105 | $11,387 |
| Alaska | $77,879,214 | $49,825,915 | $127,705,128 | – | $127,705,128 | $9,139 |
| Arizona | $557,777,239 | $546,431,650 | $1,104,208,890 | $245,423,517 | $1,349,632,407 | $9,798 |
| Arkansas | $129,990,433 | $215,747,280 | $345,737,713 | $215,875,701 | $561,613,414 | $11,927 |
| California | $2,779,812,543 | $3,171,800,513 | $5,951,613,056 | $2,413,071,768 | $8,364,684,824 | $13,326 |
| Colorado | $652,368,485 | $246,458,971 | $898,827,456 | $238,392,824 | $1,137,220,280 | $13,615 |
| Connecticut | $296,059,274 | $80,831,721 | $376,890,995 | $140,035,143 | $516,926,138 | $18,295 |
| Delaware | $61,859,480 | $38,375,222 | $100,234,703 | $44,339,965 | $144,574,668 | $13,031 |
| District of Columbia | $53,992,248 | $44,773,710 | $98,765,958 | $72,396,610 | $171,162,568 | $21,281 |
| Florida | $1,835,207,942 | $1,446,779,074 | $3,281,987,016 | – | $3,281,987,016 | $8,445 |
| Georgia | $892,124,319 | $276,855,576 | $1,168,979,895 | $571,868,168 | $1,740,848,063 | $14,472 |
| Hawaii | $126,722,811 | $78,466,643 | $205,189,454 | $130,586,408 | $335,775,862 | $15,480 |
| Idaho | $40,856,874 | $44,240,402 | $85,097,276 | $27,480,946 | $112,578,222 | $9,870 |
| Illinois | $1,190,687,552 | $770,325,511 | $1,961,013,063 | $753,291,391 | $2,714,304,454 | $13,794 |
| Indiana | $569,485,169 | $289,537,519 | $859,022,688 | $216,856,576 | $1,075,879,264 | $10,719 |
| Iowa | $85,795,038 | $197,116,443 | $282,911,481 | $97,124,454 | $380,035,935 | $10,019 |
| Kansas | $382,059,026 | $30,337,541 | $412,396,568 | $168,180,546 | $580,577,114 | $14,418 |
| Kentucky | $315,489,111 | $155,560,144 | $471,049,254 | $267,407,444 | $738,456,698 | $13,338 |
| Louisiana | $286,113,237 | $172,397,604 | $458,510,840 | $129,649,703 | $588,160,543 | $10,876 |
| Maine | $67,951,550 | $9,752,517 | $77,704,067 | $49,657,227 | $127,361,294 | $16,969 |
| Maryland | $398,877,242 | $494,420,659 | $893,297,902 | $214,780,550 | $1,108,078,452 | $11,698 |
| Massachusetts | $535,687,601 | $700,676,315 | $1,236,363,916 | $279,818,902 | $1,516,182,818 | $12,086 |
| Michigan | $1,072,819,076 | $454,975,917 | $1,527,794,992 | $497,952,746 | $2,025,747,738 | $12,203 |
| Minnesota | $301,172,471 | $282,159,261 | $583,331,732 | $220,627,432 | $803,959,164 | $12,415 |
| Mississippi | $112,059,507 | $66,775,415 | $178,834,922 | $79,246,538 | $258,081,460 | $10,829 |
| Missouri | $666,733,393 | $198,910,483 | $865,643,876 | $366,643,093 | $1,232,286,969 | $13,214 |
| Montana | $49,964,962 | $72,662,624 | $122,627,587 | $45,685,128 | $168,312,715 | $10,073 |
| Nebraska | $134,538,548 | $56,404,740 | $190,943,288 | $66,944,719 | $257,888,007 | $12,268 |
| Nevada | $352,235,405 | $114,246,444 | $466,481,849 | – | $466,481,849 | $8,955 |
| New Hampshire | $133,575,914 | $119,917,000 | $253,492,915 | $442,380 | $253,935,295 | $9,499 |
| New Jersey | $1,245,177,735 | $952,493,761 | $2,197,671,495 | $634,178,380 | $2,831,849,875 | $14,067 |
| New Mexico | $89,995,555 | $58,915,430 | $148,910,985 | $35,682,382 | $184,593,367 | $9,697 |
| New York | $1,418,377,884 | $1,199,550,839 | $2,617,928,723 | $802,848,786 | $3,420,777,509 | $13,455 |
| North Carolina | $1,324,051,008 | $494,177,606 | $1,818,228,614 | $888,541,368 | $2,706,769,982 | $13,952 |
| North Dakota | $65,298,053 | $70,327,667 | $135,625,720 | $12,100,573 | $147,726,293 | $9,347 |
| Ohio | $975,797,654 | $518,425,584 | $1,494,223,238 | $504,418,208 | $1,998,641,446 | $11,843 |
| Oklahoma | $499,617,669 | $325,208,449 | $824,826,118 | $280,006,348 | $1,104,832,466 | $11,056 |
| Oregon | $543,843,633 | $90,580,192 | $634,423,825 | $331,708,580 | $966,132,405 | $17,028 |
| Pennsylvania | $1,228,144,866 | $773,054,608 | $2,001,199,473 | $621,997,389 | $2,623,196,862 | $12,185 |
| Rhode Island | $117,077,782 | $74,187,596 | $191,265,378 | $38,705,705 | $229,971,083 | $10,816 |
| South Carolina | $318,226,468 | $210,483,672 | $528,710,140 | $303,891,758 | $832,601,898 | $13,335 |
| South Dakota | $26,582,433 | $51,110,290 | $77,692,723 | – | $77,692,723 | $7,108 |
| Tennessee | $395,371,225 | $436,462,324 | $831,833,549 | $3,840,163 | $835,673,712 | $8,033 |
| Texas | $2,315,247,066 | $1,836,153,114 | $4,151,400,180 | – | $4,151,400,180 | $8,842 |
| Utah | $254,155,717 | $246,745,985 | $500,901,702 | $193,051,262 | $693,952,964 | $12,365 |
| Vermont | $20,484,800 | $65,758,070 | $86,242,870 | $17,193,172 | $103,436,042 | $8,506 |
| Virginia | $573,249,895 | $529,049,021 | $1,102,298,915 | $574,677,957 | $1,676,976,872 | $14,278 |
| Washington | $837,355,963 | $240,086,613 | $1,077,442,576 | – | $1,077,442,576 | $11,900 |
| West Virginia | $75,386,598 | $35,303,352 | $110,689,951 | $58,586,473 | $169,276,424 | $12,932 |
| Wisconsin | $395,041,832 | $330,704,194 | $725,746,026 | $243,831,243 | $969,577,269 | $11,563 |
| Wyoming | $39,903,803 | $31,199,894 | $71,103,697 | – | $71,103,697 | $8,389 |
| Source: Authors’ analysis of turnover data from National Survey of Children’s Health, 2019; absentee data from Current Population Survey, 2019, available at Flood et al., Integrated Public Use Microdata Series, Current Population Survey: Version 9.0 [dataset]. Minneapolis, MN: IPUMS, 2021; and number of parents and income data from American Community Survey 1-year sample, 2019, available at Ruggles et al. IPUMS USA: Version 11.0 [dataset]. Minneapolis, MN: IPUMS, 2021. See Appendix for more details on sources and methodology. *States without data in this column do not have state income tax. | ||||||
Investing in the Child Care and Early Learning and Adjacent Sectors
Before the pandemic, the Center for American Progress (CAP) found that more than half of American families with young children lived in a child care desert—that is, in a Census tract where there are more than three times as many children as licensed child care slots. Two-thirds lived in infant and toddler child care deserts, since the need for more adults per child makes it more expensive to care for younger children, which also makes it more difficult to provide that type of care. CAP found that “licensed child care is more than three times as scarce for children ages 0 to 2 than it is for those ages 3 to 5.”
A major part of the problem is retaining a talented child care workforce. Early educators and child care staff—nearly all women and disproportionately Black and Latina women—are underpaid, and receive few to no benefits.
Figure 2
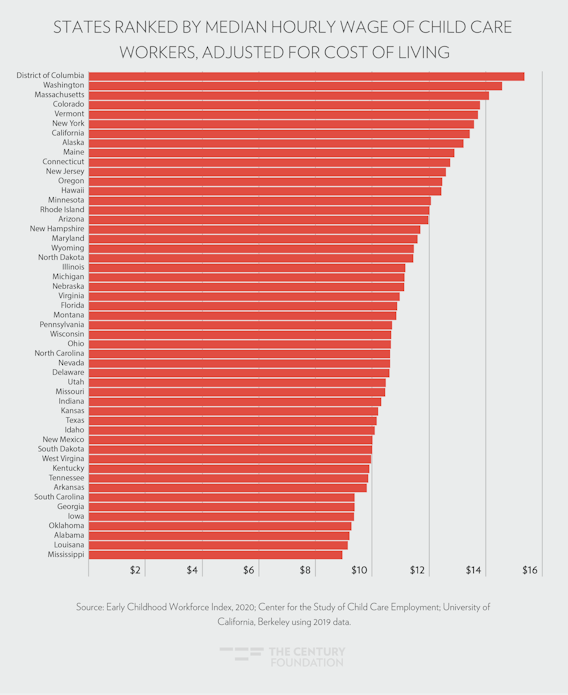
Meanwhile, parents are already paying as much as they can for child care, and often stretch their budgets in order to do so. Some parents forego formal care and rely on family, friends, and neighbors because they either can’t afford formal arrangements or can’t find care options that meet their needs. The pandemic exacerbated these challenges and caused major disruptions by closing down programs or reducing their hours and capacity due to safety concerns, increasing expenses, and decreasing enrollment.
Before the COVID-19 pandemic began, over 1 million people were officially counted by the Bureau of Labor Statistics (BLS) as part of the child care workforce. Today, as a result of pandemic-related challenges, the field is still missing more than 100,000 of those early educators.32 While many sectors are experiencing staffing shortages, the child care sector is both more limited in its available responses, and the shortages have a more significant ripple effect on the rest of the economy.
For example, the largest child-care provider in Minnesota, New Horizon Academy, has dozens of empty classrooms, but because of staffing shortages, many families still cannot secure a spot in one of the provider’s centers. According to the Star-Tribune, New Horizon is looking for 500 teachers and aides to work at their seventy child-care centers around the state.33 Similarly, in Texas, the Early Childhood Development Center in Grapevine-Colleyville ISD takes care of the youngest children of school district employees while they work, but staffing the center has been a major challenge.34 Skilled early educators are moving into jobs with higher wages, like fast food restaurants, leaving child care centers understaffed and teachers without care for their own children, impacting their ability to show up for their students.35
What’s Possible with Legislation
The COVID-19 relief investments Congress has authorized are helping, but they are only addressing immediate challenges.36 The longer-term provisions discussed here will address the underlying market failures by investing significant federal dollars in building a comprehensive child care and early learning system. The plan will address the disconnect between high prices for parents and low wages for educators by using federal funding to both lower costs for families and raise wages. Furthermore, the new funding from the child care provisions will support states to build the supply of child care in diverse settings that families need. This will require recruiting, retaining, and training new early educators and staff to meet the needs of families.
The bill ensures that all early educators and staff in both child care and pre-K are paid wages equivalent to elementary school teachers with similar credentials and experience, and at least a living wage.
With the policy in place, using primarily federal dollars, states will be able to raise early educator wages and hire more educators to meet immediate staffing shortages and fill the ongoing pre-pandemic gaps as well. Specifically, the bill ensures that all early educators and staff in both child care and pre-K are paid wages equivalent to elementary school teachers with similar credentials and experience, and at least a living wage. The plan also provides funding to support training and professional development across programs. For pre-K, similarly, by the fourth year, states must provide for salaries, and set schedules for salaries, for the staff of providers in the state preschool program that are equivalent to salaries of elementary school staff with similar credentials and experience; and furthermore, at a minimum, they must provide a living wage for all staff of such providers.
Expected Economic Impact
Research from Lenore Palladino found that the Build Back Better Act would create 657,000 new child care jobs and support 190,000 new indirect or induced jobs, for a total of 848,566 new jobs nationwide.37 “Indirect” jobs are jobs created in upstream industries that supply and support core activities in child care, while “induced” jobs are jobs that will be created as workers in directly and indirectly created jobs spend money on goods and services for themselves and their families. Taken together, the jobs created by investing in and expanding the child care sector could yield more than $30 billion in new labor income. In Florida, that will look like more than 66,000 new jobs and over $2.2 billion in additional earnings; in North Carolina and Ohio, it’s about 31,000 new jobs and over $1 billion in additional earnings for each state; and in Arizona, it’s about 22,000 new jobs and nearly $800 million in new income. This policy would also lead to increases in the child care workforce ranging from 16.1 percent in Alabama to 175.4 percent in Louisiana.
This analysis likely underestimates the total impact of this job growth, as it does not include the additional income tax from the expanded child care workforce and higher wages, which would yield additional benefits, which was outside of the scope of this analysis.
map 3
Table 3
|
Direct, Indirect, and Induced Job Creation Due to Child Care Workforce Investment |
|||||||
|
State |
Current Child Care Workforce | Direct Jobs Created | Indirect Jobs Created | Induced Jobs Created | Total Jobs Created | Total New Labor Income |
Percent Change in Child Care Workforce |
| National | 865,310 | 657,118 | 61,575 | 129,872 | 848,566 | $30,014,498,376 | 75.9% |
| Alabama | 9,550 | 1,541 | 138 | 255 | 1,934 | $54,000,299 | 16.1% |
| Alaska | 2,350 | 1,090 | 63 | 187 | 1,340 | $52,729,073 | 46.4% |
| Arizona | 16,160 | 17,104 | 1,889 | 3,575 | 22,568 | $776,521,223 | 105.8% |
| Arkansas | 8,970 | 8,837 | 695 | 1,273 | 10,805 | $318,748,410 | 98.5% |
| California | 91,230 | 45,670 | 4,117 | 11,710 | 61,498 | $3,026,175,650 | 50.1% |
| Colorado | 16,410 | 7,439 | 802 | 1,707 | 9,949 | $387,286,816 | 45.3% |
| Connecticut | 11,030 | 4,472 | 408 | 780 | 5,660 | $223,192,755 | 40.5% |
| Delaware | 2,550 | 1,957 | 171 | 301 | 2,428 | $86,607,500 | 76.7% |
| District of Columbia | 2,730 | 858 | 54 | 49 | 960 | $5,033,006 | 31.4% |
| Florida | 54,390 | 49,134 | 5,934 | 11,110 | 66,178 | $2,217,662,279 | 90.3% |
| Georgia | 24,410 | 34,678 | 3,556 | 6,201 | 44,435 | $1,355,942,954 | 142.1% |
| Hawaii | 2,870 | 1,740 | 146 | 394 | 2,281 | $99,277,842 | 60.6% |
| Idaho | 3,990 | 4,765 | 493 | 682 | 5,939 | $160,334,248 | 119.4% |
| Illinois | 35,140 | 22,741 | 1,944 | 5,321 | 30,006 | $1,183,345,673 | 64.7% |
| Indiana | 13,170 | 17,039 | 1,356 | 3,043 | 21,438 | $711,582,121 | 129.4% |
| Iowa | 10,870 | 9,115 | 637 | 1,190 | 10,941 | $292,215,256 | 83.9% |
| Kansas | 7,220 | 6,763 | 538 | 954 | 8,255 | $254,301,863 | 93.7% |
| Kentucky | 11,460 | 16,213 | 1,331 | 2,359 | 19,904 | $590,064,825 | 141.5% |
| Louisiana | 9,110 | 15,979 | 1,423 | 2,446 | 19,848 | $574,698,057 | 175.4% |
| Maine | 4,130 | 1,896 | 183 | 447 | 2,526 | $88,906,270 | 45.9% |
| Maryland | 15,930 | 9,278 | 765 | 1,534 | 11,576 | $427,381,584 | 58.2% |
| Massachusetts | 24,780 | 6,705 | 552 | 1,734 | 8,990 | $425,904,799 | 27.1% |
| Michigan | 24,060 | 22,943 | 2,230 | 4,889 | 30,063 | $1,045,820,409 | 95.4% |
| Minnesota | 17,760 | 9,054 | 779 | 2,130 | 11,964 | $461,711,439 | 51.0% |
| Mississippi | 7,580 | 12,137 | 964 | 1,600 | 14,700 | $394,151,977 | 160.1% |
| Missouri | 17,610 | 8,826 | 807 | 1,710 | 11,342 | $370,133,514 | 50.1% |
| Montana | 3,250 | 1,792 | 195 | 479 | 2,466 | $74,720,531 | 55.1% |
| Nebraska | 8,750 | 5,040 | 385 | 793 | 6,218 | $182,125,736 | 57.6% |
| Nevada | 4,830 | 6,656 | 674 | 948 | 8,278 | $260,128,414 | 137.8% |
| New Hampshire | 4,110 | 1,338 | 129 | 274 | 1,741 | $65,748,129 | 32.5% |
| New Jersey | 33,430 | 10,062 | 971 | 2,396 | 13,428 | $572,286,957 | 30.1% |
| New Mexico | 4,350 | 5,120 | 378 | 909 | 6,407 | $212,459,121 | 117.7% |
| New York | 70,910 | 24,905 | 1,956 | 5,321 | 32,182 | $1,482,619,301 | 35.1% |
| North Carolina | 29,590 | 24,259 | 2,536 | 4,467 | 31,262 | $1,028,389,619 | 82.0% |
| North Dakota | 4,280 | 1,929 | 130 | 234 | 2,293 | $63,824,255 | 45.1% |
| Ohio | 26,140 | 24,188 | 2,143 | 5,001 | 31,332 | $1,057,814,617 | 92.5% |
| Oklahoma | 11,800 | 7,955 | 720 | 1,199 | 9,873 | $286,026,573 | 67.4% |
| Oregon | 10,530 | 6,653 | 646 | 1,359 | 8,658 | $316,699,528 | 63.2% |
| Pennsylvania | 31,510 | 17,966 | 1,488 | 4,240 | 23,694 | $908,062,178 | 57.0% |
| Rhode Island | 2,860 | 1,538 | 152 | 283 | 1,972 | $72,981,338 | 53.8% |
| South Carolina | 9,840 | 14,600 | 1,503 | 2,236 | 18,339 | $539,110,386 | 148.4% |
| South Dakota | 3,740 | 2,682 | 196 | 367 | 3,244 | $90,254,442 | 71.7% |
| Tennessee | 16,370 | 19,611 | 1,774 | 3,342 | 24,727 | $811,854,001 | 119.8% |
| Texas | 77,090 | 94,688 | 9,417 | 19,754 | 123,859 | $4,274,436,854 | 122.8% |
| Utah | 6,910 | 8,709 | 956 | 1,520 | 11,185 | $336,818,891 | 126.0% |
| Vermont | 2,110 | 768 | 66 | 177 | 1,012 | $37,714,118 | 36.4% |
| Virginia | 21,480 | 13,457 | 1,227 | 2,492 | 17,176 | $616,965,806 | 62.7% |
| Washington | 16,380 | 9,300 | 759 | 1,668 | 11,727 | $486,300,075 | 56.8% |
| West Virginia | 3,400 | 5,384 | 333 | 673 | 6,390 | $184,250,568 | 158.4% |
| Wisconsin | 14,220 | 9,725 | 794 | 2,057 | 12,575 | $436,942,912 | 68.4% |
| Wyoming | 1,970 | 822 | 73 | 105 | 1,000 | $32,234,183 | 41.7% |
| Source: Calculations by Lenore Palladino, Chirag Lala at UMass Amherst. For additional methodological details, see “The Economic Effects of Investing in Quality Care Jobs and Paid Family and Medical Leave” (2021). Data from the Bureau of Labor Statistics’ Occupational Employment and Wage Statistics, 2020, available at https://www.bls.gov/oes/#data. See Appendix for more details on sources and methodology.
Notes: Direct jobs include jobs created in the child care industry itself. Indirect jobs include jobs created in upstream industries that supply and support core activities in child care. Induced jobs include jobs created due to increased consumer spending by those in directly and indirectly created jobs. |
|||||||
What This Means for How States Will Be Doing in the Fourth Year, So That They Can Meet the State Match
The child care and UPK provisions advancing in Congress are fully funded by federal dollars in the first three years, and include a state match of 10 percent in the fourth year.38 The considerable economic benefits that states will realize from implementing these provisions will far exceed this modest match requirement.
Additional and Long-Term Benefits
For those who are paying for it, the high cost of child care makes a significant dent in family budgets. For example, in California, infant care at a center comprises nearly 17 percent of the median married couple’s budget and half of the median single parent’s budget. In Arizona, it’s 13 percent of the married-couple’s budget and 39 percent of the single parent’s.39 The BBB policies are projected to reduce annual child care costs to families by about $5,000.40 These savings can translate into spending in the local economy and improving families’ economic stability.
Children benefit from their parents’ economic stability in both the short and long term. Making child care more affordable and supporting parental labor force participation has a positive impact on children. Family income impacts children’s cognitive development, physical health, and social and behavioral development because it is connected not only to parents’ ability to invest in goods and services that further child development, but also to the stress and anxiety parents can suffer when faced with financial difficulty, which in turn can have an adverse effect on their children.41
As noted above, additional state tax revenue from labor force participation increases are not fully accounted for in this report’s analysis. In addition, even states that do not levy a personal income tax stand to benefit from the economic gains associated with reduced child care disruptions. These states generate the bulk of their tax revenue by taxing sales, making sales volume an integral part of their budgets.42 Policies that improve child care access can affect sales volume indirectly through increases in business output and worker earnings, and the latter has potential spillover benefits in the form of additional taxable consumer spending.
Public investments in child care and pre-K improve parental economic stability in part by supporting increased earnings for mothers over the long term, as the bias and stigma attached to “working motherhood” decreases. Analysis by Jessica Milli and Julie Kashen found that the wage penalty associated with becoming a mother or adding new children to a family that cannot be explained by other factors, such as seniority or education, can be reduced by child care and preK investments. They found that a significant federal investment could reduce this “motherhood penalty”—a term coined by Dr. Michelle Budig and Dr. Paula England—by as much as one-third.
Finally, positive experiences in early education play an important role in setting children up for success in school, college, and beyond. The first five years are when a child’s brain develops fastest and when they learn key social, emotional, and academic skills, skills they’ll need during kindergarten and in order to have positive educational outcomes. Good child care and early learning programs have also been associated with other positive health benefits, including higher immunization, screening, and identification rates, as well as with improved mental health.
Conclusion
The policies proposed in the BBB legislation stand to benefit state economies in a number of important ways. Access to affordable and reliable child care and early education will enable parents to increase their workforce participation and thus their earnings. Nationwide, annual parental earnings could grow by over $47 billion. Increased parental earnings are also likely to result in additional state sales tax revenue, to the extent that non-child care spending rises proportionately with parental incomes.
Employers will also benefit from reduced care-related turnover and absenteeism. Total annual business losses due to care disruptions among parents of young children currently top $46 billion, while increased tax revenue is more than $13 billion. In Texas, which bills itself as a “business-friendly” state, child-care issues result in annual corporate losses of nearly $4.2 billion. By shoring up care infrastructure, the policies proposed in BBB will free up money that businesses would have otherwise been forced to spend mitigating care-related losses. This will allow businesses to instead use that money for more economically productive—and state tax-generating—activities.
All of these outcomes depend on retaining talented early educators and staff in the child care industry, in which investment will be economically fruitful in its own right. The BBB proposals would directly create almost 650,000 new jobs in the child care industry itself, along with just under 200,000 new indirect and induced jobs in other industries. Nationwide, these new jobs will result in over $30 billion in additional earnings.
The child care and UPK policies being considered in Congress will support children’s healthy development, family economic security, and gender and racial equity. This report shows that they are also essential to helping state economies grow and prosper.
The authors would like to thank Dean Baker, Eileen Appelbaum, Alix Gould-Werth, Sam Abbott, Jessica Milli, Lenore Palladino, Elliot Haspel, Stephanie Schmit, and Albert Wat for their feedback and contributions.
Appendix: Methodology and Sources
Parental Labor Force Participation and Earnings Increases
Parental labor market participation is calculated using the 2019 American Community Survey 1-year Sample. We use polling data from the Center for American Progress (CAP)43 on parents’ labor market decisions to estimate the proportion of parents who would join the labor force (for those not currently in the labor force) or increase their hours (either by going from part-time to full-time or by working additional full-time hours) if they had access to reliable child care. This survey is well-suited to our analysis because it explicitly asks parents how they might alter their labor force status or work hours in response to child care availability, rather than only asking about their current or past work situations. According to the CAP poll, 51 percent of homemaker parents with children under 18 report that they would want to secure paid work if reliable and affordable child care were available; 32 and 34 percent of those working part-time and full-time, respectively, would want to work more hours.44 We assume that an equivalent share of parents with children under 6 would opt to change their labor force status or increase their work hours.
To reflect the parameters of the child care and preK policies under consideration, we assume a full take-up for parents of children under 6 with family income under 250 percent of state median income (SMI) and parents with preschoolers whose income is above 250 percent of SMI. We alternately assume varying take-up rates for parents with different levels of family income relative to their SMI. For parents with children under age 6 with family incomes less than 100 percent of SMI, family incomes between 100 and 250 percent of SMI, and parents with children aged 3 to 5 with income above 250 percent of SMI, we set the take-up rates at 70 percent, 60 percent, and 50 percent, respectively.45 Under these assumptions, the number of parents who might experience an increase in earnings as a result of either labor market entry or working more hours is nearly 1.3 million.
To estimate what their earnings might be if these parents were employed or worked more hours, we use a Heckman two-step sample selection process to reduce the possible sample selection issue that parents who are more likely to work are more likely to earn more. The approach we apply in this analysis follows Budig, Misra, and Boeckmann,46 as we first estimate the likelihood of employment as a function of one’s marital status, age, education level, race/ethnicity, non-earnings income, occupation type (of last reported job they held), number of children under the age of 6, and state-fixed effects.
We then use the resulting estimation to construct an inverse Mills ratio, which we then include in the main regression analysis to correct for sample selection bias. The number of parents who might experience an increase in earnings as a result of either labor market entry or working more hours is approximately 3 million under a full take-up scenario and 1.3 million under varying program take-up rates for parents with different levels of family income to their state median income.47 We compare these parents’ estimated adjusted earnings to their current earnings to estimate the average increase in earnings (only for those experiencing an increase), and we add up these earnings increases for all mothers to estimate the policy’s aggregate effect on earnings.
As a sensitivity check, we apply our algorithm to calculate the number of parents (mostly mothers) with children under 4 with family income less than 200 percent and 300 percent of the federal poverty guideline who may be newly employed, at roughly 250,000 and 401,000, respectively. Despite varying assumptions, this is more or less consistent with the estimates from the ASPE,48 which reported about 260,000 to 420,000 mothers might expect to enter the labor force. We also calculate that slightly over 1 million parents with children under 13 with family income less than 75 percent of the state median income who might expect to enter the labor force, which is close to the lower bound estimate in Chaudry and Hamm’s report.49 It is worth noting that besides labor market entry, we also consider parents who are part-time or full-time workers wanting more hours.
Child Care-Related Turnover and Absentee Costs for Businesses and Associated Tax Loss
To estimate the state’s business loss, we followed an approach similar to that adopted in the U.S. Chamber of Commerce Foundation’s report.50 We first estimate turnover cost by taking a product of average salary for working parents in each state and state-specific number of parents who had to quit jobs or not take jobs due to child care issues. To arrive at the total cost to employers due to parents’ turnover, we then apply the cost of turnover, 21 percent, from Boushey and Glynn’s report,51 to these parents’ annual average salary. Data on parents’ salary and number of parents come from the 2019 American Community Survey.52 We take the proportion of parents leaving jobs or not taking jobs as a result of child care problems from the 2019 National Survey of Children’s Health data.53 In addition to the turnover cost, we also consider absenteeism cost to employers by considering average salary and the average revenue, which captures the costs and lost productivity when a parent is absent from work for child care duties. We take the proportion of parents absent from work due to child care issues from the 2019 monthly Current Population Survey data.54 We assume they usually miss an eight-hour work shift and on average, and that parents miss nine workdays per year nationwide.55 We use the average revenue per employee of $133,800 per year as a benchmark.56 Therefore, the state’s business loss is a sum of business loss and absenteeism cost the employers incur.
To calculate a state’s loss in income tax revenue, we again use the Heckman two-step model (see above) to estimate the predicted earnings for those who are not working or work part-time. We use the new estimated adjusted earnings for these parents, coupled with information about their tax filing status, number of children, age of children, other income components, and state of residence, in a NBER TAXSIM 32 simulation. We then calculate the average state tax each group would have to pay if they were working or worked more hours relative to the observed tax payment.
New Child Care Jobs, Higher Pay for Child Care Workers, and Multiplier Effects
Analysis by Lenore Palladino and colleagues estimated the number of child care and related jobs that could be created as a result of the new policies. They use a simulation with an assumed budget cap of $400 billion, to look at a wage increase to at least $15/hour for the lowest 10 percent of workers in the child care workforce, scaling up from there, and create new jobs in the child care sector. They also assume spillover job effects on other sectors and services. They start with a baseline of 865,30057 jobs, which reflects the number in May 2020. See this report for more details.58
Notes
- The increases to economic output from increased parental employment and the gains in business revenue from decreased child care-related disruptions both incorporate aspects of parental earnings, which means there is overlap between these two numbers. As a result, aggregating these would be a likely overestimate of the total economic benefits.
- Cristina Novoa and Steven Jessen-Howard, “The Child Care Crisis Causes Job Disruptions for More Than 2 Million Parents Each Year,” Center for American Progress, February 18 2020, available at https://www.americanprogress.org/issues/early-childhood/news/2020/02/18/480554/child-care-crisis-causes-job-disruptions-2-million-parents-year/.
- Julie Kashen and Jessica Milli, “ The Build Back Better Act Would Reduce the Motherhood Penalty,” The Century Foundation, October 8, 2021. https://tcf.org/content/report/build-back-better-plan-reduce-motherhood-penalty/
- Robert Paul Hartley, Ajay Chaudry, Melissa Boteach, Estelle Mitchell, and Kathryn Menefee, “A Lifetime’s Worth Of Benefits: The Effects of Affordable, High-quality Child Care on Family Income, the Gender Earnings Gap, and Women’s Retirement Security,” National Women’s Law Center and Center on Poverty & Social Policy, April 2021, https://nwlc.org/wp-content/uploads/2021/04/A-Lifetimes-Worth-of-Benefits-_FD.pdf
- There is no single “official” definition of “working class”. We use it here to refer to the diverse group of working-age people who typically do not have a four-year college degree; work, have worked, or will work in jobs that are closely supervised and provide them with little control over the pace or content of their work; and are generally poorly compensated compared to managerial and supervisory workers. Later, we use “working-class” to refer specifically to those without bachelor’s degrees; for additional details, see Tamara Draut, “Understanding the Working Class”, April 2018, https://www.demos.org/research/understanding-working-class. Although “working class” is sometimes used in the media and politics to refer to the “white working class”, by any reasonable definition, working-class people in the United States are disproportionately Black and Latino/a.
- Cristina Novoa, “How Child Care Disruptions Hurt Parents of Color Most,” Center for American Progress, June 29, 2020, https://www.americanprogress.org/article/child-care-disruptions-hurt-parents-color/
- Authors’ calculation using Current Population Survey, Basic Monthly Sample (2019).
- Authors’ calculation using Current Population Survey and https://www150.statcan.gc.ca/n1/pub/75-006-x/2018001/article/54976-eng.htm.
- Ozlem Tasseven, “The Relationship Between Economic Development and Female Labor Force Participation Rate: A Panel Data Analysis,” Global Financial Crisis and Its Ramifications on Capital Markets pp 555-568, February 2, 2017.
- Simon Workman, “The True Cost of Providing Safe Child Care During the Coronavirus Pandemic,” Center for American Progress, September 3, 2020
- Authors’ calculations using the Current Population Survey Basic Monthly Samples, 2019-2020.
- Ibid.
- National Association for the Education of Young Children (NAEYC), “Saved but not Solved: America’s Economy Needs Congress to Fund Child Care,” February 2022. https://www.naeyc.org/sites/default/files/wysiwyg/user-98/naeyc_ece_field_survey_february2022.pdf
- Lauren Bauer, Sara Estep, and Winnie Yee, “Time Waited for No Mom in 2020,” Brookings, July 22, 2021, https://www.brookings.edu/blog/up-front/2021/07/22/time-waited-for-no-mom-in-2020/
- RAPID-EC, “Mothers of Young Children Speak of Work During the Pandemic,” Center for Translational Neuroscience, University of Oregon, May 2021, https://static1.squarespace.com/static/5e7cf2f62c45da32f3c6065e/t/6092f250b28c0b51cfa2b483/1620243025089/Mothers-and-Work-Factsheet-210505.pdf
- Based on authors’ analysis of Current Population Survey Basic Monthly data through the final quarter (October-December) of 2021.
- While “working-class” can be defined in a variety of ways (see earlier note), in this case we use “working-class” to refer to those without bachelor’s degrees. More details on the rationale for this can be found in Tamara Draut, “Understanding the Working Class”, April 2018, https://www.demos.org/research/understanding-working-class.
- Authors’ calculations using the Current Population Survey Basic Monthly Samples, 2019-2021.
- Charlie Joughin, “Details of the Child Care & Pre-K Proposal in the Build Back Better Framework,” First Five Years Fund, October 28, 2021. https://www.ffyf.org/details-of-the-child-care-pre-k-proposal-in-the-build-back-better-framework/
- Sara Raley, Suzanne M. Bianchi, and Wendy Wang, “When Do Fathers Care? Mothers’ Economic Contribution and Fathers’ Involvement in Child Care,” American Journal of Sociology Volume 117, Number 5, March 2012
- See methodology section for additional details on assumptions re: take-up rates.
- When parents leave the workforce due to child care challenges, or reduce their work hours, states do not collect income taxes, or collect less in income taxes, from those individuals. In addition, the combination of reduced income for some families and high child care expenses for others causes parents to reduce their spending, leading to a decrease in sales tax revenue. The business disruptions analysis incorporates state tax revenue, so we did not account for it in this section, as there is likely significant overlap in the data.
- Authors’ analysis of Current Population Survey, Basic Monthly Sample, for Quarter 4 of 2021. Categories are mutually exclusive; parents are grouped by the age of their youngest child.
- Sandra Bishop-Josef, Ph.D., Chris Beakey, Sara Watson, Ph.D., and Tom Garrett, “Want to Grow the Economy: Fix the Child Care Crisis,” Council for a Strong America and Ready Nation, January 2019. https://strongnation.s3.amazonaws.com/documents/602/83bb2275-ce07-4d74-bcee-ff6178daf6bd.pdf?1547054862&inline;%20filename=%22Want%20to%20Grow%20the%20Economy?%20Fix%20the%20Child%20Care%20Crisis.pdf%22
- U.S. Chamber of Commerce Foundation, “Untapped Potential: Economic Impact of Childcare Breakdowns on U.S. States,” February 28, 2020, https://www.uschamberfoundation.org/reports/untapped-potential-economic-impact-childcare-breakdowns-us-states
- U.S. Chamber of Commerce, “Piecing Together Solutions: The Importance of Childcare to U.S. Families and Businesses,” The Importance of Childcare, Vol. 6, December 2020; https://www.uschamberfoundation.org/sites/default/files/EarlyEd_Minis_Report6_121420_Final.pdf
- Cody Uhing, “U.S. Chamber of Commerce Calls for Greater Support and Investments for Child Care to Spur Economic Recovery,” First Five Years Fund, June 3, 2021. https://www.ffyf.org/u-s-chamber-of-commerce-calls-for-greater-support-and-investments-for-child-care-to-spur-economic-recovery/
- ReadyNation, “Letter to U.S. Senate: Build Back Better Early Childhood Provisions,” December 15, 2021. https://www.strongnation.org/articles/1800-letter-to-u-s-senate-build-back-better-early-childhood-provisions
- “Remarks by President Biden at Build Back Better CEO Roundtable,” The White House, January 26, 2022. https://www.whitehouse.gov/briefing-room/speeches-remarks/2022/01/26/remarks-by-president-biden-at-build-back-better-ceo-roundtable/
- Small Business for America’s Future, “National Small Business Perspectives on Child Care,” September 28, 2021. https://irp.cdn-website.com/b4559992/files/uploaded/SBAF_National%20Child%20Care%20Survey%20Report.pdf
- Small Business for America’s Future. September 28, 2021.
- U.S. Bureau of Labor Statistics, “Data Retrieval: Employment, Hours, and Earnings (CES), Table B.1: Employees on nonfarm payrolls by industry sector and selected industry detail,” U.S. Department of Labor, Retrieved February 2022, https://www.bls.gov/webapps/legacy/cesbtab1.htm
- Kavita Kumar, “Minnesota’s child-care providers face staff shortages, rising costs,” Star Tribune, January 22, 2022
- Wayne Carter, “Childcare Worker Shortage Could Make Teacher Shortage Worse,” Grapevine Colleyville ISD, January 31, 2022.
- Jason DeParle, “When Child Care Costs Twice as Much as the Mortgage,” New York Times, October 9, 2021, https://www.nytimes.com/2021/10/09/us/politics/child-care-costs-wages-legislation.html
- NAEYC, February 2022
- This analysis was conducted using data from May 2020. With updated child care jobs numbers, the total would likely be even higher.
- For child care, the match stays at 10 percent. For UPK, the match slowly rises to 40% by the final year.
- Child Care Aware of America, “Appendices: Demanding Change: Repairing Our Child Care System,” February 2022. https://info.childcareaware.org/hubfs/Demanding%20Change%20Appendices.pdf?utm_campaign=Budget%20Reconciliation%20Fall%202021&utm_source=website&utm_content=22_demandingchange_append
- Rasheed Malik, “The Build Back Better Act Would Greatly Lower Families’ Child Care Costs,” Center for American Progress, September 22, 2021, https://www.americanprogress.org/article/build-back-better-act-greatly-lower-families-child-care-costs/
- Kerris Cooper and Kitty Stewart, “Money Matters: Does Money Affect Children’s Outcomes? A Systematic Review,” Joseph Rowntree Foundation, October 2013. https://sticerd.lse.ac.uk/dps/case/cr/casereport80.pdf
- In Nevada, for example, which has no personal income tax, just under 15 percent of families with a child under five reported quitting a job or substantially changing their work patterns due to problems with child care. Similar shares of families reported major work disruptions due to child care problems in other states with no personal income tax: 12 percent in Texas and 13.3 percent in Florida, for example. High costs and ongoing closures have left parents in these states scrambling to arrange child care, and missing work when they can’t. Comprehensive child care and UPK policy will help parents get back to work, save them money on child care expenses, and ensure they have resources to spend in their local economies.
- GBA Strategies National Poll, 2018, available at https://cf.americanprogress.org/wp-content/uploads/2019/03/ECPP-ChildCare-Crisis-report-2.pdf; also available at https://www.americanprogress.org/article/affordable-child-care-early-learning-families/
- Leila Schochet, “The Child Care Crisis Is Keeping Women Out of the Workforce,” Center for American Progress, March 28, 2019. https://www.americanprogress.org/article/child-care-crisis-keeping-women-workforce/
- Julie Kashen, and Jessica Milli. “The Build Back Better Plan Would Reduce the Motherhood Penalty”. October 2021. https://tcf.org/content/report/build-back-better-plan-reduce-motherhood-penalty/
- Michelle Budig, Joya Misra, and Irene Boeckmann. “Work–Family Policy Trade-Offs for Mothers? Unpacking the Cross-National Variation in Motherhood Earnings Penalties” (2015).
- For those with income less than 100% of SMI, those with income between 100 to 250% of SMI, and parents with children aged 3 to 5 with income above 250% of SMI, we set the take-up rates at 70%, 60%, and 50%, respectively.
- ASPE Issue Brief. “A policy to provide child care access for all working families: Effects on mothers’ employment and caseload.” (2017) https://aspe.hhs.gov/sites/default/files/migrated_legacy_files//171936/ChildCareBrief.pdf
- Ajay Chaudry and Katie Hamm. “The Child Care for Working Families Act Will Boost Employment and Create Jobs.” (2017) https://cdn.americanprogress.org/content/uploads/2017/12/06070052/ChildCareWorkforce-brief.pdf
- US Chamber of Commerce Foundation. “How childcare impacts Arizona’s workforce productivity and the state economy”. (2021) https://www.uschamberfoundation.org/sites/default/files/EarlyEd_ARIZONA_2021_DIGITAL.pdf
- Heather Boushey and Sarah Jane Glynn. “There Are Significant Business Costs to Replacing Employees” (2012). https://www.americanprogress.org/article/there-are-significant-business-costs-to-replacing-employees/
- Steven Ruggles, Sarah Flood, Sophia Foster, Ronald Goeken, Jose Pacas, Megan Schouweiler and Matthew Sobek. IPUMS USA: Version 11.0 [dataset]. Minneapolis, MN: IPUMS, 2021.
- https://www.childhealthdata.org/learn-about-the-nsch/NSCH
- Sarah Flood, Miriam King, Renae Rodgers, Steven Ruggles, J. Robert Warren and Michael Westberry. Integrated Public Use Microdata Series, Current Population Survey: Version 9.0 [dataset]. Minneapolis, MN: IPUMS, 2021. https://doi.org/10.18128/D030.V9.0
- Early Care & Learning Council. “Why Should Employers Care? Relationship Between Productivity and Working Parents,” (2014). https://childcarecouncil.com/wp-content/uploads/2014/07/Why-Should-Employers-Care-ECLC.pdf.
- It is calculated based on 2019 GDP and approximate number of workers in the US.
- The child care workers they consider only include preschool teachers (except special education), and child care workers. Data from https://www.bls.gov/oes/#data
- Lenore Palladino and Chirag Lala. “The Economic Effects of Investing in Quality Care Jobs and Paid Family and Medical Leave.” (2021). https://peri.umass.edu/component/k2/item/1465-the-economic-effects-of-investing-in-quality-care-jobs-and-paid-family-and-medical-leave