
MomsRising member Deborah Purce and her husband live in Seattle with their three children.1 At the height of the COVID-19 pandemic, their child care program closed for several months and Deborah had to find a way to manage her job while caring for her children, since her husband’s essential health care job did not have any flexibility. Five weeks of emergency paid leave helped. When she gave birth to her third child earlier this year, Washington State’s paid family and medical leave program provided sixteen weeks of paid maternity leave, replacing about 75 percent of her wages. She recently transitioned back to her prior job in a part-time position—with a lower income—because the cost of infant care is so high and she had exhausted her paid leave. Like so many families, the lack of affordable child care options, especially for young children, put Deborah and her husband in the position to choose between their finances and their family.
Deborah’s story is familiar to moms across the nation (although the majority of moms still don’t have access to paid family and medical leave). The United States claims to revere motherhood and yet continues to force impossible choices on mothers. Today, 1.2 million fewer mothers of school-age children are in the workforce than before the COVID-19 pandemic due to a combination of school and child care closures and reductions in child care capacity and hours, and the ways in which the pandemic wreaked havoc on sectors where mothers tend to be employed.2 Those mothers are likely falling behind without that needed income, and studies have shown it may be hard for them to get back to where they started.3 Their retirement security and savings, if they have any, are dwindling. Meanwhile, national and state economic growth is slowed by women’s lower workforce participation, earnings, and tax revenues.4
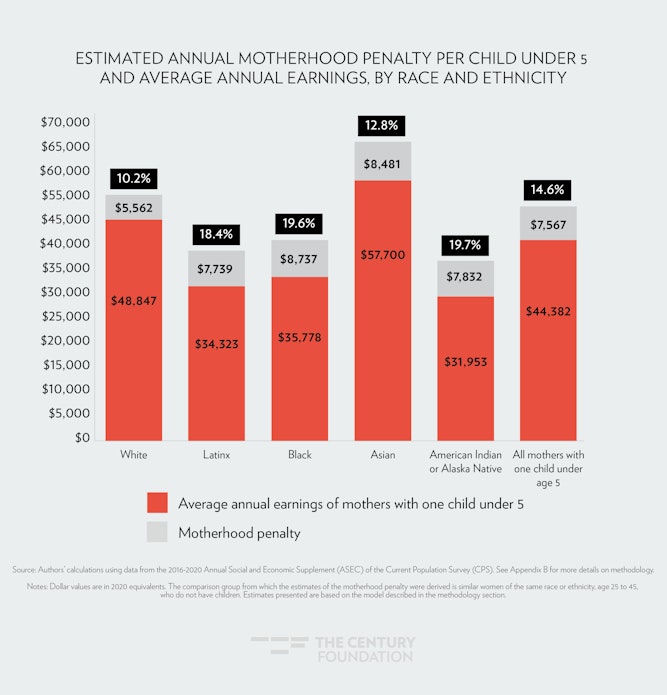
The “motherhood penalty”—a term coined by Dr. Michelle Budig and Dr. Paula England5—is a wage penalty associated with becoming a mother or adding new children to a family that cannot be explained by other factors, such as seniority or education. It “estimates how much less women earn for each additional child they have” than similar women without children.6 This analysis builds on Dr. Budig’s work and finds that, on average, the current motherhood penalty for a working mother is 15 percent of income per child under age 5.7 For Black and Native American women, the motherhood penalty is 20 percent—nearly twice that for white women (10.2 percent). For Latinx women it’s 18 percent and for Asian women it’s 13 percent.8 It should be noted that previous analyses of the motherhood penalty have found smaller penalties for women of color than for white women, and suggest that racial discrimination, occupational segregation, and other factors are generally more significant drivers of racial income inequality. The difference is likely due to this analysis using cross-sectional data, and previous studies relying on longitudinal data.9
FIGURE 1
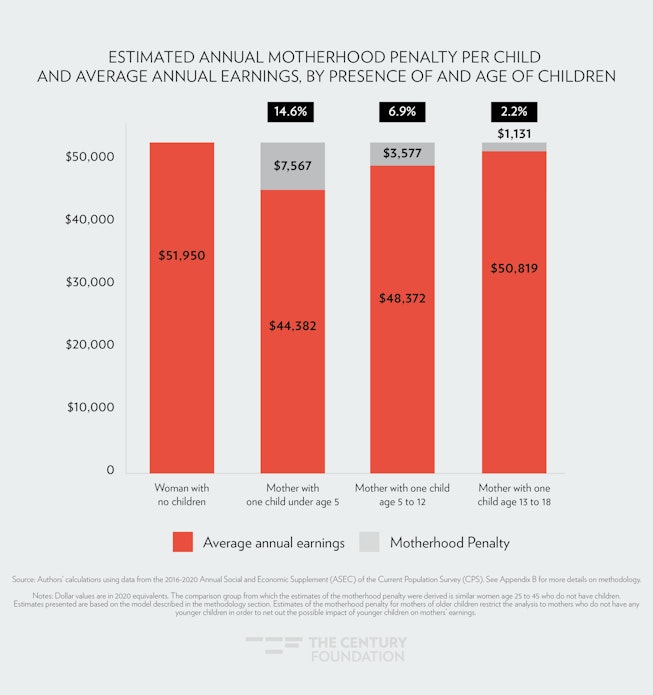
The analysis finds that the motherhood penalty persists, even as children grow older, but that it is highest when children are youngest (under age 5), and declines as children age and become more self-sufficient. Parents are more likely to leave work or reduce their work hours and thus their earnings when their children are youngest because that is when the cost of child care is highest and high quality options are most difficult to find. Prices range from $10,000 a year in Ohio to $20,000 in Massachusetts for center-based infant care or $8,000 a year in Georgia to more than $23,000 in Washington, D.C. for toddler care at a center.10
FIGURE 2
Child care is also the least available for the youngest children. While 51 percent of American families with young children live in a child care desert (a census tract where there are more than three times as many children as licensed child care slots), two-thirds live in infant and toddler child care deserts.11 The Center for American Progress (CAP) found that “licensed child care is more than three times as scarce for children ages 0 to 2 than it is for those ages 3 to 5.”12 The analysis in this report looks at how the child care and pre-K policies currently being considered as part of the Build Back Better Act in Congress13 would impact the motherhood penalty as well as mothers’ labor force decisions. The analysis finds that the proposed child care and pre-K program alone would reduce the motherhood penalty for mothers with young children by one-third.
Estimated Reductions in the Motherhood Earnings Penalty
This analysis found that, based on the most recent data, the typical woman with no children currently would experience a motherhood penalty that amounts to an average decrease of $7,567 in annual earnings per child under age 5 that she decides to have. Looking at the child care and preschool policies under consideration in Congress as of October 2021,14 the model shows that adopting these policies would result in an additional $2,463 per year on average for mothers with young children—that’s about a one-third decrease in the motherhood penalty, representing a reduction from 15 percent of annual earnings to 10 percent. This reduction in the motherhood penalty is a result of the increased ability of mothers to remain in paid employment while their children are young. In addition to reducing the motherhood penalty, having these policies in place will normalize working motherhood and thus likely also reduce bias against mothers being in the workforce. This analysis estimates that the reduction in the motherhood penalty would amount to an increase of $20.6 billion in aggregate nationwide earnings per year. (See Table 1.) In addition, many mothers who would be eligible for and use the new program (and don’t already participate in government-supported child care programs) would likely either rejoin the labor force or increase their work hours when child care and early learning are affordable and available to them. This analysis estimates that this increased labor force participation would add an additional $2.9 billion per year in earnings, for a total increase in annual earnings of $23.6 billion.
TABLE 1
| Analysis Summary of the Impact of Child Care Policy on the Motherhood Penalty and Mothers’ Labor Market Participation | |
| Current Estimated Annual Average Per-Child Motherhood Penalty for Children under Age 5 | $7,567 |
| Current Per Child otherhood Penalty as a Share of Average Annual Earnings (Children under Age 5) | 14.6% |
| Estimated Annual Average Increase in a Mother’s Earnings Due to Reduction in Motherhood Penalty (Children under Age 5) | $2,463 |
| Number of Children under Age 5 with Working Mothers | 8,384,930 |
| Total Estimated Earnings Increase as a Result of Proposed Program | $20,648,041,811 |
| Estimated Number of Mothers of Children under Age 5 Expected to Enter the Workforce or Increase Hours Worked as a Result of the Proposed Policy | 315,115 |
| Estimated Average Earnings Increase among Mothers Entering the Workforce or Increasing Hours | $9,321 |
| Total Estimated Earnings Increase among Mothers Entering the Workforce or Increasing Hours as a Result of the Proposed Policy | $2,937,093,641 |
| Combined Estimated Earnings Increase as a Result of Reductions in the Motherhood Penalty and Increases in Mothers’ Labor Force Participation and Work Hours | $23,585,108,452 |
| Source: Authors’ calculations using data from a variety of publicly available sources. See Appendix B for more details on sources and methodology. Notes: Dollars values are in 2020 equivalents. Average annual earnings of women without children is calculated for women age 25 to 45, as these are considered prime childbearing years. Estimates of the total increase in earnings among mothers entering the workforce or increasing hours may not equal the average earnings increase multiplied by the number of mothers expected to modify their labor force participation due to rounding. |
|
The findings in this analysis are based on a 2016 cross-national study of the relationship between child care policies and motherhood penalties. The study found that higher enrollments of children ages 0 to 3 in publicly subsidized child care were associated with smaller motherhood penalties: countries with only 1 percent of children in such care had a per-child motherhood penalty of 9.5 percent, while countries with 41 percent of infants in such care had a per-child motherhood penalty of only 4.3 percent.15
Estimated Reductions in Child Care Costs
In addition to increasing mother’s earnings, the new policies will decrease their child care costs. Today, families with lower incomes who pay for child care spend about 35 percent of their income on child care.16 The price of infant care alone can be between 7 percent and 18 percent of a married couple’s income and more than half of a single parent’s income; and for infant and toddler siblings in child care, the annual price exceeds annual mortgage payments for homeowners in forty states and the District of Columbia and annual median rent payments in every state.17 The new policies are expected to lower families’ annual child care costs by about $5,000 to $6,500 in most states.18
Together, increased wages, lower child care costs, and more availability of child care options—especially for infants and toddlers—will mean significant boosts for family economic security and gender equity. The results for families with children will be a greater ability to cover daily expenses, save for emergencies and the future, and build wealth over time.
Additional Steps Are Needed to Fully Eliminate the Motherhood Penalty
The child care and early learning policies currently being considered in Congress would make a significant dent in the motherhood penalty, but would not eliminate it entirely. There are a number of reasons for this. First, the proposed policies would not include every family. This analysis assumes that families who meet income criteria19 and other criteria, such as participation in a range of activities from work to job search to education, are the ones that will be served. Second, other policies are needed alongside those that address child care and preschool to eliminate the motherhood penalty. For example, the paid family and medical leave policy in the Build Back Better plan would further reduce the penalty. While this analysis did not include calculations of the effect of paid leave policies on women’s earnings, it’s useful to note that CAP found that women lose $11.6 billion annually in aggregate due to lack of access to paid family and medical leave.20 Another study found that countries that allow for two years of job-protected leave are associated with the smallest per-child penalties—penalties that are roughly 73 percent smaller relative to countries with no leave.21 So, while this analysis is not able to account for the impact of paid leave, the paid leave policies in the Build Back Better plan would have a further impact on reducing the motherhood penalty.
Finally, cultural norms, discrimination, occupational segregation, and individual opportunities and choices likely further impact the motherhood penalty. Cultural norms that promote caregiving mothers as the ideal and preferred scenario continue to be pervasive and impact both employer and mother’s choices. Discrimination against mothers in the workforce still exists as well. One experimental study found that job applicant evaluators systematically rated childless women and fathers significantly higher than mothers on competency, work commitment, promote-ability, and recommendations for hire, and in turn gave mothers the lowest wage offers.22 In addition, racism and discrimination based on mother’s other intersecting identities also impacts the motherhood penalty. Finally, mothers with the resources to make choices about work and parenthood may choose to work less or not at all when their children are younger, which influences not only the motherhood penalty but also norms about working mothers.
Supporting Mothers Means Supporting Economic Growth
The Build Back Better plan will support children, families, communities and an equitable economic recovery. This analysis shows that it will also meaningfully reduce the motherhood wage penalty. These investments will also have far-reaching economic impacts beyond mothers and their families. One recent study found that if labor force participation for American prime-age women—those age 25 to 54—was currently at rates similar to those of women in Canada, Germany, and the United Kingdom, up to 4.85 million more women would be in the U.S. workforce, adding $650 billion per year to the economy overall, equivalent to 2.9 percent of total GDP.23 After the challenging, pandemic-related past twenty months and counting that mothers have had—on top of years of neglect regarding public policies that would support not only mothers but also an equitable economy—the time for change is now.
Appendix A: Comparison to Relevant Studies
This analysis complements recent findings from the National Women’s Law Center (NWLC) and the Center for Poverty and Social Policy at Columbia University and the Center for American Progress (CAP). For example, NWLC and Columbia found that expanding access to affordable, high-quality child care to everyone who needs it would increase the number of prime-age women with young children working full-time/full-year by about 17 percent, and by about 31 percent for women without any college degree.24 As a result, over the entire life course, access to affordable care could increase the lifetime earnings for women with two children by about $94,000, which would lead to an increase of about $20,000 in private savings (contributions plus growth) and an additional $10,000 in Social Security benefits for each working mother.25 This differs from the motherhood penalty analysis in this report because this report assumes a lower increase in the number of mothers working full-time due to the eligibility parameters of the program, assumptions about take-up rates, and different assumptions about how many mothers will increase their hours as a result of the new policy.
In addition, in a study looking at the cost of inaction on public policies, CAP found that the total estimated annual cost in lost wages to workers due to a lack of access to affordable child care was $9.4 billion. For women specifically, it was $8.8 billion.26 This represents the wage increase that we might expect under a child care program that is more universal than the one currently under consideration in Congress and assumes that most mothers who are either unemployed or working part-time due to child care reasons would increase their labor force participation if such a program were made available.
Appendix B: Methodology
Policy Parameters
The analysis assumes that families up to 200 percent of state median income (SMI) will pay no more than 7 percent of their income based on a sliding scale where the lowest income families pay nothing for child care. The analysis assumes that the cost of care includes higher wages for early educators and child care staff, low staffing ratios, and funds for facilities. The proposal phases in and becomes an entitlement in the fourth year and sunsets in the sixth year.
Analysis of the Motherhood Penalty
The analysis estimating the per-child motherhood penalty utilized 2016-2020 data from the Current Population Survey’s Annual Social and Economic Supplement (CPS ASEC). For the purposes of the analysis, the sample was limited to employed women age 25 to 45 (that is, prime child-bearing years) who are not self-employed and are not in the military. In order to compare the earnings of women with children under age 5 to those of similar women with no children, the sample used in the analysis includes both women who have no children (regardless of the age of the child) and mothers who have at least one child who is under age 5.
This analysis followed the work of Michelle J. Budig, Joya Misra, and Irene Boeckmann and estimated a cross-sectional model of the motherhood penalty in the United States.27 The model that Budig, Misra, and Boeckmann used to generate the above estimate of the impact of greater shares of children in subsidized care on the motherhood penalty used a human capital model, which includes controls for characteristics such as education and work experience. Work characteristics were not included in their model because they considered them to be endogenous to motherhood and earnings. Because of this and because their model estimate of the impact of greater percentages of children in subsidized care is used to modify the estimates in the present analysis, we elected to also utilize a human capital model. This model includes controls for age, age squared, urban area residence, continuous years of education as well as an indicator for whether the individual had received a bachelor’s degree or higher, the number of children under age 5, and state and year fixed effects.28
To adjust for the fact that there is a possible sample selection issue—people who are more likely to be employed may also be more likely to earn more, which will influence the estimated relationship between our explanatory variables and earnings—a Heckman two-step sample selection procedure was used. The approach used in this analysis follows Budig, Misra, and Boeckmann by first estimating the likelihood of employment as a function of nonearnings income (including interest income, unemployment income, workers compensation, veterans benefits, survivors benefits, disability insurance payments, dividend income, rental income, and educational assistance payments), the difference between total family income and the individual’s personal earnings, number of children under age 5, whether the individual is married, urban area residence, continuous years of education, an indicator for whether the individual has a bachelor’s degree or higher, as well as state and year fixed effects. The results of this first stage of the estimation are then used to construct an inverse Mills ratio, which is then included in the main regression analysis to correct for sample selection bias.
The estimates from the model described above are roughly comparable to the range of estimates of the motherhood penalty previously found by Budig—between 3.6 percent and 7.8 percent per child—though our estimates are higher, at 14.6 percent per child.29 This difference can be accounted for by a number of differences between the present analysis and the earlier analysis conducted by Budig. This analysis uses more current, cross-sectional data from 2016-2020 while Budig uses longitudinal data over the period 1979-1993. Further, the present focus on the impact of children under age 5 will likely result in a higher motherhood penalty, as ages 0 to 4 are typically the years in which child care is most intensive and most likely to cause disruptions in women’s careers. Budig, on the other hand, examines the impact of children regardless of age on mothers’ earnings.
We also explored variations in the motherhood penalty by race and ethnicity. These analyses were conducted by running the model described above separately for the group of interest, allowing the motherhood penalty to vary by state or race/ethnicity.
Investments in the Child Care Infrastructure and the Motherhood Penalty
Under the current policy proposal, model estimates suggest that approximately 8.4 million new children would newly receive subsidized child care/preschool each year when fully implemented. This is based on a cost estimation model developed by the authors in partnership with the Center for Law and Social Policy and the National Women’s Law Center to estimate the costs and impacts associated with different child care policy proposals. It represents one-year estimates for the number of children served at the end of the proposed six-year investment period, in 2026, following a gradual phase-in over that time. These estimates assume that take-up of the program will gradually increase as more families become aware of it and that take-up rates will be higher among lower-income families. Specifically, the model assumes a 70 percent take-up rate for families with incomes less than 100 percent of SMI, a 60 percent take-up rate for families with incomes between 100 percent and 200 percent of SMI, and a 50 percent take-up rate for families with incomes greater than 200 percent of SMI (for families of preschoolers only). The estimates of children served only include children newly served by the proposed investment; the estimates do not include children already served by the Child Care and Development Block Grant program (CCDBG), Early Head Start, Head Start, and/or State Pre-K. Finally, these estimates represent the total number of infants, toddlers, and preschoolers that would be impacted by the proposed investment, regardless of the share of a full-time slot that their families would need. It also assumes a state match that is gradually phased-in to 90:10 for infants and toddlers and 60:40 for preschoolers.
Budig, Misra, and Boeckmann estimate that for every increase of 1 percent in the number of children in subsidized care in a country, the motherhood penalty decreases by 0.001 log points.30 Using data from the 2019 American Community Survey (ACS) and program data from CCDBG, Head Start, Early Head Start, and state pre-K31 (an approximation of the number of children in subsidized care), it is estimated that approximately 12.6 percent of children under age 5 are currently receiving subsidized care. This increases the estimated share of all children under age 5 who receive subsidized care to 56.2 percent—an increase of 43.6 percentage points. Based on the above estimates, this is expected to decrease the motherhood penalty by 0.054 log points, or 5.5 percentage points. This effect was then combined with the estimated effects from the model described above to estimate the hypothetical motherhood penalty when more families have access to affordable and reliable subsidized care.
The Motherhood Penalty among Mothers of Older Children
Also of interest is how the motherhood penalty changes, if at all, as mothers’ children grow older and the relative care burden decreases. To answer this question, we utilized the same methodology outlined above and ran additional models examining the impact of having any children age 5 to 12 on mothers’ earnings. In order to isolate the effect of older children on the motherhood penalty, the “mothers” sample group was limited to women who had at least one child age 5 to 12 and who had no younger children. Mothers who also had younger children were not included in order to ensure that the model did not capture any residual effects of also having younger children on the estimated motherhood penalty associated with older children. As with the analysis of the motherhood penalty outlined above, the comparison group for this analysis was similar women with no children (regardless of the age of the child). This analysis was repeated for mothers of children age 13 to 18, with women with no children (regardless of the age of the child) as the comparison group.
The results of these models should be interpreted as the changing effect of a child (or children of similar ages) on a mother’s earnings as that child gets older and more self-sufficient. Because of the specific nature of the question these models seek to answer, these estimates cannot be used to estimate a combined motherhood penalty for a mother who, for example, has one child age 3 and one child age 8.
Investments in Child Care Infrastructure and Mothers’ Employment Decisions
In order to simulate the impact of the proposed policy on women’s labor force participation, hours worked, and consequently their earnings, we first estimated the eligible population of mothers with children under age 5 based on their family income’s ratio to the state median income (SMI). We then calculated the total amount they would need to spend to have all of their children under age 5 in high-quality child care or preschool (for infants and toddlers, this was adjusted based on the estimated share of a full-time slot needed, which is based on both parents’ employment status, or the mother’s employment status if single). The costs of each high-quality child care slot are based on the Cost of Child Care calculator, developed by the Center for American Progress.32 This cost was then expressed as a ratio of total family income and combined with the indicator for eligibility to identify families who both meet the income requirements (for infants and toddlers) and would be anticipated to spend more than 7 percent of their family’s income on high quality child care.
Based on previous simulation models that have been run on the policy as currently designed, which assume a take-up rate of 70 percent for eligible families meeting the above criteria and who have incomes below 100 percent SMI, a take-up rate of 60 percent for such families with incomes between 100 percent and 200 percent SMI, and a take-up rate of 50 percent for families above 200 percent SMI (for families with preschoolers only). Eligible families were randomly assigned to participate in the program based on these parameters. These take-up rates were further adjusted to account for the share of families who are already participating in a program which provides subsidized child care (for example, CCDBG, Head Start, Early Head Start, and/or state pre-K).33 Based on previous simulation model estimates, approximately 85 percent of total eligible children who are expected to be covered by the proposed program are not currently served by other programs. Finally, participation rates were further adjusted for the share of children who are already in some form of licensed child care because parents of these children are not expected to experience the same behavioral changes brought about by access to new affordable and reliable child care. Rasheed Malik estimates that 36.9 percent of children are in any licensed care.34
From here, we utilized data from Leila Schochet, which estimates the share of working parents who would enter the labor force, request more work hours, or otherwise make adjustments to their careers if reliable and affordable child care were made available.35 Schochet estimates that 51 percent of homemakers would look for a job if such an arrangement could be found and that 32 percent of part-time workers and 34 percent of full-time workers would request more hours at work. 51 percent of mothers who were not in the labor force, but would otherwise be eligible for the proposed program, were randomly assigned to enter the workforce when the program is implemented. Their earnings when employed were predicted using an earnings regression that controlled for age, age squared, urban area residence, years of education, an indicator for a bachelor’s degree or higher, indicators for major industry and occupation groups (based on her last reported job held), and state and year fixed effects. 32 percent of mothers who were working part-time and were expected to participate in the program, were randomly assigned to move to full-time employment (35 hours per week). In addition, 51 percent of mothers who were currently working less than full-year (50 weeks per year) were randomly assigned to work full-year. These mothers’ earnings were adjusted by estimating their current hourly rate (annual income / usual weekly hours x weeks worked per year) and applying the adjusted hours per week and/or weeks per year. Finally, 34 percent of mothers who were working full-time and were expected to participate in the program were randomly assigned to work 10 percent more hours. Like part-time mothers, full-time mothers’ earnings were adjusted by combining their current hourly rate with their adjusted hours worked per week and weeks per year.
The number of mothers who are expected to experience an increase in earnings as a result of the policy—either as a result of entering the labor force, or as a result of working more hours—is approximately 315,000. These mothers’ estimated adjusted earnings were compared with their current earnings to estimate the average increase in earnings (among those experiencing an increase) and these earnings increases were added up over all mothers to estimate the aggregate effect of the policy on earnings.
This report was produced with support from the Perigee Fund and the National Women’s Law Center. The authors would like to thank Dr. Michelle Budig, Melissa Boteach, and Julie Vogtman for their feedback.
Notes
- As told to one of the authors, September 29, 2021.
- As told to author by Misty Heggeness, U.S. Census Bureau, September 27, 2021.
- Per a study by the Center for American Progress, a woman earning the median salary for younger, full-time, full-year workers—$30,253 annually in 2014—who takes five years off at age 26 for caregiving would lose $467,000 over her working career, reducing her lifetime earnings by 19 percent. Michael Madowitz, Alex Rowell, and Katie Hamm, “Calculating the Hidden Costs of Interrupting a Career for Child Care,” Center for American Progress, June 21, 2016, https://www.americanprogress.org/issues/early-childhood/reports/2016/06/21/139731/calculating-the-hidden-cost-of-interrupting-a-career-for-child-care/.
- “Fact Sheet: Female Labor Force Participation Is Key to Our Economic Recovery,” Ready Nation: Council for a Strong America, July 28, 2021, https://www.strongnation.org/articles/1604-female-labor-force-participation-is-key-to-our-economic-recovery.
- Michelle J. Budig and Paula England, “The Wage Penalty for Motherhood,” American Sociological Review 66, no. 2 (April 2001): 204–25, https://www.jstor.org/stable/i345670.
- Michelle J. Budig, Joya Misra, and Irene Boeckmann, “Work–Family Policy Trade-Offs for Mothers? Unpacking the Cross-National Variation in Motherhood Earnings Penalties,” Work and Occupations 43, no. 2 (2015):119–77, https://journals.sagepub.com/doi/10.1177/0730888415615385.
- Author’s analysis. Calculated using pre-pandemic data.
- Author’s analysis.
- Using cross-sectional data rather than longitudinal data allows researchers to use fixed-effects models, which can account for unobserved differences between individuals that are not captured in most data sources. Because the findings in this analysis differ from previous analyses of the motherhood penalty by race and ethnicity, these findings should be interpreted with caution.
- “The U.S. and the High Price of Child Care: Appendices,” Child Care Aware, 2019, https://cdn2.hubspot.net/hubfs/3957809/2019%20Price%20of%20Care%20State%20Sheets/Final-TheUSandtheHighPriceofChildCare-Appendices.pdf.
- Steven Jessen-Howard, Rasheed Malik, and MK Falgout, “Costly and Unavailable: America Lacks Sufficient Child Care Supply for Infants and Toddlers,” Center for American Progress, August 4, 2020, https://www.americanprogress.org/issues/early-childhood/reports/2020/08/04/488642/costly-unavailable-america-lacks-sufficient-child-care-supply-infants-toddlers/.
- Ibid.
- H.R.5376—Build Back Better Act, 117th Congress (2021–2022), https://www.congress.gov/bill/117th-congress/house-bill/5376/text.
- The proposal that was in the original House Education and Labor Committee mark-up proposed ensuring that no family above 200 percent of state median income pay more than 7 percent of their income for child care and provides universal pre-K for children ages 3 and 4. This analysis uses the assumptions from that original proposal. Accessed October 4, 2021, https://edlabor.house.gov/download/committee-print-s-con-res-14-reconciliation-directives-amendment-in-the-nature-of-a-substitute.
- Michelle J. Budig, Joya Misra, and Irene Boeckmann, “Work–Family Policy Trade-Offs for Mothers? Unpacking the Cross-National Variation in Motherhood Earnings Penalties,” Work and Occupations 43, no. 2 (2015): 119–77, https://journals.sagepub.com/doi/10.1177/0730888415615385.
- Rasheed Malik, “Working Families are Spending Big Money on Child Care,” Center for American Progress, June 20, 2019, https://www.americanprogress.org/issues/early-childhood/reports/2019/06/20/471141/working-families-spending-big-money-child-care/.
- “The U.S. and the High Price of Child Care: Appendices,” Child Care Aware, 2019, https://cdn2.hubspot.net/hubfs/3957809/2019%20Price%20of%20Care%20State%20Sheets/Final-TheUSandtheHighPriceofChildCare-Appendices.pdf.
- Rasheed Malik, “The Build Back Better Act Would Greatly Lower Families’ Child Care Costs,” Center for American Progress, September 22, 2021, https://www.americanprogress.org/issues/early-childhood/news/2021/09/22/503993/build-back-better-act-greatly-lower-families-child-care-costs/.
- The bill that passed the House of Representatives Education and Labor Committee included an amendment that removed the income cap. This analysis assumes the original version of the policy is more likely to pass.
- Sarah Jane Glynn, “The Rising Cost of Inaction on Work-Family Policies,” Center for American Progress, January 21, 2021, https://www.americanprogress.org/issues/women/news/2020/01/21/479555/rising-cost-inaction-work-family-policies/.
- Michelle J. Budig, Joya Misra, and Irene Boeckmann, “Work–Family Policy Trade-Offs for Mothers? Unpacking the Cross-National Variation in Motherhood Earnings Penalties,” Work and Occupations 43, no. 2 (2015): 148–49, https://journals.sagepub.com/doi/10.1177/0730888415615385.
- Shelly Correll, Stephen Benard, and In Paik, “Getting a Job: Is there a Motherhood Penalty?” American Journal of Sociology 112, no. 5 (2007): 1297-339.
- Amanda Novello, “The Cost of Inaction: How a Lack of Family Care Policies Burdens the U.S. Economy and Families,” National Partnership for Women & Families, July 2021, https://www.nationalpartnership.org/our-work/resources/economic-justice/other/cost-of-inaction-lack-of-family-care-burdens-families.pdf.
- Robert Paul Hartley, Ajay Chaudry, Melissa Boteach, Estelle Mitchell and Kathryn Menefee, “A Lifetime’s Worth of Benefits: The Effects of Affordable, High-quality Child Care on Family Income, the Gender Earnings Gap, and Women’s Retirement Security,” National Women’s Law Center and Center on Poverty & Social Policy at Columbia University, March 2021, https://nwlc.org/wp-content/uploads/2021/04/A-Lifetimes-Worth-of-Benefits-_FD.pdf.
- Ibid.
- Sarah Jane Glynn, “The Rising Cost of Inaction on Work-Family Policies,” Center for American Progress, January 21, 2021, https://www.americanprogress.org/issues/women/news/2020/01/21/479555/rising-cost-inaction-work-family-policies/.
- Michelle J. Budig, Joya Misra, and Irene Boeckmann, “Work–Family Policy Trade-Offs for Mothers? Unpacking the Cross-National Variation in Motherhood Earnings Penalties,” Work and Occupations 43, no. 2 (2015):148–49, https://journals.sagepub.com/doi/10.1177/0730888415615385.
- Variations of the models outlined in the methodology were also run using an indicator for whether the woman had any children under the age 5. The results of these models are similar to those which use a continuous measure of the number of children under the age of 5. Following Budig and others, we focus our attention on the results of the analysis of the per child motherhood penalty. Michelle J. Budig. “The Fatherhood Bonus and The Motherhood Penalty: Parenthood and the Gender Gap in Pay,” Third Way, September 2, 2014, https://www.thirdway.org/report/the-fatherhood-bonus-and-the-motherhood-penalty-parenthood-and-the-gender-gap-in-pay.
- We also ran additional models following the nested model approach of Budig and found very similar results for the full-specification model, but for the reasons outlined above have chosen to focus on the human capital model results.
- Michelle J. Budig, Joya Misra, and Irene Boeckmann, “Work–Family Policy Trade-Offs for Mothers? Unpacking the Cross-National Variation in Motherhood Earnings Penalties,” Work and Occupations 43, no. 2 (2015): 119–77, https://journals.sagepub.com/doi/10.1177/0730888415615385.
- “FY 2019 CCDF Data Tables (Preliminary),” U.S. Department of Health and Human Services, Office of Child Care, 2021, https://www.acf.hhs.gov/occ/data/fy-2019-ccdf-data-tables-preliminary; “Head Start Enterprise System,” U.S. Department of Health and Human Services, Administration for Children and Families, Office of Head Start, 2021, https://hses.ohs.acf.hhs.gov/; Allison H. Friedman-Krauss, W. Steven Barnett, Karin A. Garver, Katherine S. Hodges, G. G. Weisenfeld, and Beth Ann Gardiner “The State of Preschool 2020,” National Institute for Early Education Research, . 2021, https://nieer.org/wp-content/uploads/2021/04/YB2020_Full_Report.pdf.
- Simon Workman “The True Cost of High-Quality Child Care Across the United States,” Center for American Progress, 2021, https://www.americanprogress.org/issues/early-childhood/reports/2021/06/28/501067/true-cost-high-quality-child-care-across-united-states/; Simon Workman and M.K. Falgout, “Methodology for ‘The True Cost of High-Quality Child Care Across the United States,’” Center for American Progress, 2021, https://cdn.americanprogress.org/content/uploads/2021/06/28062526/METHODOLOGY_True-Cost-of-High-Quality-Child-Care.pdf?_ga=2.133160397.271087915.1633221121-4769836.1618750990.
- “FY 2019 CCDF Data Tables (Preliminary),” U.S. Department of Health and Human Services, Office of Child Care, 2021, https://www.acf.hhs.gov/occ/data/fy-2019-ccdf-data-tables-preliminary; “Head Start Enterprise System,” U.S. Department of Health and Human Services, Administration for Children and Families, Office of Head Start, 2021, https://hses.ohs.acf.hhs.gov/; Allison H. Friedman-Krauss, W. Steven Barnett, Karin A. Garver, Katherine S. Hodges, G. G. Weisenfeld, and Beth Ann Gardiner “The State of Preschool 2020,” National Institute for Early Education Research, 2021, https://nieer.org/wp-content/uploads/2021/04/YB2020_Full_Report.pdf.
- Rasheed Malik, “Working Families Are Spending Big Money on Child Care,” https://www.americanprogress.org/issues/early-childhood/reports/2019/06/20/471141/working-families-spending-big-money-child-care/.
- Leila Schochet, “The Child Care Crisis is Keeping Women Out of the Workforce,” Center for American Progress, 2019, https://www.americanprogress.org/issues/early-childhood/reports/2019/03/28/467488/child-care-crisis-keeping-women-workforce/.