With an investment of more than $300 million per year, New York State provides more state scholarship funds to private colleges than does any other state.1 While the bulk of these funds are administered through the New York Tuition Assistance Program (TAP) to students attending nonprofit institutions, more than a fifth ($68 million in 2015–16) goes to for-profit schools.2 In fact, of the twenty-seven states that provided any grants to for-profit institutions in 2015, New York spent the highest amount.3
Last year, Governor Cuomo expanded the state’s commitment to college affordability, announcing a new Excelsior Scholarship for New Yorkers attending the state’s public colleges, and an Enhanced Tuition Awards Program (ETAP) for nonprofit colleges. Now, as New York implements its expansion of aid to students at public and nonprofit institutions, and considers expansion of ETAP to for-profit institutions, recently released federal data provides an opportunity to assess the benefits that New York and its students are enjoying from the state’s investment in public, private nonprofit, and private for-profit colleges.
In this report, The Century Foundation uses federal data sets to provide new, state-level analysis of the following three measures of higher education quality:
- Employment Outcomes. Which schools produce employment outcomes that are demonstrably better than opportunities for typical high-school graduates?
- Financial Distress. Which schools are most likely to lead students to financial distress and default?4
- Investment in Education. What share of tuition revenue—including taxpayer-funded grants—is allocated to student instruction?
These measures are used to evaluate the performance of New York institutions, comparing outcomes for 427 New York schools based on their accountability mechanisms and control structures (“institution type”):5
- 112 schools controlled by elected or appointed officials and overseen as if they were government agencies for accountability purposes (“public”);
- 196 schools overseen by trustees, who are required by law to commit all revenue to educational or charitable purposes (“nonprofit”); and
- 119 institutions that are overseen and controlled by owners and investors, with no obligation to restrict spending to educational or charitable purposes (“for-profit”).
For all three measures of higher education quality, the outcomes show startling disparities between schools that are subject to public, nonprofit, and for-profit control. In addition to analyses based on institution type, TAP-receiving schools are also analyzed at the institutional level.6
- 38 percent of for-profit schools leave a majority of their students with earnings below those of an average worker with only a high school diploma.
- Seven New York schools— all under for-profit control—receive TAP funding and also put a majority of their students in debt only to earn less than $25,000, or the average wage of a high-school degree-holder.
- 1 in 4 New Yorkers in default on student loans attended a for-profit school, even though these schools enroll only 7 percent of all New York students.
- Nearly half (47 percent) of all students who start college at a New York for-profit school default on federal student loans within twelve years.
- Over twelve years, students at for-profit schools default at more than four times the rate of those at public and nonprofit colleges in New York.
- By combining poor performance and targeted recruitment, for-profit schools exacerbate inequality.
- In New York, 72 percent of African American and/or black students7 who attend for-profit colleges default within twelve years, while the default rate is only 25 percent for black students who attend public and nonprofit colleges.
- At many of the worst-performing New York schools—by job and loan outcomes—at least 50 percent of enrollments are made up of first-generation or underrepresented minority college students.
- While schools frequently blame poor outcomes on the students they choose to enroll, it is important to examine how the institutions spend the funds they receive.
- For-profit schools charge more but invest less in student education.
- In 2015, for every $1 of tuition revenue received, New York’s for-profit schools spent $0.41 on instruction compared to $0.86 spent on instruction at nonprofit schools.
- While 78 percent of nonprofit schools spend at least half of tuition revenue on student instruction, only 29 percent of for-profit schools do so.
New York’s commitment to college accessibility shows in its highest-in-the-nation contribution to supporting private higher education. Unfortunately, some colleges—concentrated in the for-profit sector—benefit from this investment while leaving students with more debt, worse employment prospects, and higher default rates relative to peers at public and nonprofit schools. These metrics reveal accountability concerns that, because of the student populations involved, also raise equity concerns.
Student Employment Outcomes
“Students pay thousands of dollars to for-profit colleges because they rightly believe education is the ticket to success in their careers. That’s why it’s so unfortunate that this company exploited students’ aspirations…”
—New York Attorney General Eric Schneiderman, Settlement with Career Education Corporation
For-profit schools attract students with promises of bright futures and increased earnings. But, after investing time and money in pursuing higher education, too many students leave for-profit schools only to learn that their schools mischaracterized likely outcomes. Since schools rarely admit to misrepresenting employment outcomes, uncovering deceptive practices requires resource-intensive investigations like the state attorney general’s investigations of DeVry New York8 and Career Education Corporation (CEC), a for-profit education company which operates the Sanford-Brown, SBI Institute, and Briarcliffe campuses in New York as well as the American International University (“AIU”) and Colorado Technical University (“CTU”) online education chains.9 Employment data, however, reveals that students of some New York colleges have earnings outcomes that are worse than expected outcomes for workers who never attended college.
Each and every one of New York’s public colleges and universities and 87 percent of nonprofit colleges lead a majority of students who receive financial aid to outearn a typical high-school degree holder.10 This result may seem natural: of course students would earn more after enrolling in college. However, not all institutions succeed in giving students a leg up. Among nonprofit institutions, 17 of 126 (13 percent) leave a majority of undergraduate students earning less than a typical high school graduate.11 Among for-profit institutions, 25 of 65 (38 percent) leave a majority of their students unable to earn more than a typical high-school degree holder.12
Figure 1
Many of the New York schools that lead a majority of graduates to earn less than an average high school worker are certificate-granting programs at for-profit schools. This result is consistent with national data, which suggest that for-profit certificate programs tend to deflate wages.13 However, seven degree-granting New York schools also put a majority of their students in debt only to earn less than $25,000, or the average wage of a high-school degree-holder, ten years after enrolling.14 All of these are for-profit schools. Since each of these institutions receives TAP funding, this means that New York state is subsidizing schools that lead to an undesirable result: student debt and depressed wages.
Table 1
| Colleges Where a Majority of Students Earn Less Than the Average High-School Degree Holder | ||
| Rank | School Name | Share of Students Earning < $25K |
| 1 | Pacific College of Oriental Medicine | 63% |
| 2 | Elmira Business Institute | 61% |
| 3 | Globe Institute of Technology15 | 57% |
| 4 | Bryant & Stratton College16 | 54% |
| 5 | Plaza College | 54% |
| 6 | Mildred Elley (operated by Empire Education Corporation)17 | 54% |
| 7 | ASA College | 51% |
| Note: This list is limited to TAP-receiving schools where a majority of Title IV-receiving undergraduates borrowed federal student loans in the 2014–15 year.
Source: Calculations by TCF and TICAS using data from the U.S. Department of Education, College Scorecard, and from the New York State Tuition Assistance Program (TAP). |
||
The combination of debt and dismal employment outcomes for students at underperforming for-profit schools is particularly troubling given the needs of the low-income and minority students that these schools disproportionately enroll.18 New York’s public colleges and universities demonstrate that with high-quality educational programming, students from lower-income families can compete and succeed on equal footing with peers from higher-income backgrounds.19 Too many for-profit colleges fail to deliver on the same promise of opportunity and upward mobility.
Financial Distress and Student Loan Default
“Default rates in New York vary dramatically among the three types of higher education institution: public, private nonprofit, and proprietary (also known as for-profit schools). Cohort default rates for students who attended proprietary schools were more than triple the level of those who attended private nonprofit institutions[.]”
—Office of the New York State Comptroller
Data on student loan defaults provides another window into outcomes for students who pursue higher education in New York. In October 2017, long-term data became available for the first time to show the share of all entering students—including student loan borrowers and non-borrowers—who experience default on student loans within twelve years after starting to pursue higher education.20 These sample-based longitudinal data measure defaults twelve years after a student first enrolls in college, and are the most robust data available to study the long-term debt and repayment outcomes of students pursuing higher education in New York.21 The Department of Education also calculates shorter-term default rates examining the share of borrowers at each institution who default on federal loans just three years after entering repayment.22
Longitudinal data show that 47 percent of students—including student loan borrowers and non-borrowers—who started at a for-profit college have defaulted on a federal student loan within twelve years, compared to 11 percent of students who start at a public college and 10 percent of students who start at nonprofit schools.23
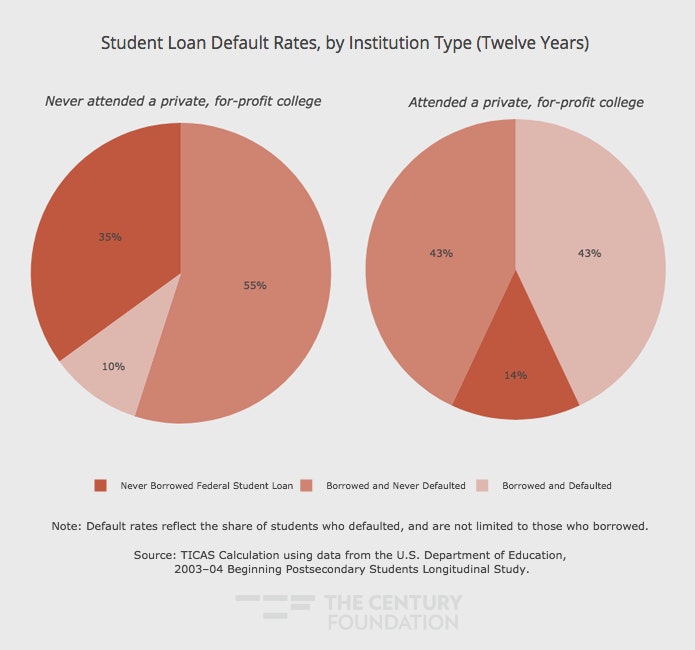
Figure 2
When students are clustered by whether they ever attended a for-profit college—rather than by the type of institution they first attended—those who attended for-profit schools are more than four times as likely to borrow and go into default on federal loans within twelve years when compared to those who never attended for-profit schools.24 Additionally, sector-based analysis of these data by the Brookings Institute show that nationally, students who start at two-year public community colleges but who subsequently attend for-profit schools are more than three times as likely to default compared to peers who start at community colleges and never attend for-profit schools.25
Figure 3
Moreover, the pattern of for-profit college students defaulting at higher rates holds true across family income and race subcategories of New York student borrowers.26 New York students from the lowest quartile of family income were almost four times as likely to default within twelve years if they ever attended a for-profit college (38 percent versus 10 percent).27
Figure 4
The default gap for students who attend for-profit colleges is apparent within racial groups as well. The consequences of attending a for-profit college are particularly troubling for African American and/or black students in New York: almost 3 in 4 (72 percent) of those who ever attended a for-profit college defaulted within twelve years, compared to about 1 in 4 (24 percent) black students who never attended a for-profit college. Despite the problematic consequences, for-profit schools in New York enroll high numbers of black students.28
Figure 5
These longitudinal data demonstrate that attendance at for-profit colleges is associated with long-term default rates for students in many categories of family income and race.
Even shorter-term measurements show that for-profit schools contribute to an outsized share of student loan defaults. The Department of Education calculates default rates for federal student loan borrowers within three years of entering repayment.29 The most recent data show that, among colleges in New York, for-profit colleges account for 1 in every 4 (25 percent) student loan defaults on federal loans, even though for-profit colleges account for only 7 percent of student enrollments in New York.30
Table 2
| Comparison of New York Enrollments and Defaults | |
|
Share of Student Enrollments by Institution Type |
|
|
Share of New York Student Enrollments |
|
| Public | 56% |
| Private, Nonprofit | 38% |
| Private, For-Profit | 7% |
|
Share of Student Loan Defaults by Institution Type |
|
| Share of New York Defaulters (Within Three Years) | |
| Public | 53% |
| Private, Nonprofit | 21% |
| Private, For-Private | 25% |
| Share of Student Borrowers, by Institution Type | |
| Share of New York Borrowers | |
| Public | 45% |
| Private, Nonprofit | 40% |
| Private, For-Profit | 15% |
| Note: Short-term default figures include federal loan borrowing and three-year default rates for students entering repayment in fiscal year (FY) 2014.
Source: Calculations by TICAS using data from the U.S. Department of Education, Integrated Postsecondary Education Data System (IPEDS), 12-month enrollment in 2015–16, and FY2014 three-year cohort default rates. |
|
The table below calculates the share of enrolled students at a college who borrow federal student loans and default on those loans within three years of entering repayment, a figure we describe as the “student default risk.”31 Considering both borrowing and default rates, the risk of a New York student defaulting after attending a for-profit college is more than five times higher than after attending a private nonprofit college and almost four times higher than after attending a public college.32
Figure 6
The following are the ten New York schools with the highest default risk among institutions receiving TAP. All are for-profit schools.
Table 3
|
Ten Colleges with Highest Default Risk (Three Years) |
||
| Rank | School Name | Student Default Risk |
| 1 | Cheryl Fells School of Business | 30% |
| 2 | Elmira Business Institute | 22% |
| 3 | Sanford-Brown Institute (operated by Career Education Corporation)33 | 21% |
| 4 | Art Institute of New York City (operated by Education Management Corporation)34 | 16% |
| 5 | Bryant & Stratton College35 | 16% |
| 6 | ITT Technical Institute (operated until 2016 closure by Educational Services, Inc.)36 | 15% |
| 7 | Briarcliffe College (Operated by Career Education Corporation)37 | 15% |
| 8 | Globe Institute of Technology | 14% |
| 9 | Utica School of Commerce | 12% |
| 10 | Mandl School | 12% |
|
Note: This list is limited to TAP-receiving schools. Students’ short-term default risk is calculated as a product of a college’s FY2013 three-year cohort default rate multiplied by the share of students at that college who borrowed federal loans in 2014–2015. Source: Calculations by TCF and TICAS using data from the U.S. Department of Education, College Scorecard, last updated December 2017, and from the New York State Tuition Assistance Program (TAP), last updated November 2017. |
||
Inequitable Investments in Education
“What we are concerned about . . . is that predatory, for-profit colleges are taking advantage of the ambition that so many New Yorkers with low incomes have for a better life, and cheating them out of their dreams and their money.”
—Julie Menin, former commissioner, New York City Department of Consumer Affairs38
One likely factor contributing to poor outcomes at for-profit colleges is that they frequently spend relatively less of their revenue on instruction and generally less overall compared to non-profit schools.39 For every type of credential, for-profit schools charge the highest tuitions, and yet, despite higher charges, they invest the least in student instruction.40
Table 4
| Average Tuition and Instructional Spending, by Degree Program and Institution Type | ||
| Tuition revenue and instructional expenditure for certificate-granting programs | ||
| Tuition | Instructional Spending | |
| Public (4,100 students) | $6,866 | $6,811 |
| Private, nonprofit (5,408 students) | $11,519 | $6,428 |
| Private, for-profit (15,952 students) | $15,636 | $6,101 |
| Tuition revenue and instructional expenditure for associate’s degree programs | ||
| Tuition | Instructional Spending | |
| Public (271,229 students) | $2,722 | $7,468 |
| Private, nonprofit (10,996 students) | $16,135 | $9,093 |
| Private, for-profit (21,912 students) | $13,877 | $5,166 |
| Tuition revenue and instructional expenditure for bachelor’s degree programs | ||
| Tuition | Instructional Spending | |
| Public (295,190 students) | $5,659 | $12,772 |
| Private, nonprofit (330,325 students) | $20,063 | $19,025 |
| Private, for-profit (11,258 students) | $23,762 | $8,509 |
| Note: Institutions as sorted by type of control and predominant degree granted. Average values for tuition receipts and instructional spending are weighted by student enrollments.
Source: TCF calculations using data from the U.S. Department of Education, College Scorecard, last updated December 2017. |
||
Some schools spend very little of their tuition receipts on costs relating to student instruction. In 2015, more than three-quarters of nonprofit schools (78 percent) spent at least half of their tuition revenue per full-time equivalent (FTE) enrollment on instruction, while 71 percent of for-profit schools failed to meet this threshold of investment in student instruction.41
Figure 7
With for-profit schools, students and taxpayers are frequently paying more while receiving less value. In 2015, for every $1 of tuition revenue received, New York’s for-profit schools spent $0.41 on instruction compared to $0.85 spent on instruction at nonprofit schools and $2.15 spent on instruction at public programs.42
Figure 8
These disparate rates of investment in instruction raise critical equity concerns, since the schools that are providing the lowest value and worst conditions for student success are for-profit schools that disproportionately enroll low-income, first-generation, and underrepresented minority students in New York.43
Research on social mobility shows that at New York’s public colleges and universities, students from lower-income families are able to compete and succeed at rates that are comparable to peers from higher-income backgrounds.44 Additionally, long-term default rates show that for every level of parental income and every racial demographic, students are far more likely to default if they ever attend a for-profit school.45 This default gap is particularly notable for black students in New York, whose default rates jump from 24 percent for those who never attend for-profit schools to 72 percent for students who do attend for-profit schools. While race-based disparities in educational investment start early,46 New York’s higher education policy is also contributing to those disparities because so many vulnerable students attend institutions with low rates of instructional spending.
Figure 9
An analysis of the schools that appear in one or more of the above tables showing worst outcomes among TAP-receiving New York colleges reveals that all but one of these poor-performing schools recruit a student population where at least half of enrollments are either first-generation college students or black or hispanic students.47 These vulnerable students are overenrolled in schools that are chutes to low earnings and student loan defaults, not ladders to better opportunities. While ensuring that students from these communities have access to higher education is a worthy goal, policymakers must ensure that students receive access to high-quality degrees.
Table 5
|
Composition of Student Bodies at Poor-Performing Colleges |
|||
|
School Name |
Worst in: | Share Black and Hispanic Students |
Share 1st-Generation College Students |
| Mandl School | Default | 91% | 55% |
| Art Institute of New York City (operated by Education Management Corporation) | Default | 72% | 44% |
| ASA College | Earnings | 69% | 57% |
| Globe Institute of Technology | Earnings, Default | 66% | 50% |
| Cheryl Fells School of Business | Default | 65% | 63% |
| Plaza College | Earnings | 64% | 54% |
| Mildred Elley (operated by Empire Education Corporation) | Earnings | 62% | 54% |
| Bryant & Stratton College | Earnings, Default | 52% | 54% |
| ITT Technical Institute (operated until 2016 closure by Educational Services, Inc.) | Default | 49% | 50% |
| Briarcliffe College (Operated by Career Education Corporation) | Default | 23% | 51% |
| Sanford-Brown Institute (operated by Career Education Corporation) | Default | 17% | 55% |
| Elmira Business Institute | Earnings, Default | 15% | 64% |
| Utica School of Commerce | Default | 13% | 53% |
|
Source: TCF calculations using data from the U.S. Department of Education, College Scorecard. |
|||
Finally, while more research is needed to understand why vulnerable students enroll in for-profit schools at high rates, documents filed in recent civil rights lawsuits suggest that some schools make marketing choices to target black students. For example, an Illinois-based recruiter for Corinthian Colleges Inc., the low-performing multistate for-profit company that operated a branch campus in Rochester, New York, before lawsuits and loss of federal financial aid eligibility led to its closure and bankruptcy, alleged in a whistleblower action that “racial targeting [was] a core component of Corinthian’s business model,” and that Corinthian set “up a recruitment program to identify and focus on predominantly African-American high schools” because the owners embraced “discriminatory stereotypes that they [would be] especially vulnerable to the school’s emotionally manipulative and deceptive sales tactics.”48 Similarly, an investigation in Virginia revealed that at a for-profit school there, “reps were told to go to African American zip codes, but not to white zip codes. . . [because the school] thought that African Americans would agree to take out loans.”49 In New York, an educational counselor at one nonprofit social service organization in the Bronx expressed concerns that for-profit schools were targeting people like his clients: “young people of color who come from lower-income communities and see education as a means to a better future.”50
By enrolling disproportionately high numbers of low-income, and first-generation, and black and hispanic college students, but then providing low-value instruction at a high cost, for-profit schools amplify and reinforce inequities in educational investment.
Conclusion
New York state’s investment in higher education—including its largest-in-the-nation investment in private for-profit colleges—should improve equity, reduce debt, and yield broader access to high-quality degrees. Unfortunately, some New York schools are failing to realize these goals. The Century Foundation and partners propose a multifaceted approach to address the complex problem of encouraging positive innovations while preventing predatory abuses in higher education like the ones described above.
As the federal government lowers standards and abandons critical oversights that had been used to spur the closures of low-performing for-profit schools like ITT Technical Institutes, Everest Institute, and Sanford-Brown, it is even more critical for progressive, education-focused states like New York to implement policies that will protect students, safeguard the integrity of public investments like TAP, and demand accountability from schools.
Acknowledgements
This report was written by Yan Cao with the assistance of Amanda Novello, Diane Cheng (TICAS), and Veronica Gonzalez (TICAS), March 2018.
Notes
- As of 2015–16, the most recent academic year for which national data are available. National Association of State Student Grant & Aid Programs, 47th NASSGAP Survey, 2015–2016, http://nassgap.org/survey/NASSGAP%20Report%2015-16_2.pdf.
- Id. More information on TAP—a state program which also provides need-based grants for students at public colleges and universities—is available available from the New York State Higher Education Services Corporation (HESC) at https://www.hesc.ny.gov/pay-for-college/financial-aid/types-of-financial-aid/grants/tap-eligibility.html.
- Twenty-three states and Washington, D.C. do not provide state grant aid to for-profit colleges. 47th NASSGAP Survey, 2015–2016, https://www.nassgap.org/viewrepository.aspx?categoryID=3#.
- Default for federal student loans is defined as at least 270 days of missed payments. See “What is default,” Office of Federal Student Aid, https://studentaid.ed.gov/sa/repay-loans/default#default.
- This set is defined by College Scorecard data (which is described below) and excludes training programs, such as Trump University, or self-study programs, such as Khan Academy, that lack state authorization and federally-recognized accreditation but that may present themselves to the public as “schools” or “colleges” or “universities.” Throughout this report, unless otherwise noted, calculations are based on data for colleges with unique federal identifiers (six-digit “OPEIDs,” or Office of Postsecondary Education Identification numbers) to eliminate duplicate results, and include colleges where at least one campus is located in New York.
- HESC publishes data on all TAP receipts by schools since 2000. HESC, “Tuition Assistance Program (TAP) Recipients & Dollars by College and Sector Group: Beginning 2000,” updated November 29, 2017, https://data.ny.gov/Education/Tuition-Assistance-Program-TAP-Recipients-Dollars-/tua9-wsak. TAP grants are available to for-profit schools whose academic programs run for two years (1440 credit hours) or longer. See generally, N.Y. Educ. Law § 601(4) (defining “approved program” for purposes of New York State higher education student financial aid programs).
- The period from which survey data has been used in this report included a change in terminology from “African American” to “black.” Given that not everyone who identifies as one also identifies as the other, an “and/or” has been used to indicate the partial overlap between the two identity groups.
- DeVry entered a $2.75 million settlement after the New York attorney general’s investigation found that DeVry had misled New York students for eight years from 2008 to 2016. Id. DeVry received over $16 million in TAP grants during this same period.
- CEC entered a $10.25 million settlement after the New York attorney general found that CEC had misled students about accreditation, graduates’ eligibility to work in licensed professions, and students’ ability to transfer credits to other schools, during the period from 2009 to 2011. CEC received $14,589,851 in TAP grants during this same period.
- Throughout this section, threshold earnings data, most recently available in the 2013–14 College Scorecard data file, are limited to Title IV-receiving students who were not enrolled as students during the earnings measurement year. Schools report median student earnings, which are adjusted to 2016 dollars and are not available for colleges with too few students in the cohort. For additional information on this calculation, see Figure 1.
- Of these seventeen schools, only one—Manhattan School of Music—reported undergraduates borrowering federal student loans in 2014–2015. The other sixteen either did not report on undergraduate debt—Professional Business College—or reported that zero percent of undergraduates took out student loans. In addition to being debt-free, eleven of these are rabbinical schools whose students may be motivated by goals other than increased earnings.
- In preparing the 2015 College Scorecard dataset, the Department of Education selected $25,000 as a threshold figure because “it corresponds approximately to the median wage of workers ages 25 to 34 with only a high-school degree.” See Department of Education, “Data Documentation for College Scorecard” at 25, December 2017, https://collegescorecard.ed.gov/assets/FullDataDocumentation.pdf.
- On a system-wide level, economic research demonstrates that among certificate-granting programs, for-profit programs tend to deflate wages rather than improving students’ earning potential. Post-college earnings are 11 percent lower for students who attend for-profit certificate programs as compared to students who attend public programs. Stephanie Riegg Cellini, and Nicholas Turner, “Gainfully Employed? Assessing the Employment and Earnings of For-Profit College Students Using Administrative Data,” National Bureau of Economic Research, revised January 2018, http://www.nber.org/papers/w22287.
- For additional information on this calculation, see Table 1.
- Globe Institute of Technology closed in 2016.
- Bryant & Stratton College reports the same data on employment outcomes for nine campuses in New York that are organized under the same OPEID.
- Empire Education Corporation reports the same data on employment outcomes for two Mildred Elley campuses in New York, which are organized under the same OPEID.
- The Center for Responsible Lending (“CRL”) recently found that undergraduate enrollment at New York for-profit colleges in disproportionately low-income (62 percent of enrollment at for-profits compared to 37 percent at nonprofits), African American (30 percent of enrollments for-profits compared at 14 percent for nonprofits), and female (67 percent of enrollment at for-profits compared to 55 percent at nonprofits). See CRL, The State of For-Profit Colleges: NY Report, December 1, 2017, http://www.responsiblelending.org/map/pdf/ny.pdf.
- Six of the ten institutions nationwide that have the highest success rate at launching students from the bottom 40 percent of family income to the top 40 percent of student earnings are public and nonprofit colleges in New York. Data set provided by Raj Chetty et al., “Mobility Report Cards: The Role of Colleges in Intergenerational Mobility,” July 2017, http://www.equality-of-opportunity.org/papers/coll_mrc_paper.pdf.
- National Center for Educational Statistics (NCES), “Repayment of Student Loans as of 2015 Among 1995–96 and 2003–04 First-Time Beginning Students,” October 2017, https://nces.ed.gov/pubs2018/2018410.pdf.
- This survey includes longitudinal data sampled from over 12,000 students who first pursued higher education during the 2003-2004 academic year. Id.
- The most recent cohort default rate data were released September 2017 and show three-year default rates for students entering repayment in fiscal year 2014 (2013–2014). These data on cohort default rates were incorporated into College Scorecard data files with schools reporting a single default rate for all campuses associated with each unique OPEID.
- Calculations by TICAS using data from the U.S. Department of Education, 2003–04 Beginning Postsecondary Students Longitudinal Study. Throughout this section, figures referencing long-term defaults reflect a share of all undergraduate students—including borrowers and non-borrowers—who enrolled in college for the first time in 2003–04 and at a New York school. This calculation reflects whether students who borrowed federal student loans defaulted on those loans within twelve years of first enrolling in college and categorizes students based on the type of institutional control at the first college they attended. For additional information on this calculation, see Figure 2.
- This calculation and calculations for Figures 3-5 reflect undergraduate students enrolling in New York colleges for the first time in 2003–04, whether they had attended a for-profit college by 2009, and whether they defaulted on their federal student loans within twelve years of enrolling in college. For additional information on this calculation, see Figure 3.
- “If not for students later attending for-profits, community college entrants would have lower default rates than public four-year entrants.” Judith Scott-Clayton, “The looming student loan default crisis is worse than we thought,” Brookings Institute, Jan. 2018, https://www.brookings.edu/wp-content/uploads/2018/01/scott-clayton-report.pdf.
- See Figures 4 and 5.
- For additional information on this calculation, see Figure 4.
- African American and/or black students comprise 30 percent of enrollments at for-profit colleges in New York compared at 14 percent of enrollments at nonprofit colleges.
- Following an investigation, the U.S. Senate committee charged with oversight of higher education found that “many for-profit education companies . . . commit significant resources to default management efforts that keep students out of default for the duration of the [3-year] monitoring window.” As a result of these schools’ “default management” strategies, short-term default data may undercount true levels of financial distress among students. U.S. Senate Committee on Health, Education, Labor and Pensions (HELP), “For-Profit Higher Education: The Failure to Safeguard the Federal Investment and Ensure Student Success” at 9, July 30, 2012, https://www.gpo.gov/fdsys/pkg/CPRT-112SPRT74931/pdf/CPRT-112SPRT74931.pdf.
- Throughout this section, short-term default calculations are based on the most recently available cohort default rates, which were released September 2017, show three-year default rates for students entering repayment in fiscal year 2014, and are are available in the 2014–15 College Scorecard data file. For additional information on this calculation, see Figure 5.
- Student default risk is calculated as a college’s three-year cohort default rate multiplied by the share of the school’s students who borrow. By incorporating the share of students who borrow, the student default risk more accurately conveys a student’s likelihood of defaulting after attending a given school. For instance, if only two out of 100 students at a college borrow, the fact that one of them defaults may not represent problems with the educational value received by the other 99 students, who attend without needed to go into debt. For more information about the Student Default Risk Indicator (SDRI), see TICAS, Using a Student Default Risk Index (SDRI) to Improve Institutional Accountability and Reward Colleges, 2013, https://ticas.org/sites/default/files/pub_files/Student_Default_Risk_Index.pdf.
- For additional information on this calculation, see Figure 2.6.
- In 2015, Career Education Corporation announced the closure of all three Sanford-Brown Institute campuses in New York.
- In 2015, EDMC announced the closure of The Art Institute of New York City.
- Bryant & Stratton College reports the same data on student borrower and default rates for nine campuses in New York, which are organized under the same OPEID.
- ITT reported the same data on student borrower and default rates for three campuses in New York, which were organized under the same OPEID.
- Briarcliffe College reports the same data on student borrower and default rates for two campuses in New York, which are organized under the same OPEID. CEC has announced that Briarcliffe campuses in New York will close in 2018.
- Julie Menin is quoted here by Elizabeth A. Harris, “New York City Consumer Agency Investigating Four For-Profit Colleges,” The New York Times, April 2, 2015, https://www.nytimes.com/2015/04/03/nyregion/new-york-city-consumer-agency-investigating-four-for-profit-colleges.html.
- A school’s expenditure on “instruction” is defined to include, among other things, academic, occupational, and vocational instruction and related administrative expenses.
- Throughout this section, tuition receipts and instructional expenditure calculations are based on 2015 IPEDS data—as published in College Scorecard data—averaged first at the OPEID level and then by institution type as described below. Averages are based on annual tuition receipts and instructional spending by colleges per each full-time equivalent (FTE) enrollment. For more information on this calculation, see Table 4.
- For the following calculations, where multiple New York campuses reported federal data under a single OPEID, figures were first averaged at the OPEID level and then OPEID-level data was used for further calculations.
- Public programs spend $2.15 for every dollar of tuition revenue on instruction, a tuition value ratio made possible by underlying appropriations that support the colleges’ operations under the guidance of public appointees.
- See note 16.
- For example, a recent study found that 51 percent of students who enter the State University of New York at Stony Brook from the bottom quintile of family income go on to reach the top quintile based on their earnings after attendance, and furthermore, “many campuses of the City University of New York (CUNY) . . . have very high mobility rates.” Raj Chetty et al., “Mobility Report Cards: The Role of Colleges in Intergenerational Mobility” at 3, July 2017, http://www.equality-of-opportunity.org/papers/coll_mrc_paper.pdf.
- See figures 4 and 5.
- According to the Education Trust, the funding gap between K–12 public investment in high-poverty and low-poverty schools in New York is among the most regressive among states.
- Calculations for race and ethnicity and first-generation college students are based on 2015 IPEDS data—as published in College Scorecard data—averaged at the OPEID level. Pacific College of Oriental Medicine—ranked among the worst schools for student outcomes— is the sole exception black and hispanic students as 32 percent of enrollments and first-generation college students as 38 percent of enrollments in 2015. For additional information on this calculation, see Table 5.
- U.S. ex rel Boyd v. Corinthian Coll., 14-cv-6620, Dk. 1, Complaint, filed August 27, 2014 (N.D. IL 2014).
- Morgan v. Richmond Sch. of Health and Tech.,12-cv-00373, Dk. 54, Pl. Mem. in Opposition to Def. Motion to Dismiss, filed July 13, 2012 (E.D. VA 2012).
- Meral Agish et al, “Counterfeit Ed,” NY City News Service, http://counterfeited.nycitynewsservice.com/.