
Health care in this country is unaffordable, even for people who have insurance coverage. About half of insured adults in the United States have difficulty affording the health care they need. A 2022 poll by the Kaiser Family Foundation found that 47 percent of insured, non-elderly adults find it somewhat or very difficult to afford health care costs.1 The same poll found stark divides in who has trouble affording care: Black and Hispanic adults were both much more likely than white adults to struggle to afford care, and lower-income adults were more than twice as likely as wealthier adults to face affordability challenges.2 Recently, high inflation rates have only further compounded this issue by driving up prices for all goods, squeezing household budgets and the funding available to pay for health care services.3
High cost of commercial health care not only impacts individuals, but also state budgets, because of increasing lost tax revenue for employer-sponsored insurance as well as the insurance spending for state employees.4 Employer contributions to insurance premiums are tax-deductible, which means that as costs increase, state revenues decrease, and increased state spending on health care means fewer state dollars are spent on other programs.
Many states have taken efforts to address the high cost of care. This report is part of a forthcoming series that explores how states that are seeking to lower the cost of care can also advance health equity as part of that effort, including throughout the design process, rather than as an afterthought. This particular report focuses on cost-growth benchmarks. It begins by providing background on the factors that have driven unsustainable increases in the cost of health care and how the burden of unaffordable care falls disproportionately on marginalized communities. It ends by providing policy recommendations for states planning to implement cost-growth benchmarks that will enable them to better promote health equity in design, implementation, and execution.
The Cost of Care Has Been Steadily Rising
The cost of health care in the United States has steadily risen for the past several decades. In 1970, total national health expenditures for the United States was around $74 billion, and that number rose to nearly $4.3 trillion by 2021.5 Even accounting for inflation, total spending has risen by nearly ten times, from around $400 billion in 1970 in 2021 dollars.6 National health expenditures as a percentage of gross domestic product hit an all-time high at 18.3 percent in 2021.7
The cost of care has two components that can drive increases: price and utilization. Much of this recent rapid increase in the cost of health care has been driven by increases in price, not increases in the use of health care services; and much of these increasing prices are, in large part, driven by increases in market power. Hospital and physician services drive about half of all health spending in the United States, and much of the U.S. provider system is now highly concentrated under Federal Trade Commission standards, giving providers significant power to charge unaffordably and unsustainably high prices.8 The literature is clear: provider consolidation consistently increases prices with little to no impact on quality.9
The literature is clear: provider consolidation consistently increases prices with little to no impact on quality.
Much of the increase in health care spending has been taking place in the commercial insurance market. Between 2008 and 2021, the average per capita spending by private insurers increased by more than 54 percent.10 Public insurance spending grew much less quickly: Medicare spending per capita only rose by around 37 percent over that same time period, and Medicaid spending per capita grew by less than 20 percent.11 Figure 1 shows this growth over time. This slower growth is likely due to the fact that Medicare and Medicaid both have much more direct regulation of provider prices. As a result, providers have far less power over how quickly prices increase.
Figure 1
The high cost of care also affects state budgets. While Medicaid spending has grown less quickly than other insurance types, state employee insurance benefits have also grown quickly due to rising health care costs, and high health care prices still draw down resources—especially budgetary resources—that could be used to better promote health through other state programs. The pattern creates a destructive feedback loop, because a significant portion of overall health is driven by social determinants of health, non-clinical factors such as safe housing, access to healthy foods, and reliable transportation.12 High health care costs require state budgets to spend a relatively greater percentage of their budgets on medical services, limiting their ability to fund these programs that may promote greater population health.
The Burden of High Cost Care Is Not Felt Equally
As health care costs have increased, spending by consumers have also increased as insurers pass these increased costs onto patients. In addition to a rise in premiums, insurers also increase consumer cost-sharing, such as copayments, co-insurance, and deductibles, which can make insurance practically unusable for many patients. From 2008 to 2021, commercial health insurance premiums for both individual coverage and family coverage increased by nearly two-thirds, and out-of-pocket spending (which does not include premiums) by patients has risen by more than one-third.13 Figure 2 shows this increase.
Figure 2
These high costs can have a real impact on patient outcomes, as well as the health system at large. More than 40 percent of U.S. adults reported that they or a family member delayed getting needed health care due to cost, according to a 2022 Kaiser Family Foundation poll.14 These delays can result in significantly worse outcomes for patients. For example, a study of hospitals in Massachusetts found that delays in accessing care were associated with hospital stays increasing by about 9 percent.15
Marginalized populations are the most likely to struggle to afford needed health care, and accordingly to bear the brunt of the associated health impacts. Multiple studies have found that people of color disproportionately struggle to afford health care: a 2022 report by the Department of Health and Human Services found that Black adults were 50 percent more likely than white adults to report problems paying medical bills.16 A 2022 survey by the Kaiser Family Foundation found similar results, with Black adults being around 54 percent more likely than white adults to say it was very or somewhat difficult to afford their health care costs.17 The same survey found even more striking results among Hispanic adults, who were around two-thirds more likely to report that it was very or somewhat difficult to afford their health care costs.18
The high cost of health care also contributes to higher levels of medical debt. Around 40 percent of U.S. adults have some amount of medical debt, and nearly 60 percent have had some form of medical debt in the last five years.19 Even insured patients are not immune: around 44 percent of non-elderly adults hold some medical debt.20 The level of debt can vary significantly, from around 16 percent of those with debt owing less than $500 to around 12 percent owing $10,000 or more.21
Around 40 percent of U.S. adults have some amount of medical debt, and nearly 60 percent have had some form of medical debt in the last five years.
People of color were also more likely to hold medical debt than white people. Another 2022 Kaiser Family Foundation survey found that 56 percent of Black adults and 50 percent of Hispanic adults currently held medical debt, compared to only 37 percent of white adults.22 Black adults were also significantly more likely to report worries over ever paying off medical debt and significantly less likely to report expecting to pay back debt within a year.23 Figure 3 illustrates these disparities.
Figure 3
There are multiple reasons why we see these kinds of disparities occurring along socio-demographic lines, including that people of color have been the subject of the structural discrimination built into U.S. policies, which has resulted in poorer access to the types of health care coverage that would protect them from some of these expenses. Structural discrimination in our policies has also prevented disadvantaged groups from growing the savings needed to help with paying deductibles and other health care expenses. For example, people of color were more likely in 2021 to enroll in silver marketplace plans (one that covers around 70 percent of estimated health costs) than white people, and white people were nearly three times as likely to enroll in a gold plan (one that covers around 80 percent of estimated health costs) than Black people.24 American Indian/Alaska Natives were even more likely to enroll in a low-value plan, with more than half of this group enrolling in a bronze plan (a plan which only covers around 60 percent of estimated health costs) in 2021.25
LGBT people are also more likely to report struggling to afford health care than non-LGBT people, in part because of discrimination in employment and education, which has meant poorer access to higher-paying employment and more generous health care coverage. A recent study published in Health Affairs found that LGBT people were about 30 percent more likely to have trouble paying a medical bill and about 40 percent more likely to have gone without needed medical care because they could not afford it, as compared to straight, cisgender people.26 A survey by the Center for American Progress in 2022 found that transgender and nonbinary people were about twice as likely as cisgender people to have postponed or not tried to get medical care due to cost.27
Place-based disparities in health care affordability also exist. Rural communities tend to have uninsured rates that are about 2–3 percentage points higher than urban communities. Geographic isolation and low population density, combined with volume-based payment models, often result in a vicious cycle of low-volume rural hospitals increasing prices to attempt to maintain financial solvency, which in turn further decreases patient affordability. While other factors certainly impact rural health affordability, the impact of prices cannot be ignored.28
Cost-Growth Benchmarks Can Slow Price Increases
One tool that states can use to address the high and rising costs of care are cost-growth benchmarks. The goal of a cost-growth benchmark is to limit how quickly a state’s total health care spending grows in a given year.29 Multiple states have enacted cost-growth benchmarks, starting with Massachusetts in 2012.30 Since then, eight other states31 have enacted similar policies.32 Table 1 highlights the differences between these benchmarks, as well as the benchmarks that have been set for 2023. The table outlines the year a benchmark program was established, whether it has the ability to enforce compliance with the benchmark, whether the state measures quality metrics in addition to spending growth, and the state’s benchmark for 2023.
Table 1
| STATE COST-GROWTH BENCHMARKS | ||||
| Year Established | Enforcement Authority | Quality Measurement | 2023 Benchmark | |
| Massachusetts | 2012 | Yes | Yes | 3.60% |
| Delaware | 2018 | No | Yes | 3.10% |
| Oregon | 2019 | Yes | Yes | 3.40% |
| Rhode Island | 2019 | No | No | 3.20% |
| Connecticut | 2020 | No | Yes | 2.90% |
| Washington | 2020 | No | No | 3.20% |
| Nevada | 2021 | No | No | 2.98% |
| New Jersey | 2021 | No | Yes | 3.50% |
| California | 2022 | Yes | Yes | N/A |
Cost growth benchmark programs have been shown to be very effective at lowering health care spending, especially in the commercial market. Massachusetts has seen significant success at keeping its spending contained: in three of the seven years the program operated prior to the COVID-19 pandemic, spending growth in the state was below the benchmark.33 Even accounting for the years that the state did not meet its benchmark, average spending growth over the pre-pandemic period was lower than the national average over that same period.34
Other states that established cost-growth benchmarks more recently have also shown some success in constraining spending growth. For example, Delaware set a goal of 3.5 percent in 2020 and 2021.35 While it did not meet this goal, spending growth over this period averaged around 4.9 percent, lower than the increase of 5.8 percent in 2019.36 Rhode Island’s results are even more impressive. The state set a goal of 3.2 percent beginning in 2019;37 spending growth over 2020–2021 was kept to only around 0.1 percent.38
It is important to note the impact that the COVID-19 pandemic had on efforts to contain health spending. Due to the restrictions put in place to prevent the spread of COVID-19, health care utilization dropped precipitously, resulting in significantly lower spending. Similarly, as people accessed care in 2021 they were unable to in 2020, health care utilization and spending rose sharply. Evaluating these two years as one time period helps control for this trend. Spending and access trends will need to be carefully monitored in the near future to collect a more complete impact of the COVID-19 pandemic on health care prices.
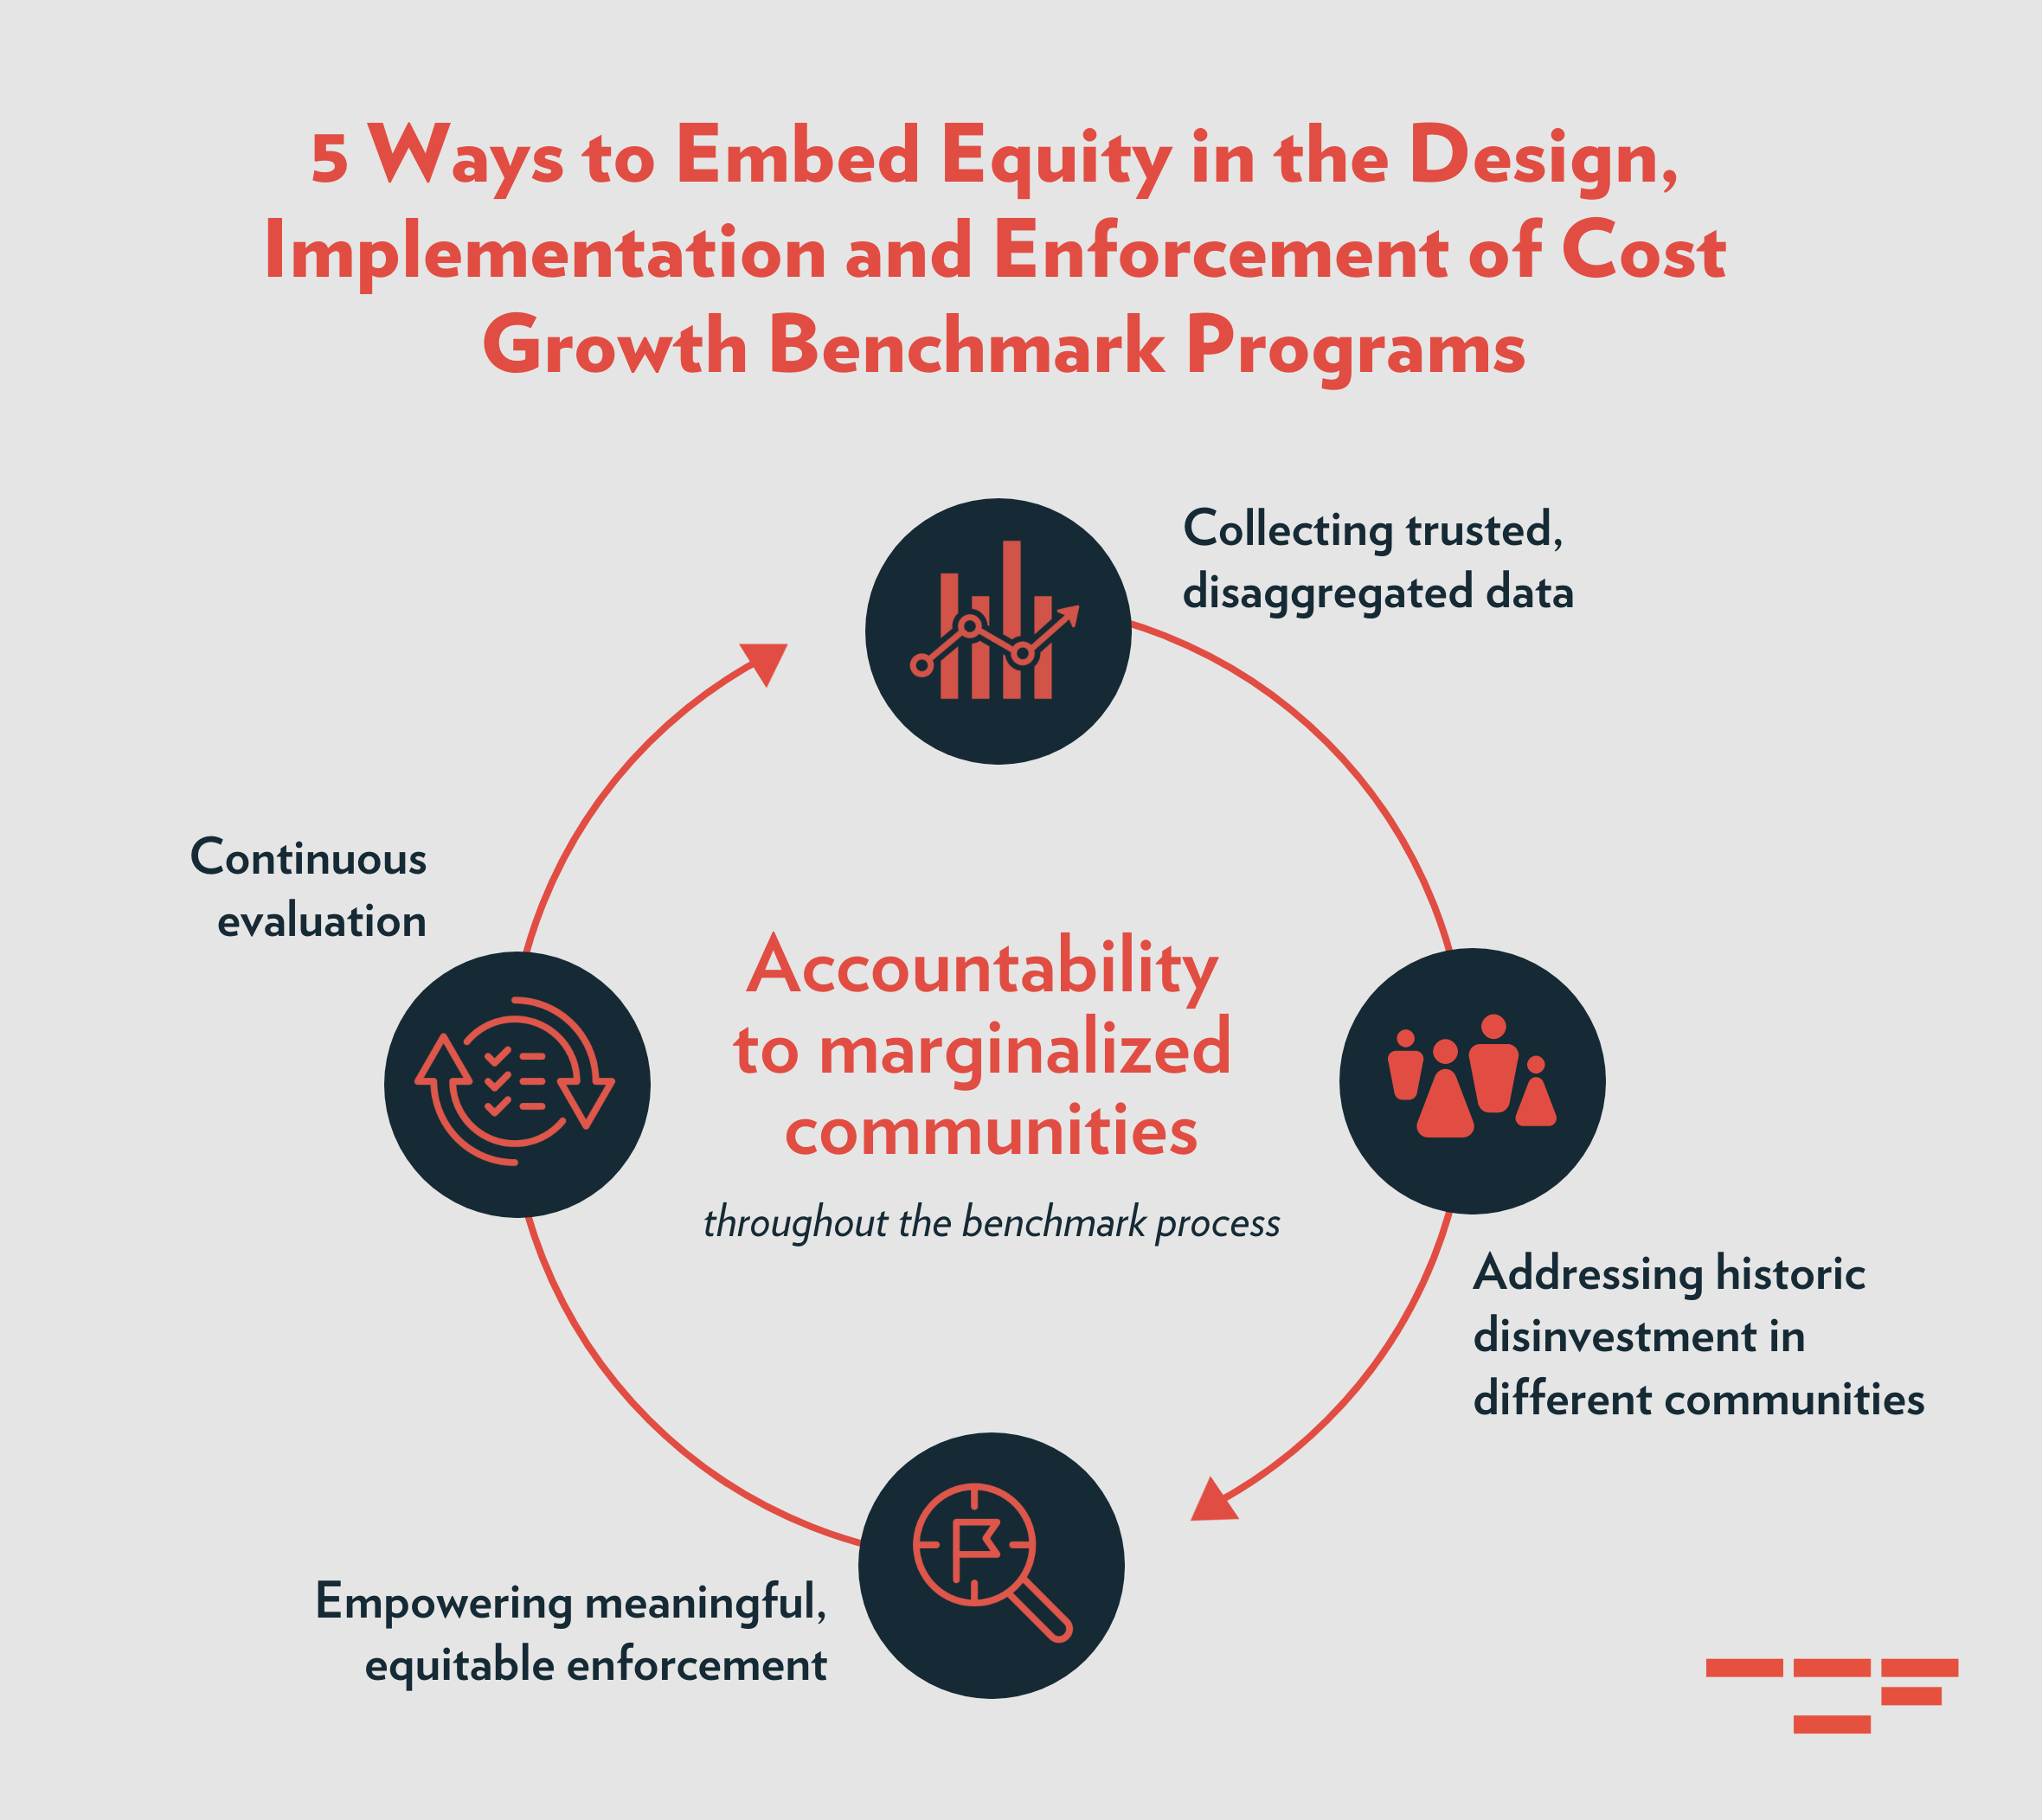
Five Ways to Embed Equity in Cost Growth Benchmark Programs
The focus of this report is to showcase opportunities to promote equity in the design, implementation, and enforcement of a cost-growth benchmark. Simply lowering the cost of care is insufficient to ensure that cost-growth benchmarks advance equity. In fact, efforts to lower health care spending through a benchmark could result in less care being provided to patients, especially to historically underserved populations. Without intentional effort, state regulators could further entrench both existing health inequities and inappropriate spending trends. Advancing equity can and should be an explicit goal of any cost-growth benchmark program at each design point. In what follows, we discuss five ways states can advance equity while enacting cost-growth benchmarks:
- Including accountability to marginalized communities throughout the benchmark process;
- collecting trusted, disaggregated data to inform decisions;
- addressing unequal historic investment in different communities;
- empowering meaningful, equitable enforcement of benchmark goals; and
- continuously evaluating spending and quality impacts.
Include accountability to marginalized communities throughout the benchmark process.
One of the first decisions that a state will make is on who will make recommendations and decisions on the program’s behalf, during the design process as well as after implementation. Many states have designated an advisory group in this role. For example, Connecticut created a stakeholder advisory board to help inform the development of its cost-growth benchmark, as well as the development of metrics, such as quality benchmarks and provider performance.39 Connecticut’s board included state officials, insurance representatives, academics, and patient representatives.40 Nevada, on the other hand, empowered an already existing agency—the Patient Protection Commission—to carry out its benchmark program.41
To prioritize equity during program design, it is important to ensure that community members and/or community based organizations that are accountable to and trusted by marginalized communities—such as grassroots groups and consumer advocates—are part of the process. States have a few different ways in which they can do so. One option is to have a community advisory group, and another is to include substantive consumer representation on the overall design advisory group. In either case, it is important that consumer participation in the group is fully supported and respected and that everyone on the advisory group(s) be full, non-tokenized members. In order to fully participate, this might mean providing material, financial support with child care, transportation, and access (including relevant technology, such as computers) to documents that are being discussed, as well as assurance that all terms are non-jargon and easy to understand.
It is also important to prioritize ensuring that everyone participating in the group understands their role and feels recognized for the expertise they are bringing. Not everyone in the group will be an expert in health care costs, but, for people representing the needs of underserved communities, these members can provide the context for the affordability problem in the state, what it means for their communities, and what a successful initiative looks like from their perspectives. Trust among group members and trust in the process is also critical, so it is important that these groups have time and space for building relationships, and that their development be well-facilitated.
Trust among group members and trust in the process is also critical, so it is important that these groups have time and space for building relationships, and that their development be well-facilitated.
Consumer advocates—whether part of a separate advisory group or part of a larger group—must have the opportunity to help set the agenda. These members will be able to provide unique insight into the affordability problems marginalized communities face, as well as raise any design, implementation, and enforcement concerns they might have. For example, they could be able to provide unique insight into the impact that cost-sharing has on their communities. In order to ensure that advocates are able to provide input, states should consider establishing multiple positions for consumer input, or even requiring a minimum percentage of advisory board members to be consumer representatives, as the Biden administration has recently proposed for Medicaid Advisory Committees.42
There are a few aspects of ongoing state initiatives that can be looked to for examples. In Virginia, the values and principles established by the state’s Medicaid Member Advisory Committee provide a great example, including norms such as “wanting to be hard on the problem, not hard on each other” and prioritizing time to get to know each other in the meeting.43 The charter for the Oregon Health Policy Board also explicitly names equity as a key focus of the committee and notes, “We consider the diversity of Oregon’s communities as we make decisions about how policy and practices are developed, and how resources are distributed.”44
One key aspect of any cost-growth benchmark advisory committee is that health equity be explicitly named as central to the mission and vision for the cost benchmark plan. For example, the Connecticut Healthcare Benchmark Initiative Steering Committee’s mission statement is, “We collaborate, out of a shared concern and responsibility for all Connecticut residents, to develop consensus models that advance equity and consumer affordability of healthcare in our state.”45
Collect trusted, disaggregated data to inform decisions.
Another critical decision point for states will be the sources of data that are used to inform what makes up the denominator for the cost-growth benchmark and the numerator. To advance equity, it will be important that the data sources be transparent and trusted across the state. This way, the data can be used not only to inform the cost-growth benchmark, but also to improve and inform policy conversations about health equity more broadly, such as health equity impact assessments for other policy proposals.
One option states have in how they collect information on health spending is an all-payer claims database (APCD).46 APCDs are transparent and can address all claims-based spending across a state. One of the most important ways that a cost-growth benchmark can and should make an impact in the state is by providing a holistic picture of health care spending that can be seen, discussed, and addressed with an equity lens. The only way to do this is by having trusted, transparent, accessible, reliable data sources. It is important that the design committee carefully consider the data source and how the data are used to inform the benchmark, reporting, and analysis.
One challenge with APCDs is that in many states they are voluntary and, even if states do require reporting, they are legally not allowed to require reporting of self-insured plans.47 Similarly, managed care payments are not necessarily “claims” and may not be reflected in APCD data. Therefore, even these data might provide an incomplete picture of what is happening in the state in terms of spending. Using multiple data sources may allow for a more comprehensive view of spending in their state.
States will need to consider which insured populations to include in the state benchmarking data. To be more comprehensive, especially in terms of equity, states may wish to include populations enrolled in the Correctional Health System, the Veterans Health Administration, TRICARE, and the Indian Health Service, as well as uninsured patients. The advantage of including these populations is that it will provide a more comprehensive picture of care in the state, especially for the groups that have been most marginalized.48 One challenge, however, is that care in these programs is administered separately, which makes a standard comparative analysis to look at spending drivers difficult.
It is also important that states use disaggregated data for these data sources to ensure that different communities are not impacted inequitably. Ensuring that APCDs or other data sources are disaggregated by race and ethnicity will help ensure that any disparate impact that efforts taken to achieve a cost-growth goal is identified early and addressed. This may require concerted efforts to disaggregate spending data, as previous TCF research has highlighted. States should also use these data to address particular sources of health disparities in their state, such as by immigration status or rural access to care.
Address unequal historic investment in underserved communities.
Once data sources are chosen, there will be several choices for the state to make about the implementation of cost-growth benchmark and whether or not it applies universally across all markets and settings. In terms of equity, this will be an important point of discussion for the advisory group: its members must ensure they understand the different access and affordability needs throughout the state.
The difference between equity and equality is crucial here, as what will be needed is a targeted, rather than “one size fits all,” approach. Some parts of the market, for example in rural areas, primary care or maternity care settings, may require an investment in resources before the cost growth benchmark is applied.49 Other health care settings may need to be treated differently under a cost growth benchmark because of the population they serve and concerns about needing additional resources. For example, Black Americans have accessed less care than white Americans for many decades due to structural barriers, and this trend persists even among commercially insured people.50
By allowing for different levels of spending growth, regulators can contain cost growth among populations that have historically had significant access to care while avoiding unintended reductions in access. Again, it will be important that these decisions be made based on trusted, transparent data and in the context of the lived experiences of community members and organizations that represent and are accountable to their interests. Under both approaches, the overall value of health care spending will be improved. Containing growth for services with historically high growth while allowing for increased investment in underserved settings helps to incorporate value of spending with an equity lens.
California’s cost-growth benchmark has levers in place to help achieve this goal. Under California’s approach, the state’s Health Care Affordability Board can develop targets that treat different geographic regions or health care delivery systems differently.51 These sector-specific targets, however, are not required to be in place until 2029 at the earliest, several years after the state’s broader, statewide target.52 Other states seeking to take a similar nuanced approach should consider building this authority into an advisory group’s purview from the outset.
Another aspect of implementation critical to health equity is that the governing board of the cost growth benchmark work closely with other parts of the state focused on health equity issues, which will help facilitate collaboration on developing relevant solutions and addressing challenges. This work would enable the cost-growth benchmark to take advantage of existing expertise on and knowledge of drivers of health disparities within a state, as well as any efforts to close them.
Empower meaningful, equitable enforcement of benchmark goals.
Equitable enforcement is essential to the success of the cost-growth benchmark in lowering costs and advancing equitable access to care. This means holding systems accountable to meeting the cost-growth benchmark without hurting access to care and affordability for patients. There are a variety of ways states can hold providers accountable without jeopardizing patient access.
A starting method that states should take advantage of is the power of public pressure. Simply naming the health care entities—especially large, consolidated hospitals—that fail to meet the goals of a benchmark can be an effective way to spur change. For example, part of California’s enforcement strategy is a requirement that health care entities publicly explain their failure to meet the goal of the benchmark.53
“Naming and shaming” alone, however, is unlikely to sufficiently drive health providers to lower their prices, and a more direct approach may be necessary. This might mean using a performance improvement plan (PIP). The Massachusetts Health Policy Commission is able to require that a health care entity submit a PIP if it finds that it has unwarranted patterns of contributing to high health spending.54 Since 2013, only one entity has been required to submit a PIP, highlighting the impact that just the threat of enforcement can have on spending trends.55 States may also consider requiring entities placed on PIPs to be clear on how they will balance strategies to reduce spending with efforts to maintain quality of care and access for populations experiencing health inequities.
Similarly, California’s enforcement mechanism also includes escalating penalties that increase commensurately with failure to meet the benchmark.56 This escalation is critical: one widely criticized aspect of Massachusetts’ approach is the statutory limitation on penalties, regardless of the extent to which a health care entity did not meet a spending growth target, potentially allowing states to continue to profit, even after a penalty is put in place.
However, states should also consider the factors that may lead to increased spending. For example, if a hospital exceeds spending due to increased access to care for populations that have historically been unable to access care, regulators should treat this growth differently, as discussed above. Similarly, states should work with hospitals to ensure they do not respond to penalties by reducing patient access to care, especially for marginalized communities.
Additionally, states should hold providers accountable for ensuring that lower spending is not achieved through reduced access. Beyond simply applying the enforcement mechanisms to providers that fail to meet spending targets, states should also apply them to providers which fail to maintain equitable access for patients. These enforcement mechanisms can apply many of the approaches described above, such as including a plan to rectify access for different populations as part of a PIP or escalating penalties in accordance with the level of reduced or inequitable access to care.
It will be important for states to be clear with health care systems that they are required to follow these benchmarks and that they cannot skimp on care in order to do so. This is a key part of where trust will be garnered and fostered with patients, especially people who are less inclined to trust the state based on experience.57
Continuously evaluate spending and quality impacts.
Finally, ongoing evaluation of a cost-growth benchmark’s impacts on both spending and quality is essential to advancing equity. A key factor of this process will be the quality metrics chosen to ensure that the benchmark is not hurting access and affordability in the state, especially for marginalized communities. It will be important to include multiple metrics of quality, agreed upon by the advisory group, that includes representation of issues of utmost importance to different populations and that have been prioritized by community members, including consumer affordability metrics. One example, recognizing that sickle cell is a particular concern for Black people, is understanding process and outcome measures for sickle cell treatment before and after cost growth implementation.
Researchers at Bailit Health have developed a useful framework for determining quality measures,58 which use health status, population-level health, patient experience, health care access, and cost measures. A mix of all of these types of measures is essential to ensuring that spending reductions are balanced with continued access to care, especially for marginalized groups. It will also be important to look at measures that indicate challenges with care or workforce stability, such as preventable hospitalizations stratified by different populations or patient experience data, also stratified in as granular a way as possible.
For example, Oregon’s cost-growth benchmark program prioritized identifying and addressing unintended consequences, such as impact on preventive care services and screenings, access to care (including telemedicine), and stability of the health care workforce.59 Connecticut’s Unintended Adverse Consequences Measurement Plan includes implementing measures with a focus on intersections of identities, such as changes in utilization for communities of color in the lowest income zip codes by service category.60 Another example is the California Office of Health Care Affordability, which is required to monitor workforce stability “…with the goal that workforce shortages do not undermine affordability, access, quality, equity, and culturally and linguistically competent care.”61
While one of the opportunities of cost-growth benchmark quality information monitoring is an increase in transparency about spending and outcomes, there is a risk of the reported information being misinterpreted and making the health situation for people who have been most marginalized worse. Marginalized communities have reason to distrust the health care system for many reasons, including historic mistreatment, and disparities reporting has the potential to increase this mistrust.62
It will be important for states to engage with the advisory committee and community members to provide important context for the information being reported, so as to motivate action to address any disparities and not to exacerbate mistrust. Several states have created communications guides to help with communicating challenges and opportunities related to health equity clearly. For example, Massachusetts’ style guide for applying an equity lens to communications and internal documents highlights the importance of accurately highlighting racism, rather than race, as the driver of disparities between racial groups.63 Similarly, the Oregon Department of Human Services’ style guide recommends working with community partners to identify communication strategies to ensure that marginalized populations are best communicated with.64
Cost-Growth Benchmarks Can Advance Equity While Lowering Spending
The cost of health care has risen dramatically in recent decades in the United States, and this high level of growth is unsustainable. States have the tools necessary to address this high growth rate, and enacting a cost-growth benchmark that centers accountability to marginalized populations throughout the process can ensure that policies do so in a way that promotes, rather than hinders, health equity. Examining data from trusted sources in a disaggregated format, allowing for spending growth to address unequal historic investments in the health care system, and empowering meaningful, equitable enforcement of these benchmarks will promote responsible, sustainable spending growth that avoids deepening existing inequities in health care. Similarly, continuous evaluation of this program can ensure that these good intentions become a reality, in terms of equity as well as spending.
Acknowledgments
TCF would like to thank Rachel Block, Beth Capell, Ann Hwang, and Anthony Wright for their assistance in reviewing this report. Additional thanks to Arnold Ventures for their financial support of this work.
Notes
- Alex Montero et al., “Americans’ Challenges with Health Care Costs,” Kaiser Family Foundation, July 14, 2022, https://www.kff.org/health-costs/issue-brief/americans-challenges-with-health-care-costs/.
- Ibid.
- Mike Winters and Gabriel Cortés, “These 5 Charts Show How Much 2 Years of Inflation Have Really Cost You,” CNBC, April 14, 2023, https://www.cnbc.com/2023/04/14/charts-how-much-inflation-increased-since-2021.html.
- Maximillian Pany et al., “Price Regulation, Global Budgets, and Spending Targets: A Road Map to Reduce Health Care Spending, and Improve Affordability,” Kaiser Family Foundation, May 31, 2022, https://www.kff.org/health-costs/report/price-regulation-global-budgets-and-spending-targets-a-road-map-to-reduce-health-care-spending-and-improve-affordability/.
- Imani Telesford et al., “How Has U.S. Spending on Healthcare Changed over Time?,” Peterson-KFF Health System Tracker, February 7, 2023, https://www.healthsystemtracker.org/chart-collection/u-s-spending-healthcare-changed-time/.
- Ibid.
- “NHE Fact Sheet,” Centers for Medicare and Medicaid Services, September 6, 2023, https://www.cms.gov/data-research/statistics-trends-and-reports/national-health-expenditure-data/nhe-fact-sheet.
- Imani Telesford et al., “How Has U.S. Spending on Healthcare Changed over Time?”; Brent D. Fulton, Daniel R. Arnold, and Richard M. Scheffler, “Market Concentration Variation of Health Care Providers and Health Insurers in the United States,” The Commonwealth Fund, July 30, 2018, https://www.commonwealthfund.org/blog/2018/variation-healthcare-provider-and-health-insurer-market-concentration.
- Karyn Schwartz et al., “What We Know About Provider Consolidation,” Kaiser Family Foundation, September 2, 2020, https://www.kff.org/health-costs/issue-brief/what-we-know-about-provider-consolidation/.
- Telesford et al., “How Has U.S. Spending on Healthcare Changed over Time?”
- Ibid.
- “Social Determinants of Health,” World Health Organization, accessed October 20, 2023, https://www.who.int/health-topics/social-determinants-of-health#tab=tab_1.
- Telesford et al., “How Has U.S. Spending on Healthcare Changed over Time?”; “2021 Employer Health Benefits Survey,” Kaiser Family Foundation, November 10, 2021, https://www.kff.org/health-costs/report/2021-employer-health-benefits-survey/.
- Montero et al., “Americans’ Challenges with Health Care Costs.”
- Joel S. Weissman et al., “Delayed Access to Health Care: Risk Factors, Reasons, and Consequences,” Annals of Internal Medicine 114, no. 4 (1991): 325–31, https://doi.org/10.7326/0003-4819-114-4-325.
- “Health Insurance Coverage and Access to Care among Black Americans: Recent Trends and Key Challenges,” Office of the Assistant Secretary for Planning and Evaluation, February 22, 2022, https://aspe.hhs.gov/reports/health-insurance-coverage-access-care-among-black-americans.
- Montero et al., “Americans’ Challenges with Health Care Costs.”
- Ibid.
- Lunna Lopes et al., “Health Care Debt In The U.S.: The Broad Consequences Of Medical And Dental Bills,” Kaiser Family Foundation, June 16, 2022, https://www.kff.org/report-section/kff-health-care-debt-survey-main-findings/.
- Ibid.
- Ibid.
- Ibid.
- Ibid.
- D. Kenneth Branham et al., “HealthCare.Gov Marketplace Enrollment During the 2021 Special Enrollment Period by Race and Ethnicity,” Office of the Assistant Secretary for Planning and Evaluation, March 24, 2022, https://aspe.hhs.gov/reports/2021-sep-marketplace-enrollment.
- Ibid.
- Andrew Bolibol et al., “Health Insurance Coverage And Access To Care Among LGBT Adults, 2013–19,” Health Affairs 42, no. 6 (June 2023): 741–880, https://doi.org/10.1377/hlthaff.2022.01493.
- Caroline Medina and Lindsay Mahowald, “Discrimination and Barriers to Well-Being: The State of the LGBTQI+ Community in 2022,” Center for American Progress, January 12, 2023, https://www.americanprogress.org/article/discrimination-and-barriers-to-well-being-the-state-of-the-lgbtqi-community-in-2022/.
- “Healthcare Access in Rural Communities,” Rural Health Information Hub, November 21, 2022, https://www.ruralhealthinfo.org/topics/healthcare-access.
- Adney Rakotoniaina, “How States Use Cost-Growth Benchmark Programs to Contain Health Care Costs,” National Academy for State Health Policy, January 18, 2023, https://nashp.org/how-states-use-cost-growth-benchmark-programs-to-contain-health-care-costs/.
- Ibid.
- California, Connecticut, Delaware, Nevada, New Jersey, Oregon, Rhode Island, and Washington.
- Rakotoniaina, “How States Use Cost-Growth Benchmark Programs to Contain Health Care Costs.”
- “Health Care Cost Growth Benchmark,” Massachusetts Health Policy Commission, accessed November 3, 2023, https://www.mass.gov/info-details/health-care-cost-growth-benchmark.
- “2021 Annual Health Care Cost Trends Report,” Massachusetts Health Policy Commission, September 2021, https://www.mass.gov/doc/2021-health-care-cost-trends-report/download.
- “DHSS Releases Third Annual Health Care Benchmark Trend Report,” Delaware Department of Health and Social Services, April 6, 2023, https://news.delaware.gov/2023/04/06/dhss-releases-third-annual-health-care-benchmark-trend-report/.
- Ibid.
- “Annual Report: Health Care Spending and Quality in Rhode Island,” Rhode Island Office of the Health Insurance Commissioner, May 2023, https://ohic.ri.gov/sites/g/files/xkgbur736/files/2023-05/Health%20Care%20Spending%20and%20Quality%20in%20Rhode%20Island_FINAL%202023%2005.pdf.
- Ibid.
- “Healthcare Benchmark Initiative Stakeholder Advisory Board,” Connecticut Office of Health Strategy, November 17, 2020, https://portal.ct.gov/-/media/OHS/Cost-Growth-Benchmark/CGB-SAB-Information/Stakeholder-Advisory-Board–By-Laws.pdf.
- Ibid.
- “About the Patient Protection Commission,” Nevada Department of Health and Human Services, accessed November 3, 2023, https://ppc.nv.gov/About/About/.
- Thomas Waldrop, “Expanding Medicaid Beneficiary Input Will Improve Medicaid Program Value,” The Century Foundation, July 6, 2023, https://tcf.org/content/commentary/expanding-medicaid-beneficiary-input-will-improve-medicaid-program-value/.
- “DMAS Medicaid Member Advisory Committee Policies & Procedures,” Virginia Department of Medical Assistance Services, March 24, 2022, https://www.dmas.virginia.gov/media/4498/dmas-mac-policies-procedures.pdf.
- Oregon Health Authority, Accessed September 21, 2023, https://www.oregon.gov/oha/Documents/OHA-Core-Values.pdf.
- “Healthcare Cost Growth Benchmark Steering Committee Meeting May 22, 2023,” Healthcare Cost Growth Benchmark Steering Committee, March 22, 2023, https://portal.ct.gov/-/media/OHS/HBI-Steering-Committee/May-22-2023/Steering-Committee-meeting-15-2023-522.pdf.
- “All-Payer Claims Databases,” Agency for Healthcare Research and Quality, February 2018, https://www.ahrq.gov/data/apcd/index.html.
- Katherine Grace Carman et al., “The History, Promise and Challenges of State All Payer Claims Databases: Background Memo for the State All Payer Claims Database Advisory Committee to the Department of Labor,” Assistant Secretary for Planning and Evaluation, June 2, 2021, https://aspe.hhs.gov/reports/history-promise-challenges-state-all-payer-claims-databases-background-memo-state-all-payer-claims.
- Grace Flaherty and Deepti Kanneganti, “Ensuring Health Care Cost Growth Targets Promote Health Equity,” Milbank Memorial Fund, April 13, 2023, https://www.milbank.org/2022/04/ensuring-health-care-cost-growth-targets-promote-health-equity/.
- “Facilitators and Barriers to Advancing Health Equity in Rural Areas,” Rural Health Information Hub, accessed September 19, 2023, https://www.ruralhealthinfo.org/toolkits/health-equity/1/facilitators-and-barriers; “State Primary Care Investment Hub,” Primary Care Collaborative, accessed September 19, 2023, https://thepcc.org/primary-care-investment; Jamila Taylor et al., “Eliminating Racial Disparities in Maternal and Infant Mortality,” Center for American Progress, May 2, 2019, https://www.americanprogress.org/article/eliminating-racial-disparities-maternal-infant-mortality/.
- Samuel L. Dickman et al., “Trends in Health Care Use among Black and White Persons in the US, 1963-2019,” JAMA Network Open 5, no. 6 (2022), https://doi.org/10.1001/jamanetworkopen.2022.17383.
- “Office of Health Care Affordability (OHCA),” California Department of Health Care Access and Information, accessed September 19, 2023, https://hcai.ca.gov/ohca/.
- Ibid.
- “Get the Facts About the Office of Health Care Affordability,” Office of Health Care Affordability, October 25, 2022, https://hcai.ca.gov/get-the-facts-about-the-office-of-health-care-affordability/.
- “Performance Improvement Plans,” Massachusetts Health Policy Commission, 2023, https://www.mass.gov/info-details/performance-improvement-plans.
- Matthew Kitsos, “HPC Receives Performance Improvement Plan Proposal From Mass General Brigham,” Massachusetts Health Policy Commission, May 17, 2022, https://www.mass.gov/news/hpc-receives-performance-improvement-plan-proposal-from-mass-general-brigham.
- “Get the Facts About the Office of Health Care Affordability,” Office of Health Care Affordability.
- J. Corey Williams, “Black Americans don’t trust our healthcare system — here’s why” The Hill, August 24, 2017. https://thehill.com/blogs/pundits-blog/healthcare/347780-black-americans-dont-have-trust-in-our-healthcare-system/
- Deepti Kanneganti, Jessica Mar, and Michael Bailit, “Measuring Health Equity: A State Measure Set to Assess and Improve Equity,” State Health and Value Strategies, June 2023, https://www.rwjf.org/en/insights/our-research/2023/06/measuring-health-equity-a-state-measure-set-to-assess-and-improve-equity.html.
- “Sustainable Health Care Cost Growth Target: Implementation Committee Recommendations Final Report to the Oregon Legislature,” Oregon Health Authority, January 2021, https://www.oregon.gov/oha/HPA/HP/HCCGBDocs/Cost%20Growth%20Target%20Committee%20Recommendations%20Report%20FINAL%2001.25.21.pdf.
- “Healthcare Cost Growth Benchmark Steering Committee Meeting May 22, 2023,” Healthcare Cost Growth Benchmark Steering Committee, March 22, 2023, https://portal.ct.gov/-/media/OHS/HBI-Steering-Committee/May-22-2023/Steering-Committee-meeting-15-2023-522.pdf.
- “Office of Health Care Affordability (OHCA),” California Department of Health Care Access and Information.
- Stuart M. Butler and Nehath Sheriff, “How Poor Communication Exacerbates Health Inequities – and What to Do about It,” Brookings Institution, February 22, 2021, https://www.brookings.edu/articles/how-poor-communication-exacerbates-health-inequities-and-what-to-do-about-it/.
- “Applying a Health Equity Lens in Principle and Practice: Style Guide, Practices, and Resources for Bringing an Equity Focus to HPC Work Products,” Massachusetts Health Policy Commission, July 2023, https://www.mass.gov/doc/health-equity-practice-and-style-guide/download.
- “ODHS and OHA Writing Style Guide,” Oregon Department of Human Services, April 2023, https://sharedsystems.dhsoha.state.or.us/DHSForms/Served/me9412.pdf.