At a time when America’s economic outlook is uncertain, the nation’s unemployment insurance (UI) system currently is unprepared to handle another recession. Now that federal pandemic UI benefit programs have ended, leaving states as the primary benefit providers, The Century Foundation (TCF) is relaunching its Unemployment Insurance Data Dashboard, as well as launching a new tool, the Unemployment Insurance and Racial Equity Explorer, to track the ability of state UI programs to respond to economic distress.
This examination of states’ preparedness for an employment crisis comes at a critical moment. Federal policymakers demonstrated the economy-preserving value of robust unemployment insurance benefits when they responded in an aggressive and unprecedented manner to the major wave of job losses that came at the onset of the COVID-19 pandemic. Federal benefits covered workers who fell through the big holes in state unemployment insurance programs, such as the lack of eligibility for gig workers, low-wage workers, part-time workers, and women with caregiving responsibilities, and made up for inadequate payouts that disproportionately impacted people of color. But all of these benefit expansions were temporary, and Congress did nothing to require or incentivize states to replicate these more robust benefits at the state level. The slowdown in economic growth occurring throughout 2022 serves as a reminder of the vulnerability of the current job market to aggressive interest hikes. If layoffs were to increase, state unemployment benefit programs would stand alone in trying to support families and prop up the economy.
These data tools reveal just how threadbare the baseline of support available through state UI programs has become and the urgent need for federal and state policymakers to improve the safety net before—or at the latest, when—the next set of job market challenges occur. The cause for concern over state UI programs becomes clearer when considering the following information currently revealed by TCF’s data tools:
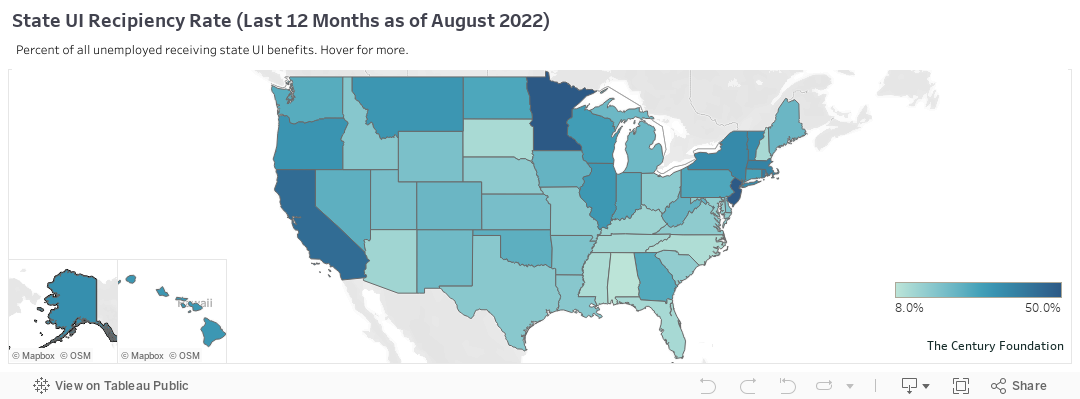
- The share of jobless workers actually receiving UI benefits has shrunk dramatically, with just 26.8 percent of those out of work receiving state unemployment benefits in the twelve months ending August 2022, down from a 41 percent recipiency rate during the financial crisis in 2009 and a 76 percent recipiency rate through early 2021.
- Furthermore, UI benefits are not going as far as they used to. In the first quarter of 2022, the average weekly UI benefit payment of $347.22 only replaced 39 percent of the average wages that had been earned each week ($883.43) by those accessing benefits. A year earlier, the combined payout from state benefits and the $300 per week Federal Pandemic Unemployment Compensation program totalled $617.36, which means federal and state UI benefits at that time equaled 79 percent of pre-layoff wages.
- As TCF’s Unemployment Insurance and Racial Equity Explorer illustrates, there are major differences in UI benefits state to state, which have huge equity implications when viewed through the lens of racial differences in state populations. Of the ten states with the largest Black population share, four are in the bottom ten ranking in terms of their UI benefit’s wage replacement rate. These states include Louisiana, with a 31 percent Black population and where the average weekly benefit of $186 only replaces 28.7 percent of wages.
- States have not fixed the problems that plagued the administration of their UI programs and severely limited the effectiveness of their response to the spike in joblessness during the pandemic. Use of the TCF data dashboard demonstrates that, despite the inflow of new UI applications plummeting to the lowest level in five decades, states are not meeting basic federal guidelines for timely payments of benefits. As of August 2022, for example, only fifteen states met the requirement to pay out at least 87 percent of eligible UI claims within twenty-one days. Similarly, workers are on average waiting nearly four months to have their appeal of a denial of benefits settled—that’s four times longer than the minimum federal standard.
About the Dashboard and Explorer
This relaunch of TCF’s Unemployment Insurance Data Dashboard marks the return of a popular tool for assessing the performance of state UI programs. During the COVID-19 pandemic, TCF created the landmark Pandemic Unemployment Insurance Data Dashboard, which was launched in October 2020 to continuously chronicle how well the UI system, infused with federal funds, functioned throughout the pandemic. (The Pandemic Unemployment Insurance Data Dashboard is still available in archived form.)
This 2.0 version of the Unemployment Insurance Data Dashboard looks at the current, ongoing performance of state unemployment insurance programs and examines their readiness to respond to any future economic downturns.1 The new dashboard includes more than one hundred maps and charts of unemployment insurance indicators for each state over time, which allow for comparisons between the states in benefit levels, timeliness, administration, financing, and recipiency. The dashboard analyzes data reported by the states to the U.S. Department of Labor on these topics, including official performance measures and new metrics developed by The Century Foundation. The analysis of the data answers the following questions:
- How well does UI work? The dashboard includes data on what percent of claims are denied, as well as how long it takes to pay benefits to eligible workers, settle claims disputed by employers, and process appeals of decisions. These include core federal performance standards on which states are judged by the federal government.
- How much does UI pay? The dashboard includes data covering the average and maximum unemployment benefit amount in each state, as well as what percentage of workers’ prior wages are replaced by these benefits.
- How many are getting UI? The dashboard includes data detailing current applicants and recipients of state UI benefits, what share of the unemployed collect them, and how many recipients exhaust benefits before finding a job. Information is displayed as raw figures and per-capita, not seasonally adjusted.
- How is UI financed? Each state is responsible for financing its own benefits through state taxes and a state trust fund. The dashboard includes data on whether state trust funds stack up to national standards and the average tax rate on employers.
The differences in state unemployment insurance programs have roots in historical racial inequality. To add to understanding of the current relationship between race and the unemployment system, this version of the project also includes the Unemployment Insurance and Racial Equity Explorer. This explorer allows users to compare differences in the racial composition of the state labor force with the state’s access and adequacy of unemployment benefits.
Lastly, the dashboard includes a new fact sheet function, which is housed in the Racial Equity Explorer. This function generates a customized state fact sheet comparing variables chosen from the database to all neighboring states. This tool will be especially useful for state policy makers looking to see how the costs and benefits of their state’s unemployment system stack up to others in their regions of the country.
The Pandemic Demonstrated the Value of a More Robust Safety Net
During the pandemic, Congress passed the CARES Act, which substantially increased access to UI and raised benefits levels. The supplemental benefits provided by Congress in addition to state UI benefits helped increase replacement rates so that, among benefit recipients, nearly all of an average worker’s weekly wages were replaced. Additionally, workers who have historically been excluded from UI, such as self-employed workers, gig workers, and workers with low-wages, were eligible under Congress’ expanded UI program, Pandemic Unemployment Assistance (PUA), during the pandemic. The expanded eligibility under PUA was critical for helping improve recipiency rates calculated in Census Bureau data, which increased by 9 percentage points during the pandemic.2 The length of time that workers could receive benefits was also increased, through the Pandemic Emergency Unemployment Compensation (PEUC) program. Furthermore, the generosity of benefits helped ensure weekly benefits to workers were sufficient to meet their basic expenses, especially in states where UI benefits are so low that they are insufficient to meet the federal poverty threshold (see Table 1). All of these changes to UI during the pandemic improved the coverage and adequacy of UI benefits.
Table 1
| STATE UI BENEFITS COMPARED TO POVERTY LEVELS AS OF FIRST QUARTER 2022 | |||
| States where benefits are less than the poverty threshold for a one-person family | States where benefits are less than the poverty threshold for a two-person family | States where benefits are less than the poverty threshold for a three-person family | |
| Number of states | 9 | 24 | 47 |
| List of states | Alabama, Alaska, Arizona, Arkansas, Florida, Louisiana, Mississippi, North Carolina, Tennessee | Previous 9 + California, District of Columbia, Georgia, Illinois, Indiana, Maryland, Michigan, Missouri, New Hampshire, New Mexico, Oklahoma, South Carolina, Virginia, West Virginia, Wisconsin | Previous 31 + Colorado, Connecticut, Delaware, Hawaii, Idaho, Iowa, Kansas, Kentucky, Maine, Minnesota, Montana, Nebraska, Nevada, New York, Ohio, Oregon, Pennsylvania, Rhode Island, South Dakota, Texas, Utah, Vermont, Wyoming |
| Source: Authors’ tabulation using data from the U.S. Department of Labor and the U.S. Department of Health and Human Services. | |||
Beyond addressing recipiency rates, the changes made to unemployment insurance during the pandemic had substantial benefits on poverty alleviation and the economy writ large. Per the Center on Budget and Policy Priorities, pandemic changes to UI helped 5 million people stay out of poverty in 2020, and 6 million in 2021.3 UI benefits are essential for helping people who lose their jobs replace some of their income. As such, UI helps people continue to spend on goods and services, thereby serving as an “economic stabilizer” for regional economies as well as the nation as a whole. The expanded UI programs were estimated to increase GDP by 1.1 percent, helping to accelerate the recovery from the cataclysmic job loss that occurred during the pandemic.4 Other research suggests that the expanded UI benefits increased consumer spending among those receiving benefits by 20 percent.5
Pandemic changes to UI helped 6 million people stay out of poverty in 2021 and increased GDP by 1.1 percent.
Lastly, changes to UI during the pandemic were very progressive, delivering aid that represented a greater share of lost wages for lower-income workers, which tend to be women and people of color. The impact of these changes was not insubstantial. For instance, UI benefits reduced the poverty rate for Black households by 2.4 percentage points, compared to 1.4 percentage points overall.6 One study of UI in Georgia showed how programs such as PUA particularly helped expand benefit recipiency. When looking at traditional UI, Black jobless workers in Georgia were being denied at twice the rate of white jobless workers.7 Many workers who were denied due to reasons such as insufficient wages, however, were able to apply and receive benefits through PUA, which helped reduce the inequities in UI recipiency relative to the state program. As a result, 91 percent of jobless Georgians that applied for PUA were approved, and the largest share of those approved were Black jobless workers.
Too Few Workers Receive State Unemployment Benefits
The most glaring weakness of the state unemployment benefit system is how few unemployed workers collect benefits. The unemployment insurance recipiency rate has been the standard way to measure access to benefits by the U.S. Department of Labor. This ratio compares the number of insured unemployed workers (measured by the UI system) to the total number of unemployed workers in the country (measured by the Bureau of Labor Statistics). Figure 1 displays that annual recipiency rate for state benefits only. After reaching 50 percent as late as 1975, the rate steadily declined in the face of Reagan-era cutbacks to benefits to a then-all-time-low of 29 percent in 1984. With states reversing some of those cuts with help from federal grants, the nationwide recipiency rate recovered to above 40 percent through the early 2000s. However, the UI funding challenges during the Great Recession precipitated another wave of cutbacks, with some states reducing the number of weeks of benefits8 and implementing other restrictive changes.9 Following these changes, the recipiency rate reached another historic low, 26 percent in 2013, and now is once approaching that record low.
Figure 1
One significant recent driver of the lower recipiency rate is the decrease in the maximum number of weeks that individuals can receive benefits, as shown in a 2018 Urban Institute study by Wayne Vroman.10 Thus, partly, the low recipiency rate is driven by the restrictions on UI eligibility, which varies across states. However, new research by Eliza Forsythe and Hesong Yang at the University of Illinois Urbana–Champaign has shown that the largest driver of the low recipiency rate is that many unemployed workers who are likely eligible don’t apply for benefits in the first place.11 They find that as many as 50 percent of workers who would be eligible based on monetary and nonmonetary determinations never apply for UI in the first place after losing work.
As is often the case, there are significant racial equity implications to these findings. Black workers have even lower rates of recipiency than white workers. These racial inequities in access have long been known; a 2012 study by Alix Gould-Werth and H. Luke Schaefer at the School of Social Work, University of Michigan–Ann Arbor found a 10 percentage point gap in UI application rates between white and Black workers.12 More recent research has shown that this is partly due to the fact that Black workers are less likely to meet the prior earnings requirements to qualify for UI in the first place; another reason is due to Black workers’ overrepresentation in Southern states where state rules around UI eligibility and benefit amounts systemically create inequities in UI access. One study by Elira Kuka at George Washington University and Bryan A. Stuart at the Federal Reserve Bank of Philadelphia finds that, among likely eligible workers, Black workers are 24 percent less likely to receive UI benefits than white workers.13 Research for the Upjohn Institute by Christopher J. O’Leary, William E. Spriggs, and Stephen A. Wandner further expound on the tremendous variability in states for recipiency rates, ranging from 10 percent in Florida and North Carolina up to 52 percent in New Jersey.14 They cite differences in benefit generosity, and the role of organized labor as some of the reasons why recipiency rates vary in general and by race.
Pandemic expansions from the CARES Act and subsequent legislation temporarily reversed the trend in low recipiency in 2020. As Figure 1 shows, the standard recipiency rate spiked to a previously unheard 78 percent in the year 2020. Some of this increase from the standard measure is due to measurement error.15 While other studies of recipiency showed a smaller increase in recipiency, there’s no doubt access to benefits expanded. Unfortunately, this trend has rapidly reversed since those benefits wound down in the second half of 2021. The dashboard’s estimates of current recipiency through this past July (the U.S. Department of Labor publishes its data quarterly) concludes that recipiency has dropped back to a near-record low of an average of 26.8 percent for the twelve months from September 2021 to August 2022. All the expansions during the pandemic were temporary, and the system has returned right back where it started from: an unemployment system that covers less than one in three jobless workers.
Recipiency has dropped back to a near-record low of an average of 26.8 percent for the twelve months from September 2021 to August 2022.
The situation is actually far worse than this national rate indicates, as displayed in Figure 2. There are eighteen states where less than one in five unemployed workers are covered by state unemployment benefits. These states are concentrated in the Southeast and Midwest of the country: Alabama, Arizona, Delaware, Florida, Idaho, Kentucky, Louisiana, Maryland, Mississippi, Missouri, Nebraska, New Hampshire, North Carolina, Ohio, South Carolina, South Dakota, Tennessee, and Virginia.
When it was first established, the UI system excluded agricultural and domestic workers from receiving benefits, which had a major impact on Black workers in the South and on many states with large black workforces, such as Alabama (9 percent recipiency) and Mississippi (12 percent recipiency). All but four of the states with the lowest recipiency rates also made the punitive decision to prematurely cut off pandemic benefits, based on the belief that unemployment benefits were keeping people from returning to work. Moreover, ten states (Alabama, Arizona, Florida, Kentucky, Maryland, Mississippi, New Hampshire, North Carolina, South Dakota, and Tennessee) currently are paying fewer than one in six jobless workers UI benefits.
Low recipiency can occur for a variety of reasons, including because workers don’t apply. The application process itself can be a barrier to eligible workers receiving benefits. States have increasingly moved to online application systems, which pose greater barriers to access for those without strong Internet connections and usable devices, with limited digital literacy, or who do not speak English as their first language. Florida’s online application put extra hurdles to benefits that triggered a civil rights investigation, and national data indicates that technology modernization was associated with an increase in denial rates across the country.16 Dashboard Figure 1.1 shares the first-ever series of UI denial rates by state going back to 2005, comparing the number of denials for nonmonetary reasons (such as a disqualification for being fired or for not reporting work search) to the total number of applications. In 2019, sixteen states (Alaska, Colorado, Indiana, Louisiana, Michigan, Mississippi, Missouri, Nebraska, New Hampshire, New Mexico, North Dakota, Oklahoma, South Carolina, Texas, Utah, and Wyoming) had a 50 percent denial rate or more. Practically, this means that for every two initial claims in 2019, there was at least one denial of a benefit (individuals can face multiple denials on one claim, each covering different weeks of benefits). The pandemic complicated these rates because there were longer than usual gaps between claims processed and denials made, which artificially lowered the rates in 2020. However, nationally, this rate stands at 37.8 percent in the first seven months of 2022, after dipping in 2020 and 2021.
For decades, the standard package of unemployment benefits was twenty-six weeks in all states, but over the past dozen years or so, ten states have cut back their benefits below this historical level.
Changes in state duration policy also have had an impact on recipiency. A key policy issue is the length of benefits. If unemployment benefits are not as long as the average spell of unemployment, then even those who are initially eligible won’t receive them for all of their time out of work. To this point, the average duration of unemployment was 22.3 weeks in August 2022,17 and 1.1 million unemployed workers were out of work for more than twenty-six weeks (representing 18.8 percent of the unemployed). For decades, the standard package of unemployment benefits was twenty-six weeks in all states, but over the past dozen years or so, ten states have cut back their benefits below this historical level. These states are Alabama, Arkansas, Florida, Georgia, Idaho, Kansas, Michigan, Missouri, North Carolina, and South Carolina. For example, in 2013, North Carolina cut benefits down to as few as twelve weeks, slashed the maximum benefit rate by 35 percent, and tightened qualification rules.18 North Carolina’s program went from 40 percent recipiency at the end of 2009 (in the middle of states) to one of the lowest, with recipiency averaging just 10.9 percent in July 2022. The backlash to federal pandemic benefits carried over in state legislative sessions in 2022 to three additional states, which passed laws slashing their recipiency by reducing the number of weeks: Kentucky19 (as few as twelve weeks), Iowa20 (sixteen weeks), and Oklahoma21 (few as twelve weeks). Once these cuts take into effect, these states are sure to follow the pattern of experiencing drops in recipiency in programs that historically had been average or above average over time. More states may follow, as Louisiana, Mississippi, Missouri, New Hampshire, West Virginia, and Wisconsin all considered similar bills last year. Black workers consistently have among the highest rates of long-term unemployment and will be the most impacted by these early cuts to benefits.22
Figure 2
Benefits Are Inadequate to Cover the Basics
The value of unemployment benefits has dramatically declined since the end of pandemic benefit programs. In August 2022, the average weekly unemployment benefit was just $389 per week nationwide, with benefits ranging from a low of $215 per week in Mississippi to $620 per week in Washington.23 Before half of the states prematurely exited federal programs starting in the middle of June 2021, an additional $300 per week in federal benefits was available in every state. Before that cut off began, workers were receiving a combined average of $643 per week in unemployment benefits in May 2021. The additional $300 expired in all states in September 2021. This decline has been made all the more damaging for jobless workers by the rapid rise in inflation over the past year. Today’s unemployment benefits have lost nearly half of their purchasing power in a year, with only 55 percent of the purchasing power they had in May 2021.
The end of pandemic programs triggered a dramatic change in the replacement rates offered by unemployment insurance benefits. Data from the dashboard project finds that the replacement rate dropped from 79.6 percent in the first quarter of 2021 when both the federal and state benefits were available, to just 39.2 percent in the first quarter of 2022 when the federal benefits were no longer available. Even the limited income support provided by state unemployment insurance matters, and rigorous research has found that benefits help to keep food on the table and families in their home.24 However, in too many states, benefits are so low that they cannot be counted to keep a jobless family out of poverty and able to keep their place in the middle class until they get a job again. For example, in Arizona, an average unemployment benefit check of $238 per week in the first quarter of 2022 only replaced 30 percent of the wages of those who lost work and became eligible for UI benefits. Benefits this low only amount to 88 percent of the federal poverty level for a family of one.
Table 2
| UI BENEFITS AND REPLACEMENT RATES | ||||
| 1st Quarter 2021 | 1st Quarter 2022 | |||
|
Average UI Benefit
|
Replacement Rate | Average UI Benefit | Replacement Rate | |
| Alabama | $544.49 | 87.0% | $254.68 | 34.4% |
| Alaska | $552.77 | 59.0% | $260.53 | 26.4% |
| Arizona | $536.14 | 68.0% | $237.93 | 30.0% |
| Arkansas | $539.42 | 85.0% | $247.41 | 33.9% |
| California | $607.65 | 68.0% | $337.89 | 34.0% |
| Colorado | $705.89 | 74.0% | $417.90 | 43.1% |
| Connecticut | $607.62 | 71.0% | $364.95 | 38.1% |
| District of Columbia | $649.67 | 71.0% | $368.25 | 30.0% |
| Delaware | $549.12 | 81.0% | $295.17 | 35.4% |
| Florida | $534.59 | 77.0% | $240.34 | 30.9% |
| Georgia | $562.59 | 86.0% | $290.78 | 38.6% |
| Hawaii | $751.41 | 92.0% | $502.21 | 47.0% |
| Idaho | $621.22 | 86.0% | $362.63 | 44.7% |
| Illinois | $602.83 | 68.0% | $329.97 | 33.7% |
| Indiana | $532.54 | 74.0% | $266.26 | 30.9% |
| Iowa | $641.20 | 86.0% | $427.54 | 48.8% |
| Kansas | $691.76 | 72.0% | $422.94 | 45.0% |
| Kentucky | $608.45 | 83.0% | $415.03 | 46.4% |
| Louisiana | $487.29 | 61.0% | $186.57 | 28.7% |
| Maine | $626.03 | 85.0% | $369.46 | 46.5% |
| Maryland | $618.41 | 84.0% | $338.89 | 37.1% |
| Massachusetts | $713.37 | 74.0% | $512.66 | 41.4% |
| Michigan | $605.43 | 74.0% | $326.05 | 37.4% |
| Minnesota | $688.94 | 81.0% | $439.23 | 45.6% |
| Mississippi | $545.50 | 76.0% | $199.01 | 33.1% |
| Missouri | $545.50 | 76.0% | $264.73 | 31.4% |
| Montana | $625.30 | 87.0% | $403.95 | 46.6% |
| Nebraska | $609.66 | 87.0% | $358.77 | 42.0% |
| Nevada | $670.63 | 80.0% | $379.17 | 38.3% |
| New Hampshire | $573.65 | 76.0% | $299.66 | 31.6% |
| New Jersey | $721.69 | 82.0% | $473.28 | 45.7% |
| New Mexico | $614.24 | 93.0% | $334.73 | 40.7% |
| New York | $641.59 | 65.0% | $353.12 | 35.8% |
| North Carolina | $531.94 | 72.0% | $246.33 | 31.2% |
| North Dakota | $762.25 | 86.0% | $478.66 | 48.8% |
| Ohio | $636.19 | 81.0% | $387.48 | 40.2% |
| Oklahoma | $643.54 | 92.0% | $333.93 | 43.5% |
| Oregon | $667.95 | 81.0% | $411.14 | 44.1% |
| Pennsylvania | $652.39 | 86.0% | $402.64 | 48.7% |
| Puerto Rico | $482.62 | 123.0% | $198.64 | 45.9% |
| Rhode Island | $630.30 | 76.0% | $366.32 | 40.3% |
| South Carolina | $546.91 | 85.0% | $266.94 | 36.6% |
| South Dakota | $625.70 | 89.0% | $380.16 | 42.6% |
| Tennessee | $517.94 | 78.0% | $230.56 | 32.4% |
| Texas | $666.70 | 77.0% | $381.17 | 43.9% |
| Utah | $685.90 | 77.0% | $441.48 | 46.8% |
| Vermont | $683.95 | 89.0% | $379.07 | 47.1% |
| Virginia | $576.64 | 71.0% | $306.85 | 30.2% |
| Washington | $782.21 | 75.0% | $551.95 | 46.8% |
| West Virginia | $559.26 | 78.0% | $284.61 | 33.0% |
| Wisconsin | $601.40 | 76.0% | $305.80 | 36.1% |
| Wyoming | $722.28 | 77.0% | 419.97 | 46.4% |
| US Average | $617.36 | 79.6% | $347.22 | 39.2% |
| Source: Authors’ calculations using data from the U.S. Department of Labor. | ||||
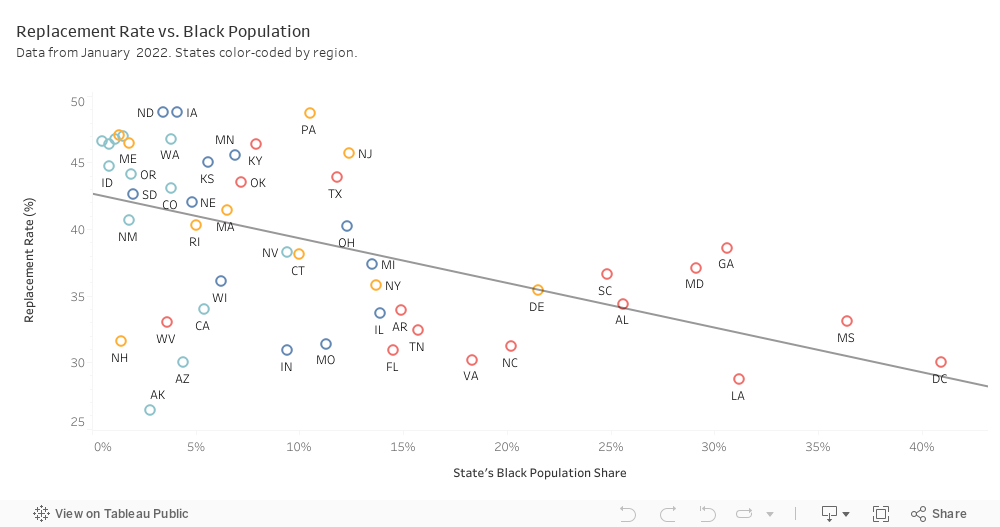
The wide variation in replacement rates shown in Table 2 has distinct racial equity implications. The UI Racial Equity Explorer produces comparisons between the racial make-up of a state’s population and different unemployment insurance variables. As displayed in Figure 3, one of the strongest empirical relationships is the one between the share of the state’s Black population and the benefit replacement rate. All ten UI jurisdictions with the highest Black population share (Alabama, Delaware, District of Columbia, Georgia, Louisiana, Maryland, Mississippi, North Carolina, South Carolina, and Virginia) have UI replacement rates below the national average of 39.2 percent in the first quarter of 2022. Four of these ten jurisdictions (District of Columbia, Louisiana, North Carolina, and Virginia) are in the bottom ten of the fifty states and the District of Columbia. when it comes to replacement rates. The results displayed in the dashboard line up with recent scholarly research that found that differences in state rules accounted for an 8 percentage point difference in the replacement rates for Black workers and White workers.25
Figure 3
The dashboard also tracks one of the biggest drivers of low replacement rate—the maximum weekly benefit amount. In calculating benefit amount levels, states use a formula that is applied to wages. These formulas are relatively similar and typically replace between 50 percent and 60 percent of average weekly wages. However, all states cap the benefit with a maximum benefit. If the calculation for a particular worker is above the maximum, they can get far less than 50 percent of prior wages. As displayed in dashboard Figure 2.2, Tennessee ($275), Louisiana ($275), Florida ($275), Alabama ($275), Arizona ($240), and Mississippi ($235) all have a maximum weekly benefit amount of less than $300 per week as of January 2022, meaning a full-time worker earning $15 per hour would not even get half of their wages back in unemployment payments. The key policy difference between states is whether they index their maximum weekly benefit amount to the growth in wages in states. At the moment, twenty-seven states employ an indexing formula that regularly increases their maximum weekly benefit to wage growth. None of the twenty states with the lowest maximum weekly benefit amount uses indexing, and these states are the ones whose unemployment checks have been the worst in keeping pace with increases in the cost of living.
Benefits Take Too Long to Process
Unemployment insurance should function as a circuit breaker to stop the fall of a working class family into poverty. However, because most families are unable to keep much in terms of liquid savings, unemployment insurance can only serve this purpose if the benefits are paid in a timely fashion. For this reason, the Social Security Act requires states to have methods of administration that are “reasonably calculated to insure full payment of unemployment compensation when due.”26 To put this law into practice, federal regulations have developed timeliness standards on key aspects of benefits processing including initial payments, adjudications and appeals. Figures 1.2, 1.3, and 1.4 in the dashboard all track data related to the performance against these federal standards. Nearly a year after the end of the added burdens of managing the pandemic unemployment programs, the vast majority of states are not able to meet their core responsibilities of administering state unemployment benefits. One critical standard is delivering a first payment to eligible individuals within twenty-one days, in time to cushion the blow of the lost usual every-other-week regular pay day. However, as of August 2022, only fifteen states pay benefits to eligible workers within the twenty-one day standard set by the federal government. The states doing well in terms of paying benefits out quickly are primarily in the parts of the Upper Midwest, such as the South and North Dakota, and thus have very little in the way of volume coming through the system. Most of the states in the Northeast, Great Lakes, and West Coast regions, with higher recipiency rates and claims volumes, are struggling to pay benefits on time.
Nearly a year after the end of the added burdens of managing the pandemic unemployment programs, the vast majority of states are not able to meet their core responsibilities of administering state unemployment benefits.
The situation is even worse when it comes to jobless workers’ appeals of state denials of benefits, with numerous pandemic period appeals to denials of traditional unemployment benefits still pending as of this year. As of July 2022, the average state is taking 121 days to process an appeal, four times as long as the thirty-day standard within federal regulations. For example, Alabama’s own governor, Kay Ivey, recently bemoaned the state’s appeal backlog of 594 days, with many of these workers appealing technicality-driven overpayment decisions related to UI claims made during the pandemic that could run into the thousands of dollars.27 The states do not bear all of the blame for these chronic administrative failings. States depend on federal grants to pay for the administration of the UI program and Congress has chronically underfunded this function, contributing to the erosion of human and technological resources in the states. These problems today are in part the result of administrative funding that declined by 30 percent from 1999 to 2019 on an inflation-adjusted basis.28
UI Is Badly Underfunded
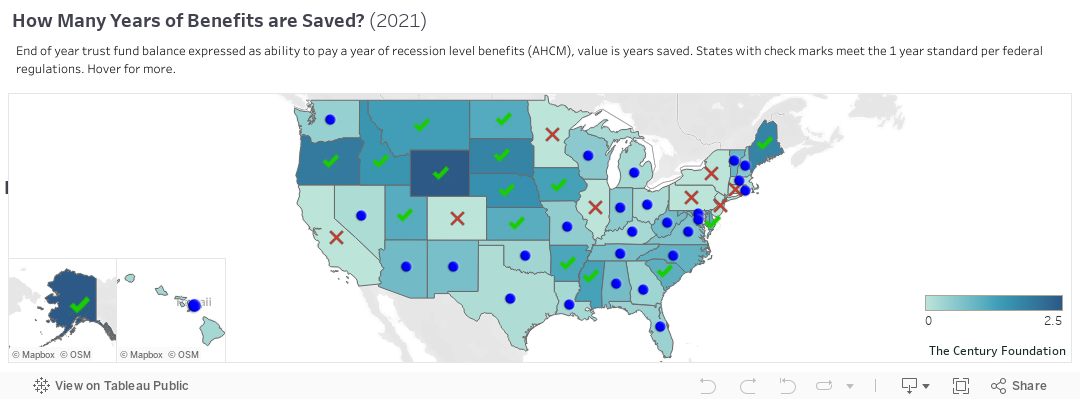
State unemployment insurance is set up as a self-financing system, with unemployment insurance premiums paid by employers on behalf of workers going into a dedicated trust fund to pay benefits. With little regulation from the federal government, states have struggled to achieve forward funding of their programs. In other words, states have not assessed high enough premiums during good economic times to pay out higher levels of benefits during periods of high demand, such as during the pandemic or during the Great Recession in 2009. The U.S. Department of Labor set a standard for forward funding in 2010, which gives incentives to states who save the equivalent of one year of recession-level benefits.29 The department uses a metric called the Average High Cost Multiple, which adjusts the current level of trust fund balances to the expected level of benefits in a future recession in that particular state (based on its prior experiences in a recession).30
By the end of 2020, seventeen states had unemployment insurance programs that were insolvent, having exhausted all of their savings in expenses.
Dashboard Figure 4.1 tracks the progress of the states against this metric. Going into the COVID-19 pandemic, twenty-nine of the fifty states and the District of Columbia had met the department’s standard for pre-recession savings. Those states were: Alabama, Alaska, Arkansas, the District of Columbia, Florida, Georgia, Hawaii, Idaho, Iowa, Kansas, Louisiana, Maine, Michigan, Mississippi, Montana, Nebraska, Nevada, New Hampshire, New Mexico, North Carolina, North Dakota, Oklahoma, Oregon, South Carolina, South Dakota, Utah, Vermont, Virginia, Washington, and Wyoming. The surge in claims in 2020 impacted all states, but especially those who had not saved up for a recession. By the end of 2020, seventeen states had unemployment insurance programs that were insolvent, having exhausted all of their savings in expenses: California, Colorado, Connecticut, Hawaii, Illinois, Kentucky, Louisiana, Massachusetts, Minnesota, Nevada, New Jersey, New Mexico, New York, Ohio, Pennsylvania, Texas, and West Virginia. Of these seventeen states, only two (Hawaii and Louisiana) met the pre-recession measure. Workers in these states were able to continue receiving benefits because their states were able to take out federal loans to cover the costs. The states are responsible for paying back the loans with interest over time. The situation improved in 2021, but states have a ways to go to recover. By the end of 2021, sixteen states met the minimum solvency requirements and only eight were insolvent, and several states used American Rescue Plan state and local relief dollars to shore up their UI trust fund. As of October 7, 2022, only five states (California, Colorado, Connecticut, Illinois, and New York) still had outstanding loan amounts.
Figure 4
Poor solvency of UI trust funds impacts workers as well. Well-funded trust funds are a necessary, but not sufficient condition for decent benefits. Oregon stands out as a state that consistently has one of the best funded trust funds and pays out benefits at above average recipient and replacement rates. When funds go insolvent, employers frequently request relief from tax increases and state policy makers seek cost savings through cuts in benefit amounts or eligibility.
Looking Ahead
The end of federal pandemic unemployment benefits shines a spotlight on the threadbare nature of the traditional state unemployment system. TCF’s relaunched Unemployment Insurance Data Dashboard provides a compelling view into the challenges facing a system that too frequently pays out inadequate benefits and fails to reach many unemployed workers. The UI Racial Equity Explorer displays that these trends are worse in those states that have a large population of Black workers.
The data in the dashboard provide a critical tool for state policy makers and state advocates striving to improve the readiness of their state unemployment safety nets before the next economic downturn. However, the dashboard also demonstrates that disparities between the states are greater than they should be, and calls out for heightened attention and action by federal policymakers to ensure that jobless workers can get the timely support that they have earned. Such a federal response should start with effective use of the $2 billion allocated by Congress to the U.S. Department of Labor in the American Rescue Plan dedicated to equity, timeliness, and accuracy of payments, and should continue with a larger federal role in overseeing the programs as contemplated in the Guaranteeing Unemployment Assistance and Reducing Deception (GUARD) Act and President Biden’s FY 2023 budget proposals.
Acknowledgements
The authors acknowledge the data visualization support provided by Lance Hadley and programming assistance of Mike Hollander, without whom this project would have been impossible, and research support by Kat Johansen, Samantha Wingand, and Monica Chase. The dashboard advisory committee includes Alex Camardelle, Matt Darling, Alix Gould-Werth, Tara Meginess, Rob Pavosevich, Zach Schiller, Alexa Tapia, and Amy Traub.
Notes
- “Unemployment Insurance Data Dashboard,” The Century Foundation, August 18, 2022, https://tcf.org/content/data/unemployment-insurance-data-dashboard/?session=1.
- Eliza Forsythe and Hesong Yang, “Understanding Disparities in Unemployment Insurance Recipiency,” Equitable Growth, University of Illinois, Urbana–Champaign, July 13, 2022, https://equitablegrowth.org/wp-content/uploads/2022/07/071322-WP-Understanding-Disparities-in-Unemployment-Insurance-Recipiency-Forsythe-and-Yang.pdf. U.S. Census Bureau data is particularly important for understanding data during the pandemic, as a complement to administrative data. The administrative recipiency rate reported on the dashboard follows historical literature which relies on the U.S. Department of Labor’s “Total Unemployed” series. This series badly under-reported labor force disattachment during the pandemic because it does not count those who temporarily suspended their work search due to COVID-19 as unemployed. Since the official recipiency rate relies on this Bureau of Labor Statistics series as its denominator, the under-reporting skewed recipiency rates. Post- and pre-pandemic the official recipiency is more accurate than during.
- Nick Gwyn, “Historic Unemployment Programs Provided Vital Support to Workers and the Economy During Pandemic, Offer Roadmap for Future Reform,” Center on Budget and Policy Priorities, March 24, 2022, https://www.cbpp.org/research/economy/historic-unemployment-programs-provided-vital-support-to-workers-and-the-economy.
- Nick Gwyn, “Historic Unemployment Programs Provided Vital Support to Workers and the Economy During Pandemic, Offer Roadmap for Future Reform,” Center on Budget and Policy Priorities, March 24, 2022, https://www.cbpp.org/research/economy/historic-unemployment-programs-provided-vital-support-to-workers-and-the-economy.
- Peter Ganong, Fiona Greig, Pascal Noel, Daniel M. Sullivan, and Joseph Vavra, “Lessons Learned from Expanded Unemployment Insurance During COVID-19,” The Hamilton Project, April 27, 2022, https://www.hamiltonproject.org/assets/files/Lessons_Learned_from_Expanded_Unemployment_Insurance_during_COVID-19.pdf.
- Peter Ganong, Fiona Greig, Pascal Noel, Daniel M. Sullivan, and Joseph Vavra, “Lessons Learned from Expanded Unemployment Insurance During COVID-19,” The Hamilton Project, April 27, 2022, https://www.hamiltonproject.org/assets/files/Lessons_Learned_from_Expanded_Unemployment_Insurance_during_COVID-19.pdf
- Shawn Donnan, Reade Pickert, and Madeline Campbell, “Georgia Shows Just How Broken American Unemployment Benefits Are,” Bloomberg, November 19, 2021, https://www.bloomberg.com/graphics/2021-georgia-unemployment-bias/?leadSource=uverify%20wall
- “Unemployment Insurance – States’ Reductions in Maximum Benefit Durations Have Implications for Federal Costs”, United States Government Accountability Office, April 2015, https://www.gao.gov/assets/gao-15-281.pdf
- Andrew Stettner, “Unemployment Trust Fund Recovery Is Helping Employers, not Workers,” The Century Foundation, December 7, 2017, https://tcf.org/content/report/unemployment-trust-fund-recovery-helping-employers-not-workers/
- Wayne Vroman, “Unemployment Insurance Benefits: Performance since the Great Recession,” The Urban Institute, February 2018, https://www.urban.org/sites/default/files/publication/96806/unemployment_insurance_benefits_performance_since_the_great_recession_2.pdf.
- Eliza Forsythe and Hesong Yang, “Understanding Disparities in Unemployment Insurance Recipiency,” Equitable Growth, University of Illinois, Urbana–Champaign, July 13, 2022, https://equitablegrowth.org/wp-content/uploads/2022/07/071322-WP-Understanding-Disparities-in-Unemployment-Insurance-Recipiency-Forsythe-and-Yang.pdf.
- Alix Gould-Werth and H. Luke Shaefer, “Monthly Labor Review, October 2012: Unemployment Insurance participation by education and by race and ethnicity,” Bureau of Labor Statistics, October 2012, https://www.bls.gov/opub/mlr/2012/10/art3full.pdf.
- Elira Kuka and Bryan A. Stuart, “Racial Inequality in Unemployment Insurance Receipt and Take-Up,” National Bureau of Economic Research, December 2021, https://www.nber.org/papers/w29595.
- Christopher J. O’Leary, Williams E. Spriggs, Stephen A. Wandner, “Equity in Unemployment Insurance Benefit Access,” W. E. Upjohn Institute for Employment Research, December 2, 2021, https://research.upjohn.org/cgi/viewcontent.cgi?article=1025&context=up_policypapers
- The denominator of the recipiency rate is the BLS total unemployment number. During the pandemic this underestimated labor market slack, as those who did not look for work in the reference week of the survey were counted as out of the labor market and not unemployed. Many of these individuals were allowed to receive unemployment benefits due to expanded UI eligibility rules. With the denominator depressed, the recipiency rate is inaccurately high.
- George Wentworth and Claire McKenna, “Ain’t No Sunshine: Fewer than One in Eight Unemployed Workers in Florida is Receiving Unemployment Insurance,” National Employment Law Project, September 21, 2015, https://www.nelp.org/publication/aint-no-sunshine-florida-unemployment-insurance/.
- “Employment Situation,” Bureau of Labor Statistics, August 2022, https://www.bls.gov/news.release/empsit.t12.htm.
- Robbie Brown, “North Carolina Approves Steep Benefit Cuts for Jobless in Bid to Reduce Debt,” New York Times, February 13, 2013, https://www.nytimes.com/2013/02/14/us/north-carolina-approves-benefit-cuts-for-unemployed.html.
- House Bill 4, Kentucky General Assembly, May 25, 2022, https://apps.legislature.ky.gov/record/22RS/hb4.html.
- House File 2355, State of Iowa General Assembly, June 16, 2022, https://www.legis.iowa.gov/legislation/BillBook?ba=HF%202355&ga=89.
- House Bill 1933, Oklahoma State Legislature, May 20, 2022, http://www.oklegislature.gov/BillInfo.aspx?Bill=HB1933&Session=2200.
- Jesse Bennett, “Long-term unemployment has risen sharply in U.S. amid the pandemic, especially among Asian Americans,” Pew Research Center, March 11, 2021, https://www.pewresearch.org/fact-tank/2021/03/11/long-term-unemployment-has-risen-sharply-in-u-s-amid-the-pandemic-especially-among-asian-americans/.
- U.S. Department of Labor, “Unemployment Insurance Data,” https://oui.doleta.gov/unemploy/claimssum.asp
- Andrew Stettner and Maurice Emsellem, “Unemployment Insurance Is Vital to Workers, Employers and the Struggling Economy,” National Employment Law Project, December 5, 2002, https://www.nelp.org/wp-content/uploads/2015/03/UI-Benefits-Workers-Employers-and-the-Struggling-Economy.pdf[email protected]
- Daphné Skandalis, Ioana Marinescu and Maxim N. Massenkoff, “Racial Inequality in the U.S Unemployment Insurance System,” National Bureau of Economic Research, July 2022, https://www.nber.org/papers/w30252.
- Social Security Act, U.S. Code 42, § 503.
- Sarah Whites-Koditschek, “Alabama identifies thousands asked to pay back unemployment due to state error,” AL, September 5, 2022, https://www.al.com/news/2022/09/alabama-identifies-thousands-asked-to-pay-back-unemployment-due-to-state-error.html.
- Mariette Aborn, “Administrative Failures Plague State Unemployment Insurance Programs,” Bipartisan Policy Center, July 1, 2022, https://bipartisanpolicy.org/blog/administrative-failures-plague-state-unemployment-insurance-programs/.
- “Federal–State Unemployment Compensation Program; Funding Goals for Interest-Free Advances,” Federal Register 75, no. 180, (September 17, 2010), https://www.govinfo.gov/content/pkg/FR-2010-09-17/pdf/2010-22926.pdf.
- Christopher J. O’Leary and Kenneth J. Kline, “State Unemployment Insurance Reserves Are Not Adequate,” W.E. Upjohn Institute for Employment Research, March 20, 2020, https://research.upjohn.org/cgi/viewcontent.cgi?article=1340&context=up_workingpapers.