Unless Congress acts swiftly, 11.4 million workers will lose their unemployment benefits between March 14 and April 11 of this year, with disastrous results for families and the American economy. American workers faced a similar benefits cliff just this past December, when, according to research by The Century Foundation, 12 million workers were at risk of seeing their federal unemployment benefits expired on December 26 of that year; 1 thankfully, Congress was able to include the Continued Assistance for Unemployed Workers (CAUW) Act in their end-of-the-year stimulus package, maintaining critical CARES Act programs—Pandemic Emergency Unemployment Compensation (PEUC), Pandemic Unemployment Compensation (PUC), and Pandemic Unemployment Assistance (PUA)—until at least March 14, 2021, with some benefit payments continuing up to April 11. 2
But the expiration of this new tranche of benefits is rapidly approaching. With negotiators hemmed in by a $900 billion cap in aid, the CAUW Act included the shortest period of benefits passed by Congress since the 1980s, 3 and this latest extension is winding down almost as soon as it started.
Based on our analysis, we estimate that just twelve states will be triggered onto the federal Extended Benefits (EB) program at the end of the “soft cliff” on April 11, 2021—meaning that, after that date, only roughly 700,000 jobless workers will be able to receive any UI benefits after temporary federal UI programs expire. On a net basis, this means that more workers will face the cliff in March and April than did on December 26 due to the limited availability of EB.
In what appears to be a good sign for American workers, Congress and the White House seem to be marching in lockstep toward relief based on President Biden’s American Rescue plan, as the Senate has passed a special budget reconciliation vote to be able to enact such a package with only 51 votes.4 As expressed by President Biden himself, the expiration of unemployment benefits is driving the urgency of action.5 While the COVID-19 vaccination program has started in earnest, it is not widespread enough to allow for broadscale re-opening of the economy, and thus the millions of jobless workers who are currently relying on unemployment benefits will need more aid before they are rehired. The situation is especially dire for the 39.5 percent of the unemployed who have now been out of work for six months or more,6 with finances badly stressed and savings depleted.
The jobless benefits passed in the December stimulus package are responsible for lifting more than 7 million Americans out of poverty in January,7 but Americans will need strong unemployment benefits to be in place through at least the end of September if they are to weather the storm of the pandemic. And not only do these benefits assist families, but the inclusion of a $400 per week boost in benefits—as proposed in President Biden’s American Rescue Plan (up from $300 in the CAUW Act)—presents an efficient way for Congress to target aid to those families who will spend it quickly, providing a quick boost to the nation economy to help it out of the major hole left by the pandemic in 2020.8
This report analyzes the high stakes of the impending cutoff of these benefits, including state-by-state examination of the impact of the benefits cliff for workers and state economies. We find that that:
- 11.4 million workers will be impacted by the cutoff of PEUC (5.0 million) or PUA (6.4 million) benefits that had been extended by the CAUW Act. Unlike the December 26 cutoff under the CARES Act, the benefits cliff built into the CAUW Act spreads out over several weeks:
- 4.05 million workers face a “hard cliff,” and will see their PEUC or PUA benefits end abruptly on March 14, after receiving exactly eleven weeks of benefits from the CAUW Act;
- 7.32 million workers face a “soft cliff,” and will see their benefits end some time between March 14 and April 11—at which point they can no longer receive PEUC or PUA, even if they have additional weeks in their account.
- Taking into account the amount of aid that will be in the federal-state Extended Benefits (EB) program after the end of the CAUW Act, the net number of workers facing a benefit cliff is higher in March (10.64 million) than it was in December (9.1 million). That’s because only 733,500 of these workers, in only twelve states, would be able to access EB in April if the plug were pulled from federal pandemic aid.
- Overall, Black and Latinx workers, are more dependent on the benefits extended through the CAUW. During the period from September to November, 20 percent of all state UI claimants were Black and 20 percent were Latinx, a significant increase from April, when only 14 percent Black and 15 percent were Latinx;9 workers receiving state benefits will also be dependent on extensions of benefits throughout the pandemic.
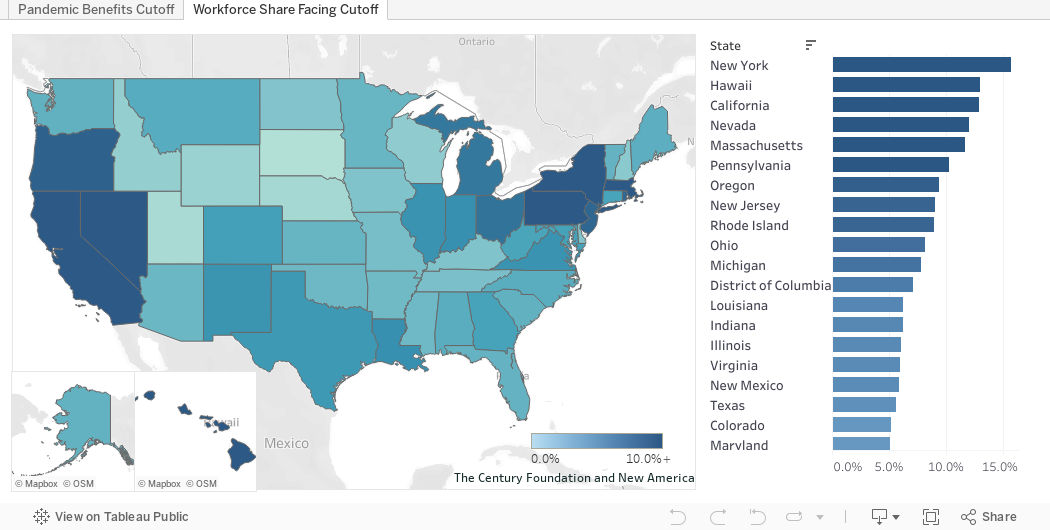
- Large-population states will feel the biggest brunt of a benefits cutoff, with several tourism-dependent states like Hawaii and Nevada also impacted. The top states impacted, in terms of the share of the workforce losing assistance, are New York, Hawaii, California, Pennsylvania, and Massachusetts, in which more than 10 percent of the labor force could be impacted if benefits are removed. However, because of gaps in coverage among Black and Latinx workers, states in the deep South and Southwest continue to benefit the least from pandemic benefits, with states such as Arizona and Mississippi seeing less than 3.5 percent of their workforce impacted by a CAUW benefits cutoff by April.
- The American Rescue Plan presented by President Joe Biden would increase FPUC benefits from $300 to $400 per week. With this change in mind, continuing pandemic benefits could deliver $9.6 billion per week to families—and the American economy—in April 2021.
There’s no reason for Congress to wait until the last minute to extend these critical benefits, and risk a lapse in aid. By waiting until after the CARES Act expired to sign the CAUW, President Trump triggered a lapse in benefits that deprived jobless workers of $17.6 billion in benefits they would have received in January if the program had operated seamlessly.10 States are working feverishly to catch up and paid out $10.2 billion in benefits for the week ending January 29—the most since the end of last August and a tremendous accomplishment, given the complexity of new rules in the CAUW Act and coordination between various programs.11 If Congress and President Biden can act before the March 14 deadline (ideally, two to four weeks before), states should be able to process new program rules and guidelines and deliver aid with minimal delays.
The New—but Short-Lived—Benefits Added by the CAUW Act
The Continued Assistance for Unemployed Workers Act passed this past December built on the unprecedented benefits provided by the CARES Act. These benefits include:
- Pandemic Extended Unemployment Compensation (PEUC), which grants additional weeks of UI to workers eligible for state unemployment benefits who are still jobless when they exhaust their state benefits (which typically last twenty-six weeks). The CAUW Act increased PEUC from thirteen to twenty-four weeks, essentially granting eleven additional weeks.
- Pandemic Unemployment Assistance (PUA), which allows traditionally ineligible workers to access up to fifty weeks of unemployment benefits (up to fifty-seven weeks, in some states).12 This includes self-employed workers, part-time workers, and low-wage earners, as well as workers unable to work for COVID-19-related reasons (for example, school closures, COVID-19-related quits). The CAUW Act increased these benefits by eleven additional weeks.13
- Federal Pandemic Unemployment Compensation (FPUC), which added $600 per week to unemployment benefit payments for seventeen weeks between April and July 2020. The CAUW Act reinstated the FPUC program for weeks between January 2 and March 14, 2021, but at only $300 per week.14
- Federal Mixed Earner Unemployment Compensation (MEUC), which provides $100 per week to individuals on regular unemployment benefits but who had earned more than $5,000 in self-employment income in the year before the pandemic.15 This $100 per week makes up for some of the difference in what these workers would have received if they were on PUA not regular UI as required.
- The Federal-State Extended Benefits program, which provides from six to twenty weeks of benefits in states with high rates of unemployment.16 Typically funded fifty–fifty between the federal government and the states, the CARES Act made these benefits temporarily fully federally funded, and the CAUW Act extended this provision through March 14, 2021.17
The law, and the guidance that followed, also issued a series of new clarifying rules for the program.18 The two flow charts below explain the sequence of these programs.
Figure 1 presents the standard flow of benefits. Those individuals who lost jobs as employees (that is, they receive a W-2 form) first go to state benefits, then to twenty-four weeks of PEUC, and only then to thirteen to twenty weeks of federal-state EB (state benefits and EB are permanent programs). EB will be available to those who exhaust their PEUC benefits regardless of future Congressional action, but this only occurs in states that have a high unemployment rate and have particular provisions in state law; few states will offer these benefits in April 2021. For those who earn through self-employment (that is, they receive a form 1099) or who otherwise are ineligible for regular UI, the standard flow would be for them to enter and stay in the PUA program for fifty to fifty-seven weeks.
FIGURE 1
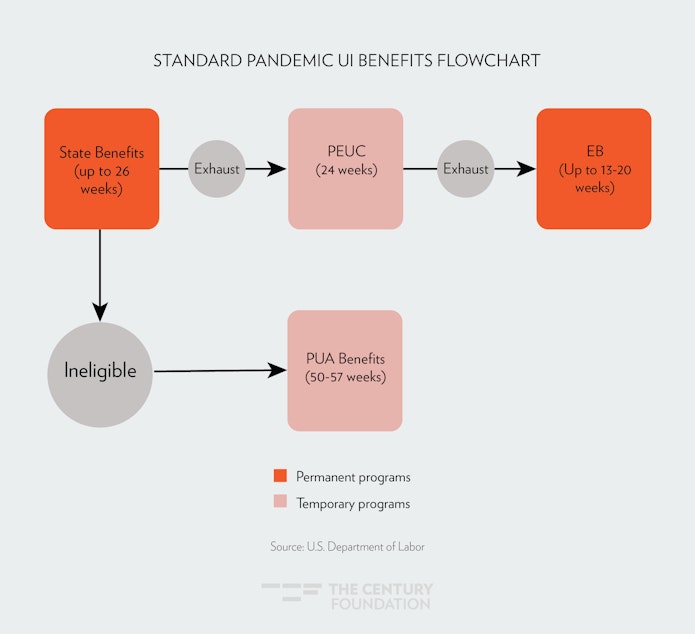
Figure 2 provides alternative flows for individuals who exhausted their PEUC benefits before December 26. In 2020, these workers would have flowed either into the EB program, if it was triggered on by a high rate of state unemployment, or into PUA, if their state did not have EB available. In some states, such as Florida and North Carolina, that only provide twelve weeks of regular unemployment benefits, some individuals who exhausted all state, PEUC, and EB available ended up in the PUA program with a total limit of thirty-nine weeks of benefits.
FIGURE 2
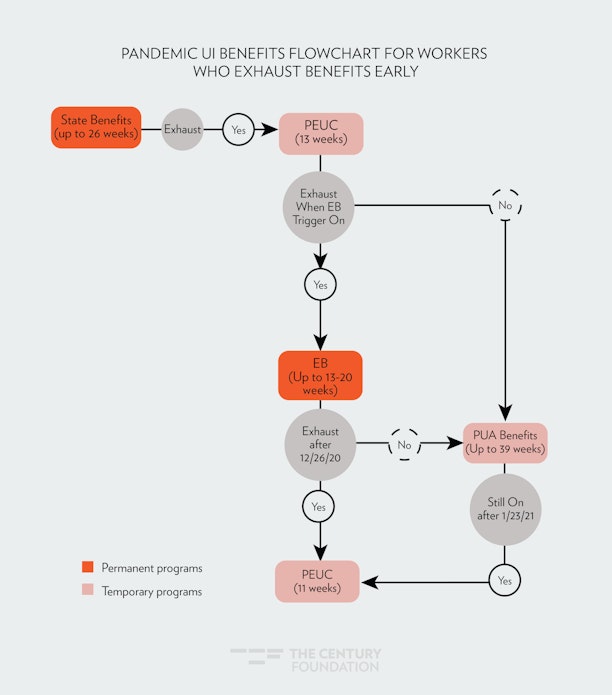
For those who started with state benefits, all would eventually end up back on the PEUC program and it’s additional eleven weeks of benefits, but in different ways. For those workers who were on EB program before December 26, the Department of Labor has directed states to keep them on the program until they exhaust their benefits and then move them back on to the additional eleven weeks of PEUC (if this occurs before March 14, 2021). In states such as Florida and North Carolina, where PEUC and EB exhaustees flowed into PUA, the Department of Labor has directed states to put them back into the PEUC program by January 24, 2021.19 The routing of workers through programs this way has implications for the unemployment cliff estimates. Because more workers are being directed into the PEUC and away from PUA, our estimates indicate that the number of people on PEUC will actually be larger in March than it was in December, while the number on PUA will be smaller than in December. Note that, for workers in this flow, many won’t receive the full twenty-four weeks of PEUC benefits, because the April 11 deadline would come before they reach that mark.
Understanding the Cutoff of Benefits
The cutoff of benefits from the CAUW Act is more convoluted than under the CARES Act, but the implications are just as serious. The CARES Act ended all pandemic benefits abruptly on December 26, regardless of how many weeks of benefits that individuals had left. The CAUW cutoff works differently, in that workers will lose access to benefits over a four-week period between March 14 and April 11.
- What happens on March 14, 2021:
- FPUC pays exactly eleven weeks of benefits, starting the week ending January 2 and ending March 14. No PUC benefits can be paid for additional weeks. Similarly, no more than eleven weeks of MEUC can be paid.
- March 14 is the last week individuals can enter into either PUA or PEUC. While there is a phaseout period between March 14 and April 11, no new individuals can enter the program. For example, a worker laid off on October 1, 2020 who exhausts their state benefits on April 1, 2021 will not be able to collect PEUC benefits.
- Those who exhausted pandemic assistance on or before December 26, 2020 could experience a hard cutoff benefits. These workers will have exactly eleven weeks of PEUC or PUA added back on to their accounts when they apply to reactivate their benefits, meaning they will expire on mass on March 14. This group includes those who have been unemployed the longest, having lost their job during the sharp downturn in March 2020 or before.
What happens on April 11, 2021: Workers who are on PUA or PEUC as of the week ending March 14 can continue to collect these benefits until April 11, 2021. Those workers who start their additional eleven weeks of benefits after January 2, 2021 will still have weeks left over after March 14; they can continue collecting, but only through April 11, and their benefits will end even if there is a remainder on their account.
11.4 Million Workers Are Counting on Congressional Action to Extend Benefits
Using Department of Labor data tracking the number of individuals that have entered into the PEUC and state benefits programs, and the rate of exhaustion (which has averaged 70 percent nationally for PEUC but varies by state), we are able to estimate how many workers will still be on PEUC benefits during the March 14 to April 11 phase-out period. There were 4.1 million reported continued claims for PEUC on December 26 when the program expired.20 In addition, we predict an additional 1.3 million workers entering PEUC during the first quarter of 2021 after having exhausted state benefits. The flow from state benefits into PEUC will slow in 2021, as it is based on initial layoffs in the second half of 2020 after the initial record surge. The extension also allowed those who had previously exhausted their PEUC benefits in 2020 to get eleven additional weeks, and we project 1.1 million additional workers will resume receiving PEUC benefits in the first quarter of 2021, based on historical reemployment and take-up rates.
As pointed out by the Government Accountability Office (GAO), data from the PUA program has been less accurate, but we are still able to estimate exhaustion and survival rates.21 Our estimates start with continued claims on December 26 (7.5 million), and factor in approximately 1 million net new recipients coming into the program in the first quarter. The state-by-state estimates that result from this analysis are displayed in Map 1, and the detailed data is in Appendix Table 1.
MAP 1. Workers facing the cut off of pandemic benefits
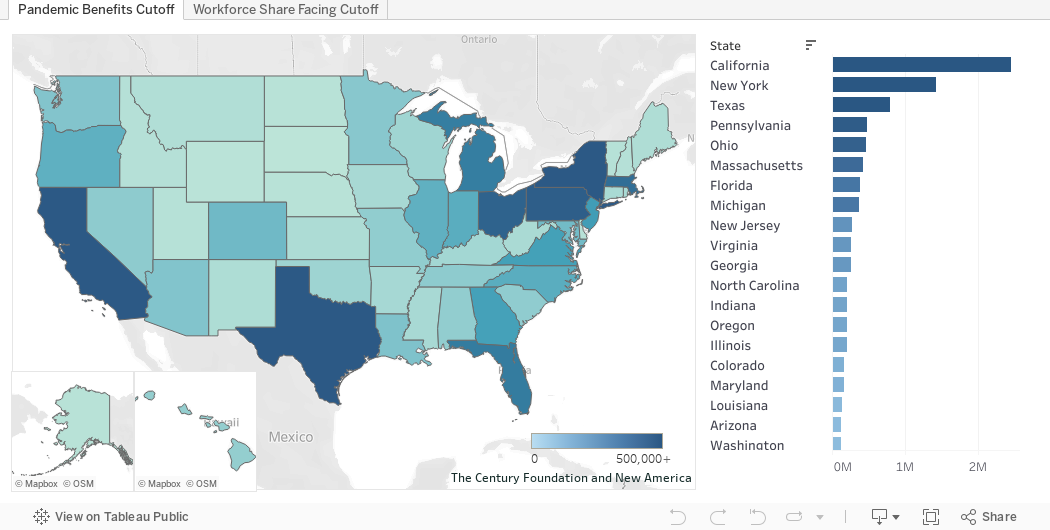
- PEUC: 5.0 million workers will face the end of their PEUC benefits by April 11 if Congress does not act to extend this aid. Because so many workers are coming back onto the program after initially exhausting benefits, we actually predict that more workers will be on PEUC at this benefit cliff than faced that impact in December 2020. California (1.3 million) and New York (545,000) will be the most impacted, with ten additional states having more than 100,000 workers exhaust their benefits (Texas, Florida, Illinois, Pennsylvania, Michigan, Georgia, North Carolina, New Jersey, Massachusetts, and Nevada).
- PUA: 6.4 million workers will face the end of their PUA benefits by April 11 under the current CAUW provisions. We predict that the flow out of PUA due to reemployment and moves back into PEUC will be greater than the flow into the program, and that there will be fewer workers on the program in March than there are now. States with the largest number of workers facing cutoff of PUA benefits are California, New York, Pennsylvania, Texas and Ohio, which each show more than 300,000 workers losing benefits between March 14 and April 11.
- EB benefits could provide a backstop for these cutoffs in the absence of Congressional action, but EB eligibility is based on a convoluted calculation that generally requires an insured unemployment rate of at least 5.0 percent. Since the insured unemployment rate is calculated only based on workers claiming state benefits (not federal extension programs or PUA), few states will meet this requirement when CAUW Act benefits phase out. States can opt to use a total unemployment rate trigger of 6.5 percent, but many states condition use of that trigger on 100 percent federal funding provided temporarily by the CARES Act and later the CAUW Act (and expiring on March 14). While twenty-four states were on EB at the end of 2020, only twelve states are predicted to be able to offer these benefits on April 11. Because some of the largest states are triggering off, we predict that EB would only be able to protect 733,500 of those exhausting benefits. As a result of this, the net estimate of those who will have zero UI benefits coming to them after April 11 absent Congressional action is 10.63 million, actually more than our December 26, 2020 estimates of 9.11 million.22 Of particular significance those who run out of EB after receiving PEUC in 2020 during the phase out period may not be able to collect benefits.
- Timing of the cutoff will vary from worker to worker. Appendix Table 2 illustrates our estimates of when the 11.4 million workers would face a cutoff of benefits. In total, we estimate that 4.05 million workers would be impacted by the cut off of benefits exactly on March 14, because they restarted their benefits in 2021 or exhausted at the end of 2020. However, the majority (7.3 million) would see their benefits end at some point during the phase-out period through April 11, 2021.
A Backdrop of Geographic and Racial Barriers to Benefit Access
The on-again, off-again nature of UI benefits during the pandemic is exacerbating economic instability resulting from the geographic differences in unemployment and racial barriers workers face in accessing benefits. States use pandemic unemployment programs at different rates, as shown by Map 2, which displays the number of workers relying on pandemic aid as a share of the state workforce. The usage of pandemic benefits is greatest in states such as New York, Massachusetts, Hawaii, California, and Oregon, which each have more than 9 percent of the workforce receiving benefits; these states have both a high unemployment rate and traditionally rank among the top states in the share of workers collecting jobless benefits. In contrast, benefit penetration is lowest among Southeastern and Southwestern states, which—not coincidentally given the value that public policy places on workers of color—also consistently have among the largest share of Black and Latinx workers, including Mississippi, where 69 percent of the claimant population is Black and only 3.2 percent of the workforce will be receiving pandemic unemployment aid in March, and Arizona, where 33 percent of the claimant population is Latinx and only 3.48 percent of the workforce will be able to gain pandemic aid.23 Along these lines, a recent survey of workers during the pandemic found that 34 percent of Black workers and 26 percent of Latinx workers were denied benefits, compared to 14 percent of white applicants.24
In addition to benefit access disparities, states with higher shares of Black workers often have lower replacement rates; that is, their unemployment benefits typically replace a smaller percentage of workers’ pre-layoff wages. Louisiana, which has the lowest replacement rate (21.5 percent of wages) has the fourth-largest share of Black UI claimants.25 Louisiana and North Carolina both rank in the top ten states with the lowest replacement rates (first and third, respectively)26 and highest share of Black workers (fifth and ninth, respectively). Puerto Rico, where 96 percent of unemployment insurance claimants are Latinx, has the lowest UI benefit maximum in the United States, at just $190 per week. Allowing the FPUC top-off to expire will hurt workers of color in states with low benefits the hardest.
Further, workers of color are more likely to face longer jobless spells, and are in need of extended unemployment assistance the most. The average duration of unemployment for white workers is lower than that of Black and Asian workers.27 Cutting off support for the long-term unemployed will have lasting effects on the racial wage and wealth gaps.
Unemployment benefits have packed a tremendous economic punch across the country, but multiple aspects of the program—such as the right of employers to challenge worker claims in order to keep their taxes low, and inadequate language access to non-English speakers—have limited its reach. Provisions such as stimulus payments and the expanded child tax credit, which go out more automatically to the population, are especially critical in regions where UI penetration is limited.
Map 2. Share of Workforce Facing Cutoff of Pandemic Benefits
Congress and the Biden Administration Must Act Quickly to Avoid Going Over the Benefits Cliff
President Biden and members of his team have repeatedly emphasized that unemployment insurance benefits are a top priority, and the expiration date has been driving swift action by Congress on the budget resolution and other steps in the reconciliation process.28 This urgency is well placed. The state agencies responsible for delivering pandemic assistance have been deluged by record numbers of claims and unprecedented criminal activity seeking to fraudulently siphon off pandemic benefits. Most states have performed herculean feats in getting out stimulus payments, paying out $10 billion in the week ending January 29, which was the highest amount since last August. But these payouts came after delays that lasted between three and six weeks—or more, in many states—to restart PUC, PEUC, and PUA after then-President Trump waited until after benefits expired to enact the extension.
A recent analysis by The Century Foundation found that delays in the pandemic unemployment aid cost jobless workers over $17 billion in benefits in the first four weeks of January.29 Congress can avoid this chaos again by voting to continue these payments before the March 14 deadline. This March 14 date remains important even though there is a phaseout period. Some of the biggest delays have occurred among those who had exhausted benefits and then had to reapply, once again establishing that they were unemployed after a break. Avoiding such a break significantly cuts down on the procedural steps that states will need to put into place to continue benefits.
The stakes for families and the economy are extremely high. One in six households with children did not have enough food to eat last month.30 Black and Latinx adults were more than twice as likely to report food insecurity than white adults. Twenty percent of renters and 10 percent of homeowners are behind on housing payments, and the federal eviction moratorium, extended last month, ends in the middle of the UI phase-out, on March 31.31 Allowing 10.6 million workers to exhaust all jobless aid would have profound effects on financial stability and food and housing security.
Zooming out and looking at the broader macroeconomy, allowing UI programs to expire would suppress economic growth and hinder the recovery. In the short term, consumer spending, which comprises nearly 70 percent of GDP, would measurably decline. Research suggests that grocery and medical out-of-pocket spending declines by 15 percent when jobless workers exhaust UI benefits, and the drop persists for at least five months.32
Cutting off support for unemployed workers will have long-term effects on their labor market prospects. Workers with access to UI benefits for longer during/after the Great Recession had higher wages in their jobs after becoming reemployed.33 The positive effect of continued support for jobless workers was greatest for women, workers of color, and workers with lower levels of educational attainment. As a result, allowing unemployment assistance extensions to expire will disproportionately hurt disadvantaged workers and perpetuate wage and income inequality.
To save the American worker and the American economy, Congress must urgently act to extend expiring jobless benefits. Beyond extended benefit duration, the $300 FPUC supplement will expire on March 14 if CAUW Act programs are not extended. As a result, over 10 million workers who are able to continue collecting jobless aid after March 14 will face a $300 per week drop in income.34 Implementing the American Rescue Plan—extending PUA, PEUC, and FPUC, and increasing FPUC to $400 per week—will inject at least $9.6 billion into the economy per week (see Appendix Table 3 for state- and program-level estimates). Extending FPUC and increasing the weekly amount to $400, on its own, will provide up to $1.6 billion in aid to jobless workers per week above the $300 per week currently paid.
Table 1
| Per State, Per Week Impact of the American Rescue Plan (in Millions) | ||
| State | Existing Provisions ($300 PUC) | American Rescue Act w/$400 FPUC |
| Alabama | $50.35 | $60.24 |
| Alaska | $13.38 | $16.87 |
| Arizona | $76.93 | $95.19 |
| Arkansas | $30.80 | $37.12 |
| California | $1,626.99 | $1,933.25 |
| Colorado | $137.03 | $165.93 |
| Connecticut | $73.76 | $89.60 |
| Delaware | $10.57 | $13.19 |
| District of Columbia | $21.68 | $26.46 |
| Florida | $270.10 | $331.79 |
| Georgia | $194.32 | $236.31 |
| Hawaii | $57.35 | $68.01 |
| Idaho | $14.10 | $17.46 |
| Illinois | $346.77 | $417.20 |
| Indiana | $138.57 | $168.13 |
| Iowa | $39.28 | $47.63 |
| Kansas | $70.33 | $87.98 |
| Kentucky | $39.99 | $49.39 |
| Louisiana | $85.27 | $105.39 |
| Maine | $20.81 | $25.17 |
| Maryland | $133.00 | $160.23 |
| Massachusetts | $298.68 | $355.75 |
| Michigan | $267.96 | $320.75 |
| Minnesota | $110.53 | $135.63 |
| Mississippi | $25.90 | $32.10 |
| Missouri | $67.04 | $83.05 |
| Montana | $17.77 | $21.79 |
| Nebraska | $10.13 | $12.58 |
| Nevada | $126.40 | $151.43 |
| New Hampshire | $16.86 | $21.06 |
| New Jersey | $266.19 | $317.60 |
| New Mexico | $42.69 | $51.94 |
| New York | $868.14 | $1,051.43 |
| North Carolina | $136.74 | $163.90 |
| North Dakota | $9.17 | $10.94 |
| Ohio | $355.18 | $425.32 |
| Oklahoma | $48.50 | $58.35 |
| Oregon | $137.00 | $164.72 |
| Pennsylvania | $391.13 | $488.64 |
| Puerto Rico | $142.15 | $169.13 |
| Rhode Island | $39.30 | $48.54 |
| South Carolina | $58.14 | $71.48 |
| South Dakota | $2.63 | $3.35 |
| Tennessee | $71.58 | $85.87 |
| Texas | $556.72 | $657.42 |
| Utah | $13.47 | $16.34 |
| Vermont | $10.87 | $13.18 |
| Virgin Islands | $2.08 | $2.49 |
| Virginia | $164.86 | $197.17 |
| Washington | $133.90 | $164.56 |
| West Virginia | $25.88 | $31.64 |
| Wisconsin | $67.36 | $84.79 |
| Wyoming | $4.10 | $5.03 |
| U.S. Total | $7,940.39 | $9,570.54 |
| Source: Authors’ estimates using U.S. Department of Labor Data | ||
Conclusion
Unemployment benefit provisions under the CARES Act, and now under the CAUW Act, have been among the most successful policy interventions during the COVID-19 pandemic, targeting hundreds of billions of dollars in relief to those Americans who have suffered economically over the past year. Several months of dismal jobs growth figures underscore how the economy won’t be able to make a strong comeback until a vaccination program is fully in place and reducing spread of the coronavirus. The first step to building back a more equitable and inclusive economy during the pandemic is securing the incomes of Americans until that point. While unemployment benefits have been tremendously effective, states cannot be expected to quickly deliver aid when there is financial, policy, and legal uncertainty. After the display of states laboring to deliver CAUW Act benefits to workers within a month of enactment, Congress needs to act expeditiously to approve the next extension. More than 11 million Americans and their families are depending on Congress to make sure their economic lifeline is there until better days are reached.
Appendix
appendix table 1
| Workers Losing Pandemic Benefits | |||||
| State | Affected by PEUC Cut Off | Affected by PUA Cut Off | Total Workers Affected | Would be able to receive EB | Net Workers without Benefits |
| Alabama | 53,513 | 41,324 | 94,838 | 0 | 94,838 |
| Alaska | 5,335 | 8,004 | 13,339 | 4,245 | 9,094 |
| Arizona | 56,202 | 68,058 | 124,260 | 0 | 124,260 |
| Arkansas | 17,942 | 26,644 | 44,586 | 0 | 44,586 |
| California | 1,207,664 | 1,133,446 | 2,452,074 | 0 | 2,452,074 |
| Colorado | 66,778 | 98,333 | 165,111 | 0 | 165,111 |
| Connecticut | 62,698 | 29,274 | 91,972 | 52,591 | 39,381 |
| Delaware | 9,260 | 2,209 | 11,469 | 0 | 11,469 |
| District of Columbia | 16,225 | 13,397 | 29,622 | 0 | 29,622 |
| Florida | 255,286 | 125,368 | 380,654 | 0 | 380,654 |
| Georgia | 143,684 | 109,834 | 253,518 | 0 | 253,518 |
| Hawaii | 34,606 | 50,191 | 84,797 | 0 | 84,797 |
| Idaho | 5,838 | 9,437 | 15,275 | 0 | 15,275 |
| Illinois | 192,966 | 177,999 | 370,965 | 172,358 | 370,965 |
| Indiana | 55,101 | 154,672 | 209,772 | 0 | 209,772 |
| Iowa | 27,700 | 12,807 | 40,507 | 0 | 40,507 |
| Kansas | 26,641 | 28,644 | 55,285 | 24,661 | 30,625 |
| Kentucky | 30,603 | 20,732 | 51,335 | 0 | 51,335 |
| Louisiana | 53,568 | 76,944 | 130,512 | 0 | 130,512 |
| Maine | 12,020 | 15,728 | 27,748 | 0 | 27,748 |
| Maryland | 36,506 | 122,231 | 158,737 | 0 | 158,737 |
| Massachusetts | 132,770 | 292,463 | 425,232 | 0 | 425,232 |
| Michigan | 161,208 | 213,040 | 378,248 | 0 | 378,248 |
| Minnesota | 75,518 | 34,119 | 109,636 | 0 | 109,636 |
| Mississippi | 22,074 | 20,106 | 42,180 | 0 | 42,180 |
| Missouri | 34,411 | 55,118 | 89,529 | 0 | 89,529 |
| Montana | 4,770 | 18,083 | 22,853 | 0 | 22,853 |
| Nebraska | 5,074 | 4,426 | 9,499 | 0 | 9,245 |
| Nevada | 102,731 | 75,419 | 178,150 | 81,337 | 96,813 |
| New Hampshire | 5,827 | 9,933 | 15,760 | 0 | 15,760 |
| New Jersey | 149,454 | 252,847 | 402,302 | 133,541 | 268,761 |
| New Mexico | 29,395 | 25,614 | 55,009 | 25,637 | 29,372 |
| New York | 545,830 | 883,393 | 1,429,223 | 0 | 1,429,223 |
| North Carolina | 140,895 | 70,007 | 210,903 | 0 | 210,903 |
| North Dakota | 6,642 | 3,145 | 9,787 | 0 | 9,787 |
| Ohio | 83,283 | 381,657 | 464,940 | 0 | 464,940 |
| Oklahoma | 40,455 | 21,799 | 62,254 | 0 | 62,254 |
| Oregon | 57,729 | 142,629 | 200,358 | 0 | 200,358 |
| Pennsylvania | 190,235 | 452,243 | 642,478 | 159,888 | 482,589 |
| Puerto Rico | 36,723 | 213,489 | 250,212 | 34,988 | 215,225 |
| Rhode Island | 12,563 | 35,355 | 48,436 | 11,405 | 36,512 |
| South Carolina | 49,757 | 42,197 | 91,955 | 0 | 91,955 |
| South Dakota | 915 | 975 | 1,890 | 0 | 1,890 |
| Tennessee | 45,689 | 51,585 | 97,274 | 0 | 97,274 |
| Texas | 361,452 | 433,063 | 794,515 | 0 | 794,515 |
| Utah | 9,860 | 3,347 | 13,207 | 0 | 13,207 |
| Vermont | 8,950 | 3,181 | 12,131 | 0 | 12,131 |
| Virgin Islands | 1,754 | 815 | 2,569 | 1,754 | 815 |
| Virginia | 88,545 | 167,775 | 256,320 | 0 | 256,320 |
| Washington | 60,988 | 91,379 | 152,367 | 31,063 | 121,304 |
| West Virginia | 16,508 | 20,882 | 37,390 | 0 | 37,390 |
| Wisconsin | 37,160 | 21,208 | 58,368 | 0 | 58,368 |
| Wyoming | 3,093 | 1,084 | 4,177 | 0 | 4,177 |
| U.S. Total | 4,984,181 | 6,387,348 | 11,371,529 | 733,467 | 10,638,062 |
|
Updated: February 1,2021 / Data projected through April 2021 Source: Authors’ estimates using U.S. Department of Labor Data |
|||||
appendix table 2
| Breakdown by Timing of Cutoff | ||||||
| The hard cliff measures workers losing benefits on March 14 and the soft cliff measures workers losing benefits between March 15 and April 11. On April 11, all those with remaining PEUC or PUA eligibility will receive their last payment. | ||||||
| State | PUA | PUA + PEUC | ||||
| Hard | Soft | Total | Hard | Soft | Total | |
| Alabama | 20,421 | 20,903 | 41,324 | 39,295 | 55,543 | 94,838 |
| Alaska | 1,993 | 6,011 | 8,004 | 3,446 | 9,893 | 13,339 |
| Arizona | 39,354 | 28,703 | 68,058 | 51,369 | 72,891 | 124,260 |
| Arkansas | 14,452 | 12,192 | 26,644 | 21,000 | 23,596 | 44,58 |
| California | 287,649 | 864,973 | 1,152,623 | 695,35 | 1,756,722 | 2,452,074 |
| Colorado | 38,459 | 59,874 | 98,333 | 60,818 | 104,293 | 165,111 |
| Connecticut | 7,495 | 21,779 | 29,274 | 26,154 | 65,818 | 91,972 |
| Delaware | 543 | 1,665 | 2,209 | 2,407 | 9,061 | 11,469 |
| District of Columbia | 7,049 | 6,347 | 13,397 | 12,111 | 17,511 | 29,622 |
| Florida | 56,744 | 68,624 | 125,368 | 206,696 | 173,958 | 380,654 |
| Georgia | 61,453 | 48,381 | 109,834 | 101,399 | 152,119 | 253,518 |
| Hawaii | 26,838 | 23,352 | 50,191 | 33,335 | 51,462 | 84,797 |
| Idaho | 5,071 | 4,366 | 9,437 | 4,462 | 7,813 | 15,275 |
| Illinois | 33,020 | 144,978 | 177,999 | 63,816 | 277,149 | 370,965 |
| Indiana | 73,224 | 81,448 | 154,672 | 65,695 | 114,078 | 209,772 |
| Iowa | 5,876 | 6,931 | 12,807 | 19,142 | 21,365 | 40,507 |
| Kansas | 12,011 | 16,633 | 28,644 | 20,684 | 34,601 | 55,285 |
| Kentucky | 7,713 | 13,020 | 20,732 | 19,068 | 32,268 | 51,335 |
| Louisiana | 40,642 | 36,301 | 76,944 | 60,286 | 70,226 | 130,512 |
| Maine | 7,176 | 8,552 | 15,728 | 12,431 | 15,317 | 27,748 |
| Maryland | 65,956 | 56,245 | 122,231 | 80,704 | 78,663 | 158,373 |
| Massachusetts | 159,965 | 132,498 | 292,463 | 205,101 | 220,131 | 452,232 |
| Michigan | 121,643 | 91,397 | 213,040 | 175,370 | 198,877 | 374,248 |
| Minnesota | 18,592 | 15,527 | 34,119 | 55,491 | 54,145 | 109,636 |
| Mississippi | 10,563 | 9,543 | 20,106 | 19,004 | 23,177 | 45,180 |
| Missouri | 27,446 | 27,672 | 55,118 | 40,913 | 48,616 | 89,525 |
| Montana | 9,355 | 8,278 | 18,083 | 11,090 | 11,763 | 22,853 |
| Nebraska | 2,221 | 2,205 | 4,426 | 4,094 | 5,405 | 9,499 |
| Nevada | 14,769 | 60,649 | 75,419 | 47,961 | 130,188 | 178,150 |
| New Hampshire | 4,789 | 5,144 | 9,933 | 6,731 | 9,028 | 15,760 |
| New Jersey | 65,293 | 187,608 | 252,847 | 120,981 | 281,321 | 402,302 |
| New Mexico | 13,258 | 12,356 | 25,614 | 20,896 | 34,113 | 55,009 |
| New York | 223,852 | 659,541 | 883,939 | 410,237 | 1,018,986 | 1,429,223 |
| North Carolina | 31,992 | 38,016 | 70,007 | 85,290 | 125,613 | 210,903 |
| North Dakota | 1,458 | 1,687 | 3,145 | 4,228 | 5,559 | 9,787 |
| Ohio | 81,118 | 300,539 | 381,657 | 113,055 | 351,885 | 464,940 |
| Oklahoma | 11,953 | 9,847 | 21,799 | 30,713 | 31,541 | 62,254 |
| Oregon | 32,973 | 109,656 | 142,626 | 50,877 | 149,481 | 200,358 |
| Pennsylvania | 24,468 | 210,775 | 452,243 | 303,088 | 339,390 | 642,478 |
| Puerto Rico | 104,883 | 108,606 | 213,489 | 110,327 | 139,886 | 250,212 |
| Rhode Island | 7,785 | 28,089 | 35,874 | 11,539 | 36,897 | 48,436 |
| South Carolina | 18,79 | 23,406 | 42,197 | 36,815 | 55,140 | 91,955 |
| South Dakota | 528 | 448 | 975 | 775 | 1,115 | 1,890 |
| Tennessee | 26,493 | 25,093 | 51,585 | 40,071 | 57,203 | 97,274 |
| Texas | 230,542 | 202,540 | 433,063 | 269,457 | 525,058 | 794,515 |
| Utah | 996 | 2,351 | 3,347 | 4,959 | 8,248 | 13,207 |
| Vermont | 1,847 | 1,334 | 3,181 | 6,264 | 5,868 | 12,131 |
| Virgin Islands | 376 | 438 | 815 | 593 | 1,976 | 2,569 |
| Virginia | 86,725 | 81,049 | 167,775 | 121,170 | 135,149 | 256,320 |
| Washington | 22,484 | 68,896 | 91,379 | 29,877 | 122,490 | 152,367 |
| West Virginia | 10,618 | 10,265 | 20,882 | 18,304 | 19,086 | 37,390 |
| Wisconsin | 10,348 | 10,861 | 21,208 | 29,935 | 24,433 | 58,368 |
| Wyoming | 547 | 538 | 1,084 | 1,608 | 2,569 | 4,177 |
| US total | 2,408,768 | 3,978,580 | 6,387,348 | 4,048,852 | 7,322,676 | 11,371,592 |
| Source: Authors’ estimates using U.S. Department of Labor Data | ||||||
Appendix Table 3
| Weekly Benefit of Biden’s American Rescue Plan by Program (in Millions) | ||||||
| State FPUC300 | State FPUC400 | PUA + FPUC300 | PUA + FPUC400 | PEUC + FPUC300 | PEUC + FPUC400 | |
| Alabama | $3.13 | $4.17 | $20.00 | $24.13 | $27.22 | $31.94 |
| Alaska | $6.47 | $8.63 | $3.69 | $4.49 | $3.22 | $3.75 |
| Arizona | $17.50 | $23.34 | $29.40 | $36.21 | $30.02 | $35.64 |
| Arkansas | $5.60 | $7.46 | $15.41 | $18.08 | $9.79 | $11.58 |
| California | $183.17 | $244.23 | $669.74 | $785.00 | $774.08 | $904.03 |
| Colorado | $37.16 | $49.55 | $52.83 | $62.67 | $47.04 | $53.71 |
| Connecticut | $19.93 | $26.57 | $12.68 | $15.60 | $41.15 | $47.42 |
| Delaware | $4.43 | $5.90 | $1.07 | $1.30 | $5.07 | $6.00 |
| District of Columbia | $5.46 | $7.28 | $5.83 | $7.17 | $10.39 | $12.01 |
| Florida | $70.87 | $94.49 | $63.58 | $76.12 | $135.65 | $161.17 |
| Georgia | $49.90 | $66.53 | $63.43 | $74.41 | $80.99 | $95.36 |
| Hawaii | $6.55 | $8.74 | $25.88 | $30.90 | $24.92 | $28.38 |
| Idaho | $5.48 | $7.31 | $4.88 | $5.83 | $3.74 | $4.32 |
| Illinois | $100.00 | $133.34 | $120.69 | $138.49 | $126.07 | $145.37 |
| Indiana | $25.76 | $34.35 | $82.92 | $98.39 | $29.88 | $35.39 |
| Iowa | $12.90 | $17.20 | $6.76 | $8.04 | $19.62 | $22.39 |
| Kansas | $36.35 | $48.47 | $14.54 | $17.41 | $19.44 | $22.10 |
| Kentucky | $12.82 | $17.09 | $8.79 | $10.86 | $18.38 | $21.44 |
| Louisiana | $21.22 | $28.29 | $38.03 | $45.72 | $26.02 | $31.38 |
| Maine | $4.77 | $6.36 | $8.50 | $10.08 | $7.54 | $8.74 |
| Maryland | $34.05 | $45.41 | $72.68 | $84.90 | $26.27 | $29.92 |
| Massachusetts | $43.66 | $58.21 | $149.24 | $178.49 | $105.78 | $119.06 |
| Michigan | $46.11 | $61.49 | $124.74 | $146.04 | $97.10 | $113.22 |
| Minnesota | $42.40 | $56.53 | $14.13 | $17.54 | $54.01 | $61.56 |
| Mississippi | $5.96 | $7.95 | $9.06 | $11.07 | $10.88 | $13.08 |
| Missouri | $21.19 | $28.25 | $26.82 | $32.33 | $19.03 | $22.47 |
| Montana | $5.23 | $6.97 | $8.97 | $10.78 | $3.57 | $4.05 |
| Nebraska | $4.49 | $5.99 | $2.42 | $2.86 | $3.22 | $3.73 |
| Nevada | $21.65 | $28.86 | $35.30 | $42.84 | $69.46 | $79.73 |
| New Hampshire | $7.86 | $10.47 | $5.58 | $6.57 | $3.43 | $4.01 |
| New Jersey | $33.54 | $44.72 | $123.39 | $148.67 | $109.27 | $124.21 |
| New Mexico | $11.26 | $15.01 | $13.40 | $15.96 | $18.03 | $20.97 |
| New York | $121.10 | $161.46 | $389.19 | $477.53 | $357.86 | $412.44 |
| North Carolina | $18.21 | $24.28 | $43.38 | $50.38 | $75.15 | $89.24 |
| North Dakota | $2.38 | $3.17 | $1.62 | $1.93 | $5.17 | $5.83 |
| Ohio | $70.95 | $94.60 | $229.04 | $267.21 | $55.18 | $63.51 |
| Oklahoma | $10.87 | $14.50 | $11.12 | $13.30 | $26.51 | $30.55 |
| Oregon | $23.06 | $30.75 | $74.76 | $89.03 | $39.17 | $44.94 |
| Pennsylvania | $99.78 | $133.04 | $165.52 | $210.75 | $125.83 | $144.86 |
| Puerto Rico | $5.89 | $7.85 | $114.06 | $135.41 | $22.20 | $25.87 |
| Rhode Island | $13.18 | $17.58 | $17.59 | $21.17 | $8.53 | $9.79 |
| South Carolina | $12.46 | $16.61 | $19.92 | $24.14 | $25.76 | $30.74 |
| South Dakota | $1.59 | $2.12 | $0.44 | $0.54 | $0.59 | $0.68 |
| Tennessee | $13.68 | $18.24 | $33.90 | $39.06 | $24.01 | $28.58 |
| Texas | $63.75 | $85.00 | $237.80 | $281.11 | $255.17 | $291.31 |
| Utah | $4.66 | $6.22 | $1.64 | $1.97 | $7.16 | $8.15 |
| Vermont | $3.28 | $4.38 | $1.60 | $1.92 | $5.98 | $6.88 |
| Virgin Islands | $0.47 | $0.63 | $0.39 | $0.47 | $1.22 | $1.39 |
| Virginia | $20.03 | $26.71 | $93.02 | $109.80 | $51.80 | $60.66 |
| Washington | $46.29 | $61.72 | $42.22 | $51.36 | $45.39 | $51.49 |
| West Virginia | $6.08 | $8.10 | $10.21 | $12.30 | $9.59 | $11.24 |
| Wisconsin | $34.79 | $46.38 | $10.46 | $12.58 | $22.12 | $25.83 |
| Wyoming | $1.52 | $2.03 | $0.33 | $0.43 | $2.25 | $2.56 |
| U.S. Total | $1,480.89 | $1,974.52 | $3,332.59 | $3,971.32 | $3,126.91 | $3,624.70 |
appendix table 4
| Workers Losing Benefits beyond the FPUC Cliff | |||||
| State | State UI | PUA | PEUC | EB | Total |
| Alabama | 10,427 | 41,324 | 47,220 | 0 | 98,971 |
| Alaska | 21,582 | 8,004 | 5,335 | 820 | 35,742 |
| Arizona | 58,344 | 68,058 | 56,202 | 0 | 182,604 |
| Arkansas | 18,650 | 26,644 | 17,942 | 0 | 63,237 |
| California | 610,569 | 1,152,623 | 1,299,451 | 111,556 | 3,174,198 |
| Colorado | 123,878 | 98,333 | 66,778 | 0 | 288,989 |
| Connecticut | 66,429 | 29,274 | 62,698 | 8,061 | 166,462 |
| Delaware | 14,750 | 2,209 | 9,260 | 0 | 26,219 |
| District of Columbia | 18,207 | 13,397 | 16,225 | 0 | 47,829 |
| Florida | 236,235 | 125,368 | 255,286 | 0 | 616,889 |
| Georgia | 166,336 | 109,834 | 143,684 | 0 | 419,854 |
| Hawaii | 21,839 | 50,191 | 34,606 | 0 | 106,636 |
| Idaho | 18,281 | 9,437 | 5,838 | 0 | 33,556 |
| Illinois | 333,350 | 177,999 | 192,966 | 35,669 | 739,984 |
| Indiana | 85,873 | 154,672 | 55,101 | 0 | 295,645 |
| Iowa | 42,995 | 12,807 | 27,700 | 0 | 83,501 |
| Kansas | 121,169 | 28,644 | 26,641 | 0 | 176,454 |
| Kentucky | 42,732 | 20,732 | 30,603 | 0 | 94,068 |
| Louisiana | 70,718 | 76,944 | 53,568 | 0 | 201,229 |
| Maine | 15,892 | 15,728 | 12,020 | 0 | 43,641 |
| Maryland | 113,515 | 122,231 | 36,506 | 0 | 272,252 |
| Massachusetts | 145,522 | 292,463 | 132,770 | 4,607 | 575,362 |
| Michigan | 153,714 | 213,040 | 161,208 | 7,416 | 535,377 |
| Minnesota | 141,323 | 34,119 | 75,518 | 0 | 250,960 |
| Mississippi | 19,875 | 20,106 | 22,074 | 0 | 62,056 |
| Missouri | 70,623 | 55,118 | 34,411 | 0 | 160,152 |
| Montana | 17,425 | 18,083 | 4,770 | 0 | 40,278 |
| Nebraska | 14,964 | 4,426 | 5,074 | 0 | 24,464 |
| Nevada | 72,157 | 75,419 | 102,731 | 16,107 | 266,414 |
| New Hampshire | 26,186 | 9,933 | 5,827 | 0 | 41,946 |
| New Jersey | 111,799 | 252,847 | 149,454 | 6,308 | 520,409 |
| New Mexico | 37,523 | 25,614 | 29,395 | 3,417 | 95,949 |
| New York | 403,654 | 883,393 | 545,830 | 127,656 | 1,960,532 |
| North Carolina | 60,689 | 70,007 | 140,895 | 18,246 | 289,837 |
| North Dakota | 7,926 | 3,145 | 6,642 | 0 | 17,713 |
| Ohio | 236,503 | 381,657 | 83,283 | 10,814 | 712,258 |
| Oklahoma | 36,246 | 21,799 | 40,455 | 0 | 98,500 |
| Oregon | 76,881 | 142,629 | 57,729 | 10,241 | 287,480 |
| Pennsylvania | 332,592 | 452,243 | 190,235 | 23,185 | 998,255 |
| Puerto Rico | 19,624 | 213,489 | 36,723 | 1,339 | 271,175 |
| Rhode Island | 43,940 | 35,874 | 12,563 | 676 | 93,052 |
| South Carolina | 41,521 | 42,197 | 49,757 | 0 | 133,475 |
| South Dakota | 5,304 | 975 | 915 | 0 | 7,194 |
| Tennessee | 45,591 | 51,585 | 45,689 | 0 | 142,865 |
| Texas | 212,512 | 433,063 | 361,452 | 79,272 | 1,086,299 |
| Utah | 15,547 | 3,347 | 9,860 | 0 | 28,754 |
| Vermont | 10,947 | 3,181 | 8,950 | 0 | 23,078 |
| Virgin Islands | 1,570 | 815 | 1,754 | 0 | 4,138 |
| Virginia | 66,781 | 167,775 | 88,545 | 0 | 323,100 |
| Washington | 154,297 | 91,379 | 60,988 | 22,530 | 329,194 |
| West Virginia | 20,259 | 20,882 | 16,508 | 0 | 57,650 |
| Wisconsin | 115,952 | 21,208 | 37,160 | 0 | 174,320 |
| Wyoming | 5,077 | 1,084 | 3,093 | 0 | 9,254 |
| U.S. Total | 4,936,296 | 6,387,348 | 4,977,887 | 487,921 | 16,789,452 |
Methodology
The PEUC and EB estimates in this paper come from a flow analysis of reported first payments and final payments into regular and pandemic unemployment programs. For each program and state, exhaustion rates are calculated based on the lag between programs. Exhaustion rates are then applied to first payment levels to project the number of benefit exhaustions within the March 14 to April 11 period. Historical exhaustion rates for PEUC are used but are normed to a range limited to 0.6 to 0.8 to reflect reporting irregularities earlier in the program (the national average is 0.71). For PEUC, separate flows are calculated for those who went on to EB before December 26 and those who did not, and then combined into our final estimates and are used to derive the number of those who might collect EB after April 11.
For PUA estimates, a modified approach is used. Those remaining on PUA at the end of the year (and those estimated as having run out of program benefits in 2020) are divided into those who had a claim start before March 28, 2020; on March 28, 2020; and after. Differential exhaustion rates (70 to 75 percent) are applied to this group to estimate how many will still be on the program from March 14 to April 21. As stated above, the estimates include an assumption that new PUA claims will come in at mid-December levels through the first two months of the year and that 25 percent of those new applicants will be on the PUA caseload by March 14.
To estimate the number of states that will trigger off EB by mid-April, rendering still-jobless workers when PEUC expires ineligible for additional weeks when they exhaust their state weeks, we project the initial claims, state benefit exhaustions, re-employment rate, insured unemployment rate, and the total unemployment rate for each state the weeks between the weekly UI report released on February 4, 2021 and April 10, 2021.
To estimate initial claims, we take the three-week moving average of the change in total national initial claims and multiply that by the total national initial claims in the previous week. Then we take the ratio of state to national claims from the previous week and multiply it by the projected total claims of the current week. Based on our analysis of the adjusted exhaustion rate, we estimate that 45 percent of workers will become re-employed within twenty-six weeks, so for our re-employment estimates, we estimate 3 percent of continuing claims are discontinued each week due to workers becoming re-employed. To project the insured unemployment rate, we take the sum of the continuing claims in the previous week and 25 percent of the initial claims in the previous week and subtract the estimated exhaustions and re-employed workers, then we divide that by the total covered employment in the state. To estimate the total unemployment rate, we project that the national total unemployment rate will be 5.2 percent at the end of 2020, the midpoint between CBO and Federal Reserve estimates for the fourth quarter of 2021. As a result, we assume a constant month-over-month decrease of 2.11 percent. We then apply the ratio of state unemployment to national unemployment in the previous month to get the state-level unemployment rate for the current month.
Notes
- Andrew Stettner and Elizabeth Pancotti, “12 Million Workers Facing Jobless Benefit Cliff on December 26,” The Century Foundation, November 20, 2020, https://tcf.org/content/report/12-million-workers-facing-jobless-benefit-cliff-december-26/.
- Andrew Stettner, “A Shaky Bridge: Congress Averts Unemployment Cliff, but Fails to Secure Enough Jobless Aid,” The Century Foundation, December 21, 2020, https://tcf.org/content/commentary/shaky-bridge-congress-averts-unemployment-cliff-fails-secure-enough-jobless-aid/.
- Julie M. Whittaker and Katelin P. Isaacs, “Extending Unemployment Compensation Benefits During Recessions,” Congressional Research Service, October 1, 2014, https://crsreports.congress.gov/product/pdf/RL/RL34340.
- Jeff Stein and Erica Werner, “Senate vote paves way for passage of Biden’s economic relief plan,” Washington Post, February 5, 2021 https://www.washingtonpost.com/business/2021/02/04/senate-vote-a-rama-biden-economic-relief-stimulus/.
- President Joe Biden, Twitter post, January 31, 2021, 11:38 a.m., https://twitter.com/POTUS/status/1355918389655592962.
- “Employment Situation,” Bureau of Labor Statistics, February 5, 2021, https://www.bls.gov/news.release/pdf/empsit.pdf.
- Zachary Polin and Megan Curran, “Monthly poverty will spike without CARES Act unemployment benefits,” Center for Poverty and Social Policy, December 15, 2020, https://www.povertycenter.columbia.edu/news-internal/2020/forecasting-poverty/expiring-cares-act-jan-poverty-rise.
- Arthur Delaney and Igor Bobic, “Democrats Ditch $600 Unemployment Boost,” Huffington Post, February 2, 2021, https://www.huffpost.com/entry/democrats-extra-600-unemployment_n_6019987fc5b6aa4bad37f674.
- “ Unemployment Claims Monitor”, Federal Reserve Bank of Atlanta, https://www.frbatlanta.org/cweo/data-tools/unemployment-claims-monitor#:~:text=The%20Unemployment%20Claims%20Monitor%20provides,and%20Ex%2DService%20Member%20programs, accessed February 1, 2021
- Ellie Kaverman and Andrew Stettner, “Delay in Extending Unemployment Aid Has Shortchanged Workers $17 Billion in January,” The Century Foundation, February 2, 2021, https://tcf.org/content/commentary/tardy-stimulus-action-causes-pandemic-unemployment-benefit-delays.
- “Daily Treasury Statement,” U.S. Department of the Treasury, January 29, 2021, https://fsapps.fiscal.treasury.gov/dts/files/21012900.pdf.
- Assistant Secretary John Pallasch, “Unemployment Insurance Program Letter No. 16-20,” U.S. Department of Labor Employment and Training Administration, April 5 2020, https://wdr.doleta.gov/directives/attach/UIPL/UIPL_16-20.pdf.
- Assistant Secretary John Pallasch, “Unemployment Insurance Program Letter No. 17-20, Change 2,” U.S. Department of Labor Employment and Training Administration, December 31, 2020, https://wdr.doleta.gov/directives/corr_doc.cfm?DOCN=9291.
- Assistant Secretary John Pallasch, “Unemployment Insurance Program Letter No. 15-20, Change 3,” U.S. Department of Labor Employment and Training Administration, January 5, 2021, https://wdr.doleta.gov/directives/corr_doc.cfm?DOCN=6122.
- “How the New Program Works,” MixedEarners.org, https://mixedearners.org/eligibility.
- Assistant Secretary John Pallasch, “Unemployment Insurance Program Letter No. 24-20,” U.S. Department of Labor Employment and Training Administration, December 31, 2020, https://wdr.doleta.gov/directives/corr_doc.cfm?DOCN=7779.
- Assistant Secretary John Pallasch, “Unemployment Insurance Program Letter No. 09-21,” U.S. Department of Labor Employment and Training Administration, December 30, 2021, https://wdr.doleta.gov/directives/corr_doc.cfm?DOCN=3831.
- Assistant Secretary John Pallasch, “Attachment I to UIPL No. 16-20, Change 4,” U.S. Department of Labor Employment and Training Administration, January 8, 2021, https://wdr.doleta.gov/directives/attach/UIPL/UIPL_16-20_Change_4_Attachment_1_acc.pdf.
- “Unemployment Insurance Weekly Claims News Release,” U.S. Department of Labor, January 14, 2021, https://oui.doleta.gov/press/2021/011421.pdf.
- “COVID-19: Urgent Actions Needed to Better Ensure an Effective Federal Response,” Government Accountability Office, November 30, 2020, https://www.gao.gov/reports/GAO-21-191/.
- Andrew Stettner and Elizabeth Pancotti, “12 Million Workers Facing Jobless Benefit Cliff on December 26,” The Century Foundation, November 20, 2020, https://tcf.org/content/report/12-million-workers-facing-jobless-benefit-cliff-december-26/.
- “ETA 203: Characteristics of the Insured Unemployed,” U.S. Department of Labor Education and Training Administration, December 31, 2020, accessed February 4, 2021, https://oui.doleta.gov/unemploy/DataDownloads.asp.
- Rakeen Mabud, Maya Pinto, Amity Paye, and Sanjay Pinto, “Foundations for a Just and Inclusive Recovery,” National Employment Law Project, Cornell ILR, Times Up Foundation, and Color of Change, February 2021, https://www.nelp.org/wp-content/uploads/Foundations-for-Just-Inclusive-Recovery-Report.pdf.
- “UI Replacement Rates Report,” U.S. Department of Labor Education and Training Administration, 2020Q3, accessed February 4, 2021, https://oui.doleta.gov/unemploy/ui_replacement_rates.asp.
“ETA 203: Characteristics of the Insured Unemployed,” U.S. Department of Labor Education and Training Administration, December 31, 2020, accessed February 4, 2021, https://oui.doleta.gov/unemploy/DataDownloads.asp. - “UI Replacement Rates Report,” U.S. Department of Labor Education and Training Administration, 2020Q3, accessed February 4, 2021, https://oui.doleta.gov/unemploy/ui_replacement_rates.asp.
“Geographic Profile of Employment and Unemployment, 2019,” U.S. Bureau of Labor Statistics, July 31, 2020, accessed February 4, 2021, https://www.bls.gov/opub/geographic-profile/. - “Labor Force Statistics from the Current Population Survey, A-36. Unemployed Persons by Age, Sex, Race, Hispanic or Latino Ethnicity, Marital Status, and Duration of Unemployment,” U.S. Bureau of Labor Statistics, accessed on January 31, 2021, https://www.bls.gov/web/empsit/cpseea36.pdf.
- President Joe Biden, Twitter post, January 31, 2021, 11:38 a.m., https://twitter.com/POTUS/status/1355918389655592962.
- Ellie Kaverman and Andrew Stettner, “Delay in Extending Unemployment Aid Has Shortchanged Workers $17 Billion in January,” The Century Foundation, February 2, 2021, https://tcf.org/content/commentary/tardy-stimulus-action-causes-pandemic-unemployment-benefit-delays.
- “Tracking the COVID-19 Recession’s Effects on Food, Housing, and Employment Hardships,” Center on Budget and Policy Priorities, updated January 28, 2021, accessed February 5, 2021, https://www.cbpp.org/research/poverty-and-inequality/tracking-the-covid-19-recessions-effects-on-food-housing-and.
- “Fact Sheet: President-elect Biden’s Day One Executive Actions Deliver Relief for Families Across America Amid Converging Crises,” The White House, January 20,2021, https://www.whitehouse.gov/briefing-room/statements-releases/2021/01/20/fact-sheet-president-elect-bidens-day-one-executive-actions-deliver-relief-for-families-across-america-amid-converging-crises/.
- Peter Gangong and Pascal Noel, “Consumer Spending during Unemployment: Positive and Normative Implications,” American Economic Review, 2019, https://pubs.aeaweb.org/doi/pdfplus/10.1257/aer.20170537.
- Ammar Farooq, Adriana Kugler, and Uberto Muratori, “The Impacts of Unemployment Benefits on Job Match Quality and Labour Market Functioning,” VoxEU, February 7, 2021, https://voxeu.org/article/unemployment-benefits-job-match-quality-and-labour-market-functioning.
- The net effect of the FPUC cliff is lower, due to it coinciding with the soft PUA and PEUC cliffs. In total, 16.8 million workers claiming UI will stop receiving FPUC after March 13. More than 10 million will remain on UI after March 13, decreasing each week as the April 11 cliff approaches. See Appendix Table 4 for state- and program-level estimates.


