Today’s Labor Department report shows an economy maintaining strength as we enter the new year. The economy added 200,000 jobs in January, better than the disappointing 160,000 added in December. Job growth was led by the education and health services sectors, which added 38,000 jobs, and manufacturers continued their good streak, adding 15,000 jobs of their own.
The unemployment rate remained at a historically low 4.1 percent, the best the economy has seen since 2000. These overall numbers are largely on trend, and are not an indication of any bump in hiring sparked by the tax cuts in Congress or other actions. Overall, the percent of American working remained unchanged at 60.1 percent as labor force participation rate has stabilized in recent months. In January, the African American unemployment rate jumped by 0.9 to 7.7 percent, up from the historic low reached in December.
The biggest economic puzzle (and promise of tax reform) has been increasing wages. Americans have been waiting with bated breath during this long economic expansion for a real pay raise—and got mixed news this January in today’s job report. Hourly wages grew at 2.9-percent annual rate, the best yet in the recovery. But employers cut workers’ hours in January, meaning that total weekly paychecks only grew at 2.6 percent, down from a peak of 3.1 percent. Congress and the president promised workers raises out of the recent tax cuts, but the headlines have instead been dominated by one-time bonuses. With profits high and taxes low, there’s no excuse for companies not to give workers solid raises in 2018 and deliver consistent 3- to 4-percent wage growth that can finally provide a paycheck recovery along with the economic recovery.
As the economy matures, and the workforce ages, there are more employers complaining about worker shortages. With employers complaining so vocally about shortages of available workers, you’d expect more consistent and stronger wage gains. The data this month provide a good moment to look at the evidence, using four key indicators:
- Is labor participation at full capacity?
- Are jobs staying open longer without being filled?
- Are employers hiring workers with less skills?
- Are wages rising?
Point 1—Fail: Labor Force Participation Is Not at Full Capacity
The first point is that there is a far greater supply of available workers than the unemployment rate indicates. Chief among the indicators is the labor force participation rate, which has stabilized at 62.7 percent, 3.5 percentage points lower than it was a decade ago when the unemployment rate was significantly higher. The labor force participation rate has not moved materially since it bottomed out at 62.3 percent in September 2015. As we pointed out last month, just looking at prime age workers twenty-five to fifty-four, the decline in the unemployment rate is the equivalent of 3.5 million missing workers that employers can hire if they wanted. The economy still has not added enough jobs to cure the hangover of experienced long term-unemployed workers, with 21.5 percent of the unemployed having been out of work for six or more months (the long-term unemployment rate is typically around 15 percent or less during a strong economy).
Point 2—Fail: Employers Are Not Having Greater Difficulty Hiring for Available Positions
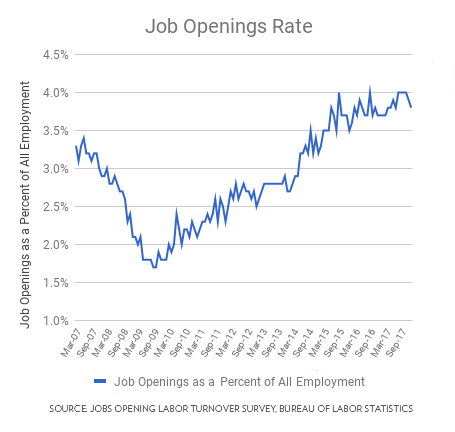
Employers don’t appear to be having more difficulty filling open jobs even as the unemployment rate has dropped. The job opening rate—the ratio of open jobs to total jobs—is one of the best measures of worker shortages. But, nationally, the job opening rate has been steady at 4 percent since July 2015, when the unemployment rate was 5.3 percent. The job opening rate of four percent does not necessarily mean it’s easy for employers to hire—but there’s no indication that worker shortages are increasing.
Figure 1
Point 3—Pass: Unemployment Rates Are Coming Down among the “Hardest to Hire”
One of the best results of tightening labor markets is that it helps workers that are less well-positioned in the job market to get hired. More evidence comes by looking at education. The unemployment rate is still higher among less-educated workers, but the gap is closing. Over the past eight years, as shown in Figure 2, the unemployment rate among those without a high school degree has dropped by 10.6, and by 6.8 percentage points among those with only a high school degree. That’s compared to a change of just 3 percentage points among college graduates over that time, who are always much less likely to be unemployed.
Figure 2
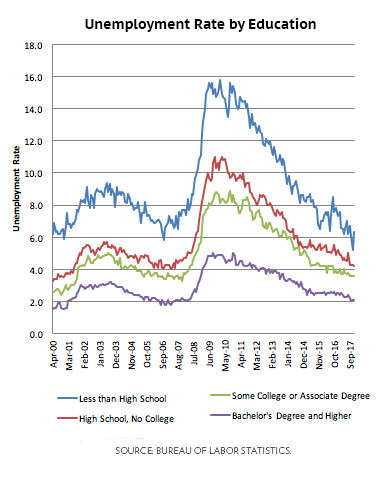
This runs counter to a primary theme in economics reporting in recent years: that lack of skills and education are what’s holding hiring back. In contrast, as employers have added jobs, the numbers of unemployed, lesser-educated workers has continued to drop—indicating that the problem was more centrally the lack of jobs, and not the lack of skills.
The best hope is that this is an indicator that employers are willing to take chance on workers with less education and experience, and contribute more training to them. While there’s not clear evidence of this in the data available in this month’s jobs report, there is evidence of a related theme. As the unemployment rate comes down for lesser-educated workers, there is wage growth among low- and some middle-wage occupations that don’t require a college degree. In a report earlier this week, the Bureau of Labor Statistics reported that over the past year, wages in blue-collar production and material moving jobs, sales jobs like cashier positions, and service jobs all grew faster than the national average while wages in management and professional jobs grew significantly slower. Agricultural employers like Christopher Ranch in California have had to increase pay from $11 to $13 to get enough workers on their fields.
Some of these occupations are well-paid careers. A survey by the Federal Reserve found employers complaining that they could not find sufficient workers in the construction and shipping industry. The number of job openings in construction has grown from low of 41,000 in May 2009 and a high of 238,000 in July 2016 and was still at the elevated level of 210,000 in November 2017. In a survey by the National Association of Manufacturers late last year, 73 percent of manufacturers said attracting and retaining a quality workforce was a chief business challenge. Two-thirds said they were responding by giving more work to existing employees. Indeed, the average manufacturing worker logged 3.5 hours of overtime in January, a three-year peak.
Point 4—Incomplete: Wages Are Tightening in Some Places and Occupations, but Not Economy-Wide
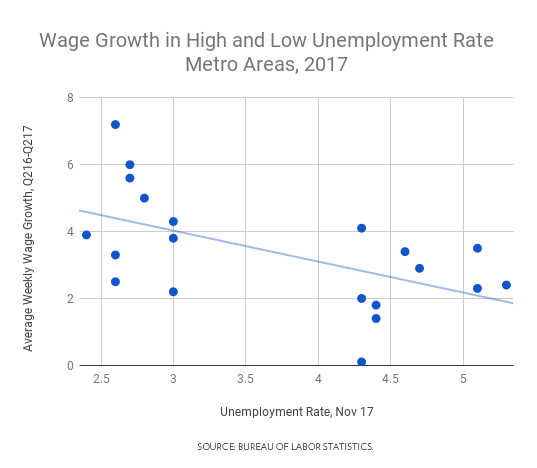
There have been a range of explanations for why the decreasing unemployment rate has not led to faster increases in wages. Among these are the increased monopoly power in the economy, the increased competition between U.S. workers and lower-paid nations, automation and technology, and the loss of worker bargaining power from union decline. But the enduring truth is that if the unemployment rate continues to drop, wage increases will come. Figure 3 and Table 1 look at the ten metropolitan areas with the lowest and highest unemployment rate and the most recent figures on wage growth—and areas with ultra-low unemployment rates like Minneapolis, Austin, San Francisco, and Denver are seeing the wage growth Americans have been waiting for. On the other hand, areas with higher unemployment rates like Houston, Hartford, Philadelphia, and Buffalo have not. This week, the Federal Reserve lowered its target for the long-term unemployment rate from 5.2 percent to 4.6 percent, and as the unemployment rate is allowed to drop, more cities will see the kind of tight job markets that will deliver sustained wage increases. What’s going on today is likely that employers are more likely to hire workers with less education and experience, and are becoming more willing to hire them for a job.
Conclusion
If you are keeping score, the data indicate that this month’s don’t pass the four point test for a labor market shortage. In January, and over the past several years, when employers have wanted to add workers they have generally been able to find them among the legions of Americans who have been unemployed or out of the workforce. This has brought welcome big drops in the unemployment rate for lesser-educated workers, and above-average pay increases in low-wage and some middle-wage jobs. More is needed—and will come from further employment gains across the country.
Figure 3
| Table 1. Wage Growth in Low and High Unemployment Rate Metro Areas |
| Lowest unemployment rate metro areas |
|
Unemployment rate,
November 2017 |
Average Weekly Wage Growth,
Year-over-year, Q2 2016-2017 |
| Minneapolis |
2.4 |
3.9 |
| Nashville |
2.6 |
3.3 |
| Salt Lake City |
2.6 |
2.5 |
| San Francisco |
2.6 |
7.2 |
| Austin |
2.7 |
5.6 |
| San Jose-Sunnyvale |
2.7 |
6 |
| Denver-Aurora |
2.8 |
5 |
| Boston |
3 |
3.8 |
| Milwaukee |
3 |
2.2 |
| San Antonio |
3 |
4.3 |
| Highest unemployment rate metro areas |
| |
Unemployment rate,
November 2017 |
Average Weekly Wage Growth,
Year-over-year, Q2 2016-2017 |
| Houston |
4.3 |
0.1 |
| New York |
4.3 |
2 |
| Pittsburgh |
4.3 |
4.1 |
| Hartford |
4.4 |
1.4 |
| Philadelphia |
4.4 |
1.8 |
| Cleveland |
4.6 |
3.4 |
| Chicago |
4.7 |
2.9 |
| Las Vegas |
5.1 |
2.3 |
| Rochester, NY |
5.1 |
3.5 |
| Buffalo |
5.3 |
2.4 |
Source: Bureau of Labor Statistics
|
Cover Image: Andreas Klinke Johannsen/Flickr.
Tags: jobs report


How Big Are Labor Shortages in Today’s Job Market?
Today’s Labor Department report shows an economy maintaining strength as we enter the new year. The economy added 200,000 jobs in January, better than the disappointing 160,000 added in December. Job growth was led by the education and health services sectors, which added 38,000 jobs, and manufacturers continued their good streak, adding 15,000 jobs of their own.
The unemployment rate remained at a historically low 4.1 percent, the best the economy has seen since 2000. These overall numbers are largely on trend, and are not an indication of any bump in hiring sparked by the tax cuts in Congress or other actions. Overall, the percent of American working remained unchanged at 60.1 percent as labor force participation rate has stabilized in recent months. In January, the African American unemployment rate jumped by 0.9 to 7.7 percent, up from the historic low reached in December.
The biggest economic puzzle (and promise of tax reform) has been increasing wages. Americans have been waiting with bated breath during this long economic expansion for a real pay raise—and got mixed news this January in today’s job report. Hourly wages grew at 2.9-percent annual rate, the best yet in the recovery. But employers cut workers’ hours in January, meaning that total weekly paychecks only grew at 2.6 percent, down from a peak of 3.1 percent. Congress and the president promised workers raises out of the recent tax cuts, but the headlines have instead been dominated by one-time bonuses. With profits high and taxes low, there’s no excuse for companies not to give workers solid raises in 2018 and deliver consistent 3- to 4-percent wage growth that can finally provide a paycheck recovery along with the economic recovery.
As the economy matures, and the workforce ages, there are more employers complaining about worker shortages. With employers complaining so vocally about shortages of available workers, you’d expect more consistent and stronger wage gains. The data this month provide a good moment to look at the evidence, using four key indicators:
Sign up for updates.
Point 1—Fail: Labor Force Participation Is Not at Full Capacity
The first point is that there is a far greater supply of available workers than the unemployment rate indicates. Chief among the indicators is the labor force participation rate, which has stabilized at 62.7 percent, 3.5 percentage points lower than it was a decade ago when the unemployment rate was significantly higher. The labor force participation rate has not moved materially since it bottomed out at 62.3 percent in September 2015. As we pointed out last month, just looking at prime age workers twenty-five to fifty-four, the decline in the unemployment rate is the equivalent of 3.5 million missing workers that employers can hire if they wanted. The economy still has not added enough jobs to cure the hangover of experienced long term-unemployed workers, with 21.5 percent of the unemployed having been out of work for six or more months (the long-term unemployment rate is typically around 15 percent or less during a strong economy).
Point 2—Fail: Employers Are Not Having Greater Difficulty Hiring for Available Positions
Employers don’t appear to be having more difficulty filling open jobs even as the unemployment rate has dropped. The job opening rate—the ratio of open jobs to total jobs—is one of the best measures of worker shortages. But, nationally, the job opening rate has been steady at 4 percent since July 2015, when the unemployment rate was 5.3 percent. The job opening rate of four percent does not necessarily mean it’s easy for employers to hire—but there’s no indication that worker shortages are increasing.
Figure 1
Point 3—Pass: Unemployment Rates Are Coming Down among the “Hardest to Hire”
One of the best results of tightening labor markets is that it helps workers that are less well-positioned in the job market to get hired. More evidence comes by looking at education. The unemployment rate is still higher among less-educated workers, but the gap is closing. Over the past eight years, as shown in Figure 2, the unemployment rate among those without a high school degree has dropped by 10.6, and by 6.8 percentage points among those with only a high school degree. That’s compared to a change of just 3 percentage points among college graduates over that time, who are always much less likely to be unemployed.
Figure 2
This runs counter to a primary theme in economics reporting in recent years: that lack of skills and education are what’s holding hiring back. In contrast, as employers have added jobs, the numbers of unemployed, lesser-educated workers has continued to drop—indicating that the problem was more centrally the lack of jobs, and not the lack of skills.
The best hope is that this is an indicator that employers are willing to take chance on workers with less education and experience, and contribute more training to them. While there’s not clear evidence of this in the data available in this month’s jobs report, there is evidence of a related theme. As the unemployment rate comes down for lesser-educated workers, there is wage growth among low- and some middle-wage occupations that don’t require a college degree. In a report earlier this week, the Bureau of Labor Statistics reported that over the past year, wages in blue-collar production and material moving jobs, sales jobs like cashier positions, and service jobs all grew faster than the national average while wages in management and professional jobs grew significantly slower. Agricultural employers like Christopher Ranch in California have had to increase pay from $11 to $13 to get enough workers on their fields.
Some of these occupations are well-paid careers. A survey by the Federal Reserve found employers complaining that they could not find sufficient workers in the construction and shipping industry. The number of job openings in construction has grown from low of 41,000 in May 2009 and a high of 238,000 in July 2016 and was still at the elevated level of 210,000 in November 2017. In a survey by the National Association of Manufacturers late last year, 73 percent of manufacturers said attracting and retaining a quality workforce was a chief business challenge. Two-thirds said they were responding by giving more work to existing employees. Indeed, the average manufacturing worker logged 3.5 hours of overtime in January, a three-year peak.
Point 4—Incomplete: Wages Are Tightening in Some Places and Occupations, but Not Economy-Wide
There have been a range of explanations for why the decreasing unemployment rate has not led to faster increases in wages. Among these are the increased monopoly power in the economy, the increased competition between U.S. workers and lower-paid nations, automation and technology, and the loss of worker bargaining power from union decline. But the enduring truth is that if the unemployment rate continues to drop, wage increases will come. Figure 3 and Table 1 look at the ten metropolitan areas with the lowest and highest unemployment rate and the most recent figures on wage growth—and areas with ultra-low unemployment rates like Minneapolis, Austin, San Francisco, and Denver are seeing the wage growth Americans have been waiting for. On the other hand, areas with higher unemployment rates like Houston, Hartford, Philadelphia, and Buffalo have not. This week, the Federal Reserve lowered its target for the long-term unemployment rate from 5.2 percent to 4.6 percent, and as the unemployment rate is allowed to drop, more cities will see the kind of tight job markets that will deliver sustained wage increases. What’s going on today is likely that employers are more likely to hire workers with less education and experience, and are becoming more willing to hire them for a job.
Conclusion
If you are keeping score, the data indicate that this month’s don’t pass the four point test for a labor market shortage. In January, and over the past several years, when employers have wanted to add workers they have generally been able to find them among the legions of Americans who have been unemployed or out of the workforce. This has brought welcome big drops in the unemployment rate for lesser-educated workers, and above-average pay increases in low-wage and some middle-wage jobs. More is needed—and will come from further employment gains across the country.
Figure 3
November 2017
Year-over-year, Q2 2016-2017
November 2017
Year-over-year, Q2 2016-2017
Source: Bureau of Labor Statistics
Cover Image: Andreas Klinke Johannsen/Flickr.
Tags: jobs report