
When it comes to our nation’s economy, it can easily seem like there’s nothing but good news. Headlines repeatedly highlight low unemployment and ongoing job growth, which contributes to a public narrative that the economy is strong. The Great Recession, it seems, must be behind us.
But if the recession is indeed a thing of the past, it’s only past for some. Digging deeper exposes that middle and low-income workers and their families in the United States have not reaped their share of the benefits of the apparent recovery, benefits that such a recovery should produce for all, and not only the few. Data shows that, in fact, it’s only wealthier households and larger corporations that have gained noticeably since the recession ended a decade ago. This is because long-developing trends of inequality have proven impervious to the decade’s economic growth.
It’s no surprise that boasts of a record-breaking economic recovery ring hollow to most Americans, for whom today’s wages are barely enough—and often not enough—to meet their basic needs, let alone the conditions of a modern middle-class life, like adequate health care and a quality education for their kids. And the wealthier of us shouldn’t sit smugly on the rewards they’re reaping from this lopsided prosperity: these economic failings don’t only matter to the lower classes. Rather, they are a symptom of declining investment and productivity growth, declines that threaten not only the strength of the current economy but its fortunes in decades to come. If these unbalanced conditions aren’t corrected, and soon, then everyone loses.
This report seeks to make those conditions clear: that not only is the economy weaker than the headlines, and the current administration’s rhetoric, would have us believe, but also the gains, however unequal, that it has acquired rest on fragile grounds indeed. The report will do so by delineating a set of straightforward facts about the current economy, based on and demonstrated through wide-reaching data, that will illustrate the weaknesses that lie just below the surface of the most frequently reported numbers.
Here are the key takeaways of the report’s analysis:
- Wages and incomes continue to stagnate as working Americans struggle to maintain living standards, especially those with children.
- A larger share of America’s workers earn low wages than do workers in other high-income nations.
- Wage gaps between white workers and workers of color persist; in fact, some gaps have even widened.
- Pay hikes in rural areas of the country have not kept up with urban locales.
- Those at the bottom of the income ladder are falling further behind those at the top.
- Workers’ share of national income has not improved from its post-recession low.
- Underemployment- and low employment-to-population ratios indicate that the economy is not providing enough jobs for the people who are willing and able to work.
- Public investment as a share of GDP is at its lowest levels since the end of the Second World War.
- The current economic expansion has brought no substantial boosts to productivity, innovation, and capital investment, limiting its potential for future growth.
Taken together, these data reveal an economy that, years after the end of the Great Recession, is underperforming on many significant metrics. This broad-based underperformance calls for a more proactive and progressive economic policy to end wage stagnation, stimulate investment, and avoid future economic crises. The current federal economic policies, which consist of poorly targeted tax cuts and deregulation, have done nothing of note to build broadly shared prosperity.
The Economy Is Not Delivering Broadly Shared Prosperity
Wage Growth in This Recovery versus That of Previous Recoveries
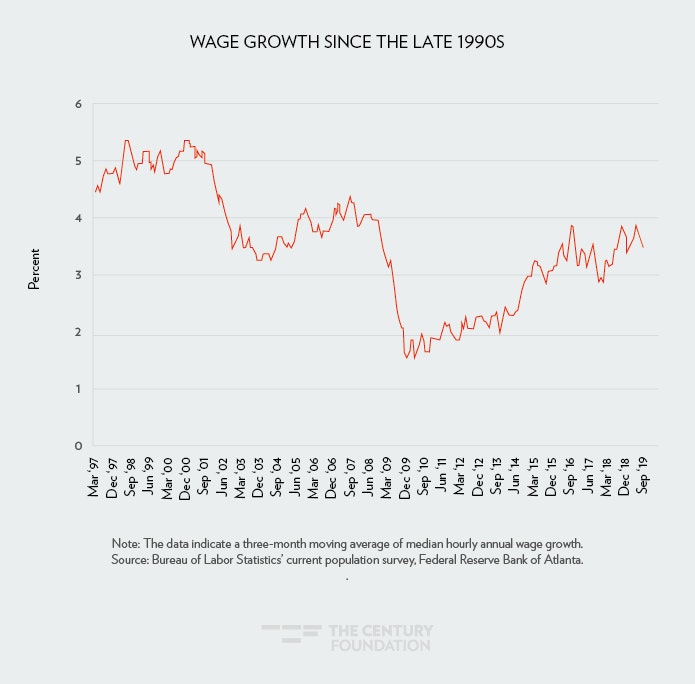
Despite the braggadocious tone of the current administration, where raises of $4,000 a year were predicted as a byproduct of the tax cuts of 2017, workers have not reaped the benefits of an economy in its tenth year of expansion.1 Wage growth still has not consistently reached the 3.5–4 percent year-over-year range for all nonfarm employees, which is the level of pay raises that should coincide with 2–2.5 percent inflation and 1.5 percent productivity growth. Indeed, at no period in the current recovery has year-over-year pay growth cracked the 4 percent threshold (see Figure 1). Contrast this with the two previous recoveries of the 1990s and 2000s where, at their height, production and nonsupervisory workers were seeing twelve-month wage growths of 4–5.3 percent. The peak wage growth during the Trump administration was 3.9 percent in the summer of 2019, no greater than the peak under the Obama administration in the fall of 2016, and far below the peak of 5.3 percent in the late 1990s and 4.3 percent in the mid 2000s.
Among production and nonsupervisory workers—who constitute about 80 percent of the nation’s workforce—pay increases have been relatively meager, averaging just 2.3 percent annually over the period of this expansion. The expansions during the decades of the 1990s and 2000s yielded average annual wage growth of 3.2 and 3.1 percent, respectively. Relative to these recoveries, the expansion following the conclusion of the Great Recession has yielded disappointing wage growth.
Figure 1
American Workers Consistently Fall Behind the Rest of World
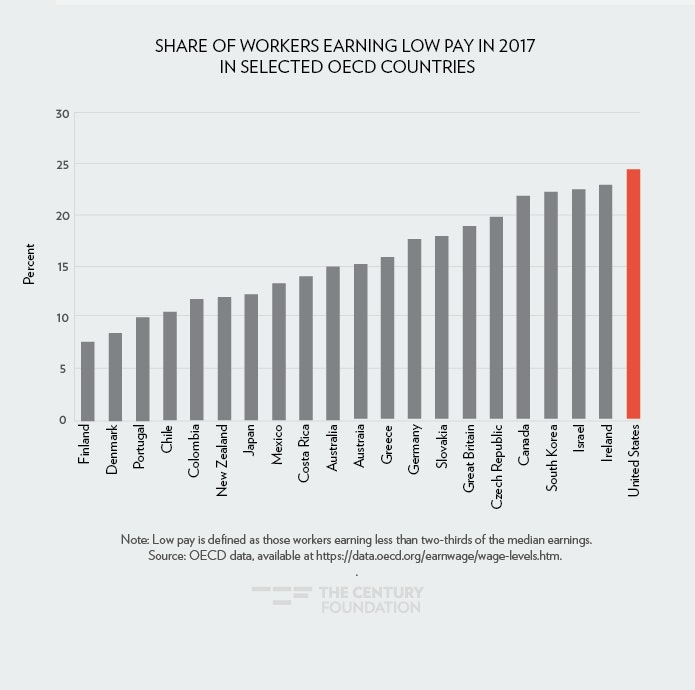
Among the Organisation for Economic Co-operation and Development (OECD) member nations, the United States is an outlier, with workers earning lower pay in comparison. When defined as the share of workers earning less than two-thirds of the median wage, nearly a quarter of U.S. workers are employed in low-paying jobs (see Figure 2). Defining low wage work using a percentage (67 percent) of the median wage demonstrates that while the median household in the United States may be seeing pay increases, a larger share of lower-wage workers are being left behind, especially in comparison to other high-income countries. Wage growth in the United States has also consistently lagged behind other OECD nations since the 1990s.2 This relationship with other OECD nations has not changed markedly over time: America has been a consistently low-wage society, including now, despite being in the midst of the country’s longest economic recovery on record.3
Figure 2
Wages by Gender and Race
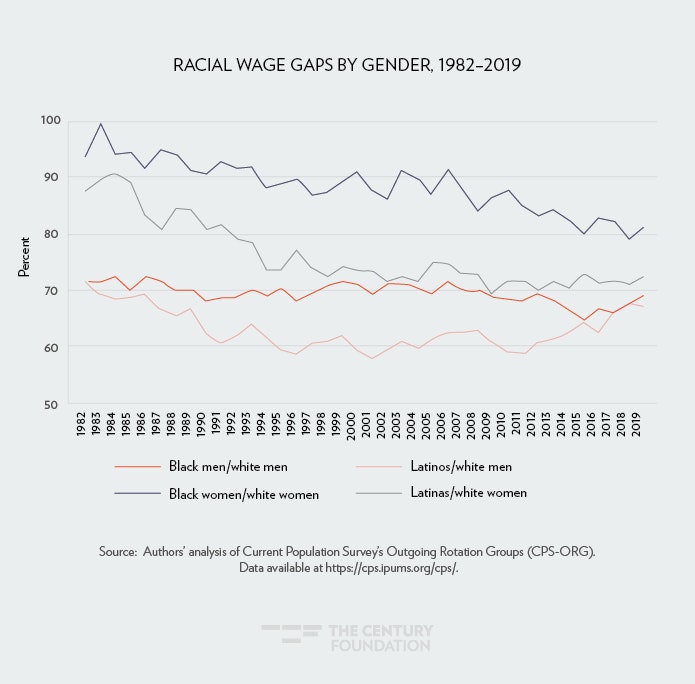
The recent recovery has not narrowed wage gaps between workers of different races and genders. Despite men and women of various racial and ethnic minorities making modest wage gains in the past five years, there have been persistent wage gaps between groups. Black men earn less than 70 percent of what white men earn in weekly wages in 2019, even after a modest closing of the gap since 2015. Indeed, the wage gap today for black men relative to white men is wider this year than it was in 1982 (See Figure 3). Black women earned about the same weekly wage as white women in 1982, but only earn 81 percent of white women’s median weekly wage in 2019. Latinas’ wage gap also worsened from near parity in the early 1980s to 73 percent of white women’s median wages in 2019.
Figure 3
Wage Growth at the Bottom Is Weak
At the bottom of the income distribution, wage growth is lagging (see Figure 4). While the top 25 percent of workers are seeing pay increases in excess of 4 percent year-over-year in 2019, and the 50–75th percentile range has seen increased wage growth since late 2018, the 25–50th and bottom quartile only surpassed the 3 percent annual hourly wage growth in the spring of this year. That is, the bottom three quarters of the income distribution have not received the same wage increases that the top 25 percent have enjoyed since the middle of 2018.
Furthermore, since 2015, the growth gap between the top and bottom of the income distribution has widened. Over longer periods of time, gaps such as these further contribute to income inequalities in the economy. Lackluster wage growth is also indicative of an economy not at full employment. If the country were at full employment, we would see accelerating wage growth, especially among lower-wage workers.
Figure 4

Costs of Living Continue to Increase
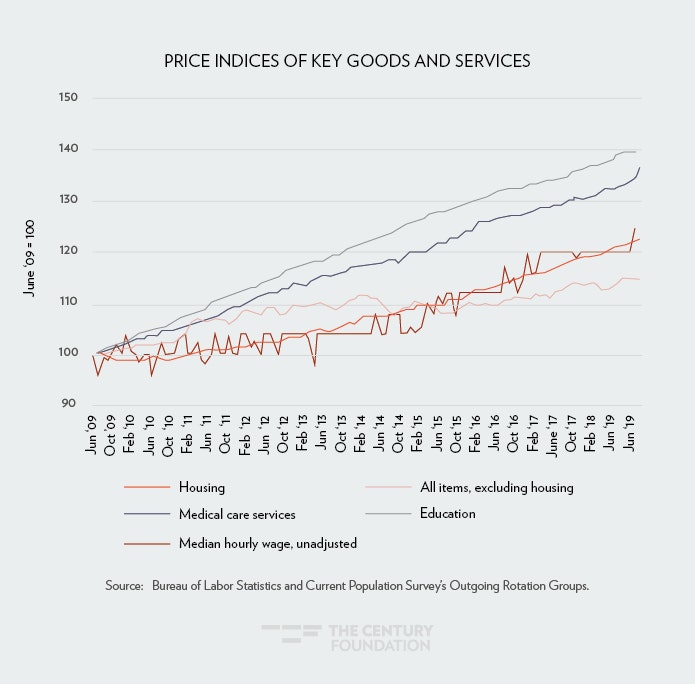
It has also become increasingly clear that the costs of goods and services normally associated with a decent standard of living have become prohibitively expensive relative to the cost of commodities in general, as measured through the overall consumer price index (see Figure 5). While prices in general (“All Items, less shelter,” or everything except housing) have increased by about 15 percent since June 2009, housing prices have increased by nearly 23 percent. Medical services, of which health insurance is a major component, have increased by 36 percent since June 2009. The cost of education has also exploded by 40 percent relative to the start of the current recovery. Non-inflation-adjusted median hourly wages have increased by 25 percent since June 2009, meaning that the costs of education and medical care have substantially outpaced increases in pay since the start of the recovery.
The prices of goods and services that we normally associate with a comfortable life—affordable higher education for your children, an adequately sized home with an affordable mortgage or monthly rent, health care that offers comprehensive coverage at a reasonable cost—are breaking the bank for working class people. Those that cannot keep up with these costs go without these necessities or they take on debt to purchase them.
Figure 5
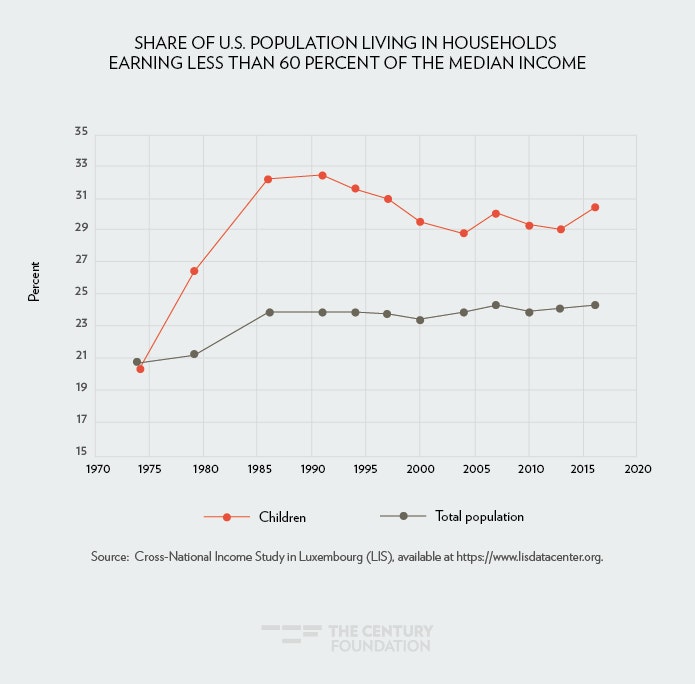
Poverty Rates Remain High, Particularly among Children
Despite decreases in the number of persons and children in poverty (according to the official poverty measure and the supplemental poverty measure of the U.S. Census Bureau), 38 million people were in poverty in 2018, including nearly 12 million children.4 Relative poverty measures can be used to measure poverty in relation to some income threshold of the population, usually some fraction of median income. These metrics provide more meaningful data than do those measuring absolute poverty levels, like that of the official poverty measure (OPM) and the supplemental poverty measure (SPM), which is based on a minimum basket of commodities considered to be necessary to basic subsistence in the 1960s—plus adjustments based on cash transfers and government assistance, in the case of the SPM.5 Absolute measures like the OPM do not account for the changing nature of consumption or increasing costs over time, nor do they peg the poverty rate to the average income earner. Relative poverty measures better adjust for changing standards of living, and, furthermore, are closer to how most people think about poverty.6
At 60 percent of the median income, nearly a quarter of the population was in poverty in 2016, while nearly 31 percent of children were in poverty (see Figure 6). In 2016—the latest available year of data—60 percent of the median household income was $35,423 annually. By this measure, the share of children in poverty actually increased substantially from 2013 to 2016. This persistent deprivation is perhaps the clearest indication that the economy is not working for everyone, particularly for the most marginalized populations. The recovery following the Great Recession has not adequately lifted the incomes of prime-age workers or working families with children.
Figure 6
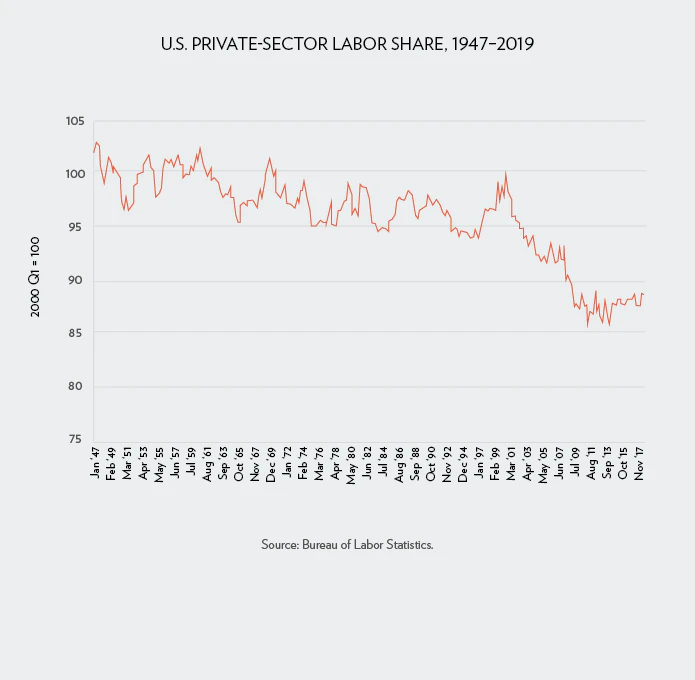
Labor Share of National Income Is Low
The metric “labor share of national income” measures the share of the gross domestic product that accrues to wage-earners in an economy. It can serve as a proxy for worker power in the United States and the division of national income between workers’ wages and companies’ profits. The recent decline in the labor share since the early 2000s has remained an issue (see Figure 7), one that economists have struggled to resolve, but some argue it is a reflection of the declining clout of labor relative to capital. Union density is much lower than it was in the 1970s in the United States, while monopolization of firms, stock buy-backs, non-compete clauses, weakened labor protections, offshoring, global supply chains, the increased role of financial institutions in the global economy, outsourcing, and the proliferation of part-time and low-wage work have undercut workers’ ability to claim a larger share of national gains.7 This also means that productivity gains do not necessarily result in adequate pay increases (more on that in Figure 14).
One might expect that the long recovery of the 2010s would reverse the sharp decline that began in the early 2000s. But there has only been a marginal increase in the share between 2014 and 2018. In fact, the labor share remains lower today than at any period of expansion on record since 1947.
Figure 7
Inequality
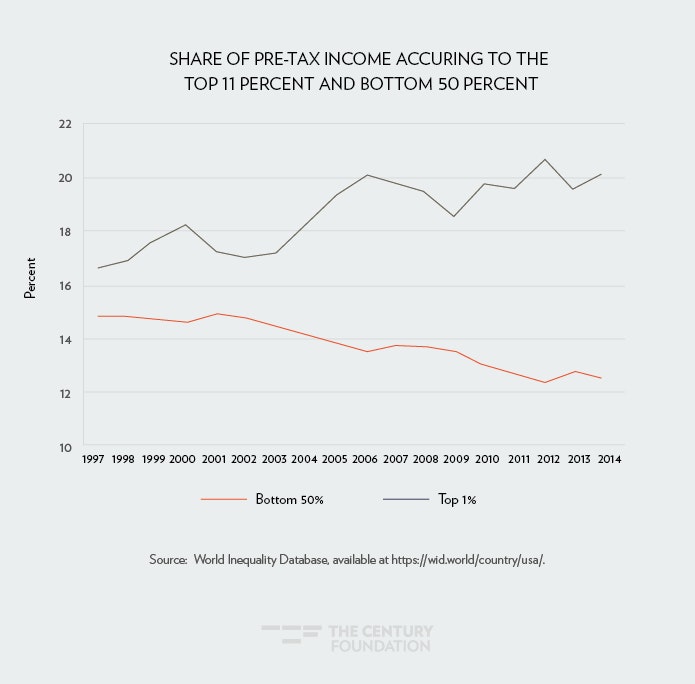
The U.S. Census Bureau has reported that 23 percent of all new income in 2018 went to the top 5 percent of households, with the middle quintile receiving 14.1 percent and the lowest quintile 3.1 percent.8 Contrast these data with those of 1968, when the top 5 percent of households took home 16.3 percent of income, the middle quintile 17.6 percent, and the lowest quintile 4.2 percent. Income share at the top has steadily increased since the Great Recession (See Figure 8).
According to the World Inequality Database, the bottom half of the income distribution took home only 12.5 percent of the income generated in 2014, while the top 1 percent took home 20 percent of income in the same year.9
Figure 8
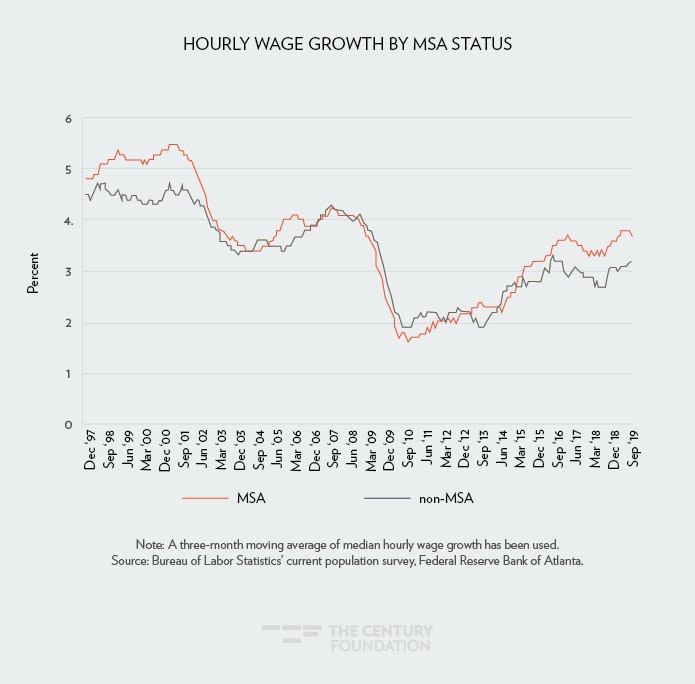
Regional Inequalities
There is also evidence that wage growth varies by rural and urban locales (see Figure 9). Since 2016, workers located in metropolitan statistical areas (MSAs) have seen hourly wage growth ranging from 3.2 to 3.8 percent. In contrast, workers in non-MSA areas saw hourly wage growth of 2.8 to 3.2 percent over the same period. While the divergence between the two groups was not apparent in the immediate aftermath of the Great Recession, the gap has remained since early 2016. This could speak to the concentration of high-wage job growth in cities while rural areas of the country have been left behind, contrary to the promises of the Trump administration has claimed for its economic policy.
Figure 9
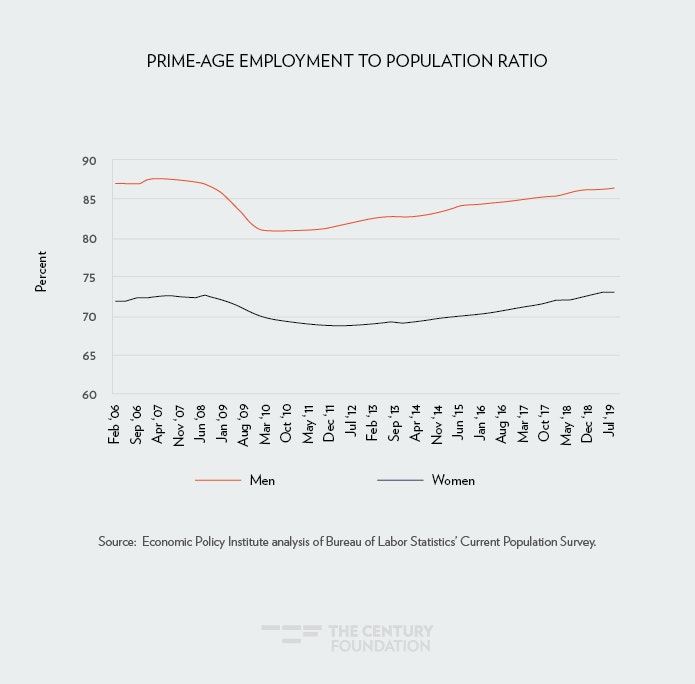
Employment to Population Ratio is Historically Low for This Stage of a Recovery
The employment to population ratio (EPOP), the share of prime-age people who are employed, has been low and slow to recover from the Great Recession, when compared with previous recoveries. When this ratio is low, it either means that people looking for work could not find it, or that the jobs they could find were not sufficient in terms of pay, conditions, or other preferences. These people—those who are no longer participating in the labor force—are not counted in unemployment rates.
Before the most recent recession hit, there was, to some degree, an upward trend in both of these indicators, for both men and women, loosely indicating that decent jobs were widely available. However, when millions of jobs were lost during the Great Recession, many did not immediately return to the labor force. After each of the two recessions that preceded the Great Recession, it took men’s EPOP between six and eight years to recover. By contrast, during the current recovery, it took a decade for women’s EPOP to return to the pre-Recession level of 72—finally reaching it in 2018. Men’s EPOP is still lower than it was before the Great Recession, which is yet another sign that the economy is operating at less than full employment, still not reaching the 87 percent that it had in late 2007 (see Figure 10).
Figure 10
The Economy Has Not Developed a Foundation for Future Growth
In tandem with an economy that is falling short for workers in terms of pay, employment opportunities, and costs of living, there are macroeconomic indicators that suggest the productive potential of the economy is being squandered—whether through wasteful tax cuts, a prematurely aborted stimulus plan, or interest rate increases that were quickly followed by rate cuts when signs of an economic slowdown appeared.10
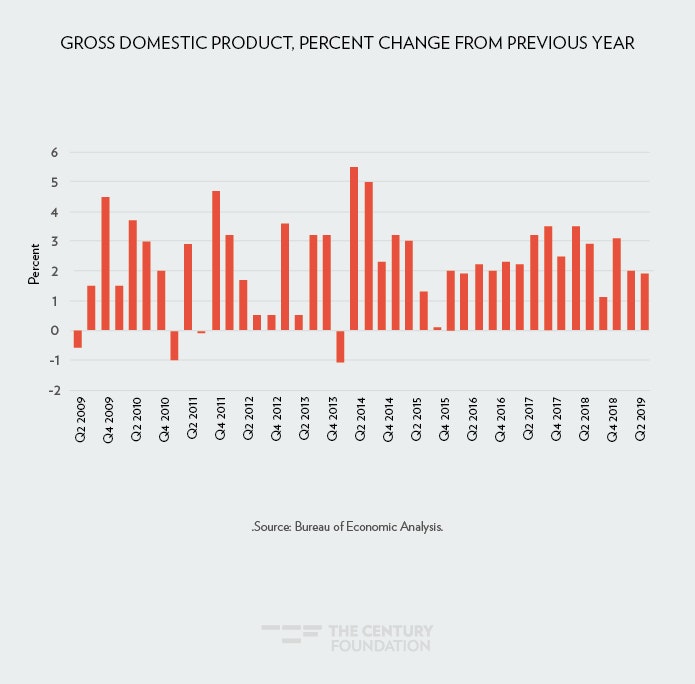
Slow Overall Growth Rate
The economy’s gross domestic product (GDP), a measure of total output, has been growing every quarter since it turned upward in the second quarter 2014, averaging a quarterly growth rate of about 2.5 percent since then. As Figure 11 shows, these rates are well in line with quarterly growth rates throughout the recovery. However, with the 2017 Tax Cuts and Jobs Act sparking pro-growth optimism, these recent figures, especially in the fourth quarter of 2018 and the second quarter of 2019, have been disappointing. Furthermore, they are worrisome when seen as part of a global trend toward stagnation.11 The data analyses that follow, including of productivity, capacity utilization, and investment, will illustrate a few of the prime suspects that help explain this moderate GDP growth.
Figure 11
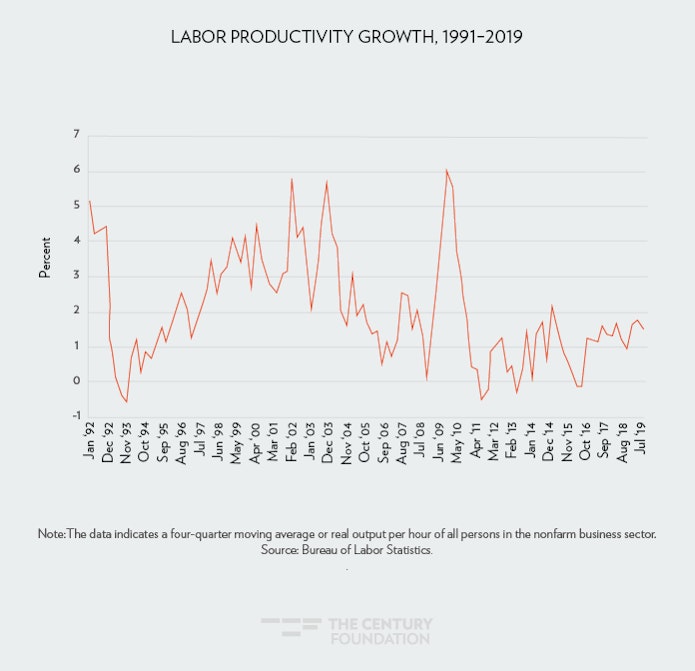
Productivity
Productivity, or the amount of output produced by a worker per hour of work, is an essential measure of economic health because its growth expands potential for consumer demand and workers’ incomes. As workers produce more goods at a more efficient pace, goods become cheaper for consumers. At the same time, businesses make more revenue as demand for cheaper goods increases, increasing output, hiring, and incomes in the economy overall. The more productivity gains in an economy, the more income is generated. Some of this income can theoretically go to pay raises. For example, at around 1.5 percent productivity growth and 2 percent inflation, workers can see a maximum pay increase of 3.5 percent year over year without increasing the current labor share of income in the economy. The late 1990s was a recent period wherein sustained productivity growth contributed to higher pay increases for employees (see Figure 1 above). In that period, productivity was growing at a pace of 2.5 to 4 percent annually, leading to sustained wage growth of up to 5 percent a year (see Figure 12). Productivity was also increasing at a pace of 2 to 7 percent in the early 1960s, and 3 to 6 percent in the early 1970s. Contrast these periods with the current expansion, where productivity only surpassed the 2 percent threshold once in the mid 2010s and wage growth for all employees has not surpassed 3.9 percent year over year, and there’s cause for concern.
Figure 12
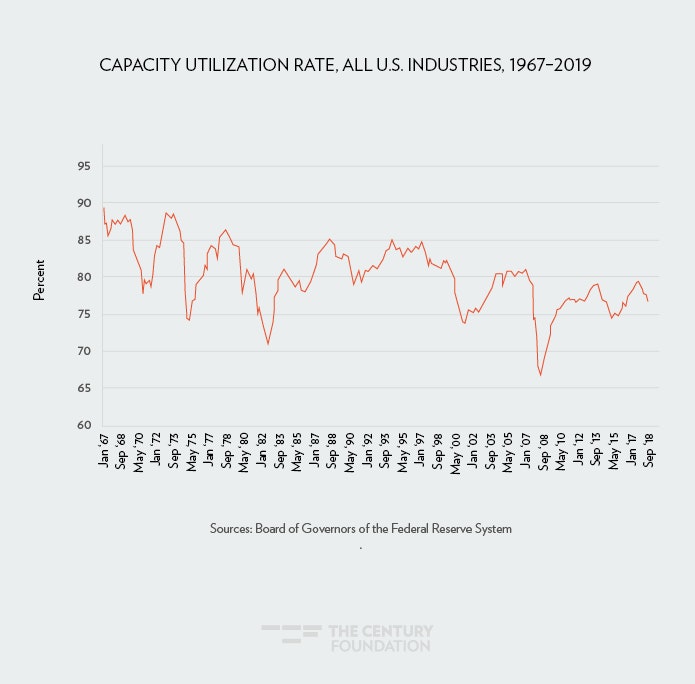
Capacity Utilization
The capacity utilization rate for all industries in the United States has been on a secular (long-term, and non-cyclical) decline since the late 1960s (see Figure 13). The rate can be seen as a measure of whether an economy is operating at its full potential. Roughly, the rate measures how much output is actually produced in an economy with existing equipment and machinery, as a share of the output that potentially could be produced if 100 percent of that equipment and machinery was fully utilized. Looking at the impact of the most recent recession, we see that the rate fell sharply in the late 2000s as the housing bubble deflated, banks went bust, investment and production slowed, unemployment soared, and demand for goods and services declined. The gap between actual output and potential output markedly increased, and despite ten years of recovery, the rate has not rebounded to the levels seen in the previous economic expansions of the late 1990s and 2000s. In fact, this is the first recovery on record wherein the capacity utilization rate has not cracked the 80 percent threshold. Rather than operating at full capacity, machinery is sitting idle, and fewer people are working. For all of the claims that manufacturing, in particular, was set to make a full recovery, Figure 13 shows that our factories are not being operated at their full potential, if at all.
Figure 13
Investment
Figures 14 and 15 demonstrate declining investment as a share of GDP in both the private and public sector. Capital investment of all firms as a share of total national income is not near the level seen prior to the last economic crisis, and is sitting at just 26 percent of GDP in the second quarter of 2019 (see Figure 14). More than a decade into the recovery, capital expenditures are so lackluster that they are nearly identical with the capital expenditures as a percentage ofGDP levels that bottomed out immediately after the recession in the early 1990s. An October report from the Bureau of Economic Analysis also notes that gross private domestic investment has declined for the second straight quarter. In particular, gross private domestic investment in structures (factories, office buildings, and the like) has declined 15.3 percent since last quarter, the largest decline since the fourth quarter of 2015.12
Capital investment in machines, office supplies, land, and the construction of buildings implies real investment in an economy, which can lead to job creation and increased incomes for workers. Those increased incomes can fund increased consumption, thereby increasing growth in an economy where workers reap the benefits of capital investments.
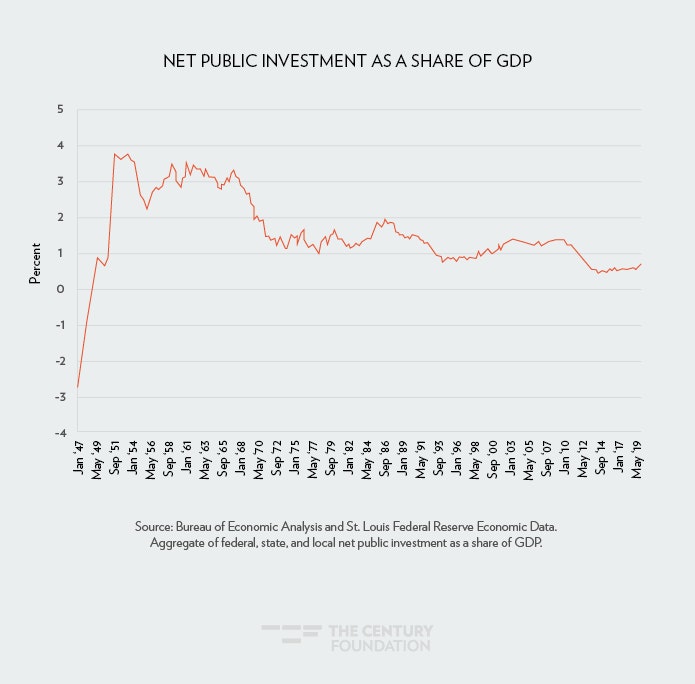
Net public investment has been on a secular decline as well, and has not recovered to the levels recorded prior to the economic crisis. As a share of GDP, it is at its lowest recorded level since the late 1940s, when there was a massive drawdown in public spending following World War II (see Figure 15). With pressing needs like crumbling infrastructure, climate change, an aging population, and weak economic growth, increased public investment would be beneficial to economic performance, innovation, and productivity.13 Yet a political aversion to the role of government investment and procurement has prevented this option from being explored in practice.
Figure 14
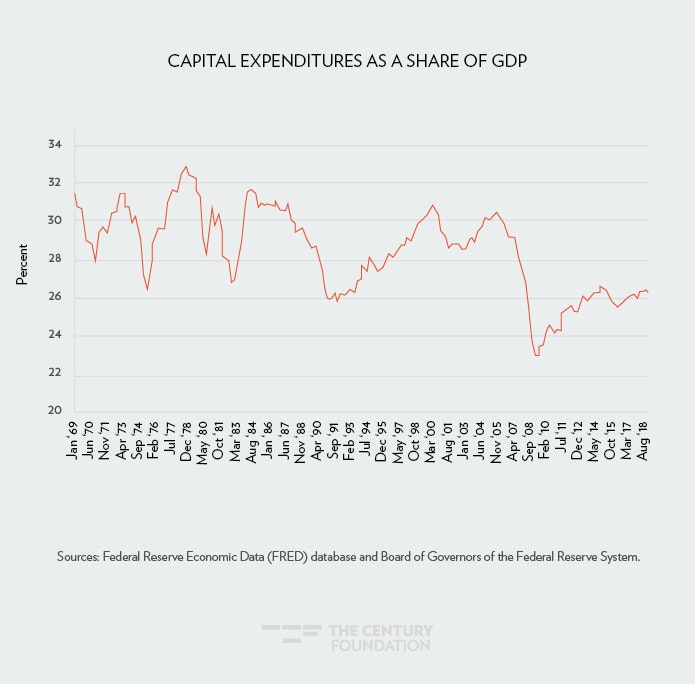
Figure 15
Conclusion
As the above figures demonstrate, the economy is not working for most Americans, and particularly for those in vulnerable populations. Indicators of macroeconomic performance, particularly investment and capacity utilization, point to an economy that is not operating at its full potential.
Sluggish growth and investment and tepid income gains will make for a hard landing for working people in the United States if the economy dips into recession. Pay has increased faster than it did in the early 2010s, but workers are still struggling to afford necessities. Debt and financial burdens persist, with working class households being twice as likely to be financially stressed than wealthier households.14 Wages have not increased at the rates seen in similar periods of expansion, suggesting that the economy is not at full employment and that workers are still struggling to obtain jobs and win pay raises.15
Global economic institutions like the International Monetary Fund are struggling to warn countries of pursuing economic policies that could further contribute to the worldwide economic slowdown of the past two quarters.16 And as countries in Europe, such as Germany, struggle to stave off a downturn, the United States is treading in uncertain waters with respect to recent uncertainties in repo markets17 and trade policies.18 Weak wage growth increases the risk of stagnation because of the key role of the U.S. consumer. In addition, there are worries that the economy has been held up by poorly targeted fiscal stimulus that may be wearing out.
Rather than the increased investment, the vast majority of tax savings that corporations pocketed was spent on stock repurchases—which, to the chagrin of tax cut enthusiasts, did not spur capital investment.
Policy choices, such as the Tax Cuts and Jobs Act of 2017, help to explain the underperformance of the economy and its slowdown. Rather than the increased investment, the vast majority of tax savings that corporations pocketed was spent on stock repurchases—which, to the chagrin of tax cut enthusiasts, did not spur capital investment. Instead, it inflated share prices and dividend payments without increasing investment in equipment or productive capacity, which are sorely needed to create jobs and higher incomes for workers.19 And by redistributing income to those who are less likely to spend new savings, tax cuts for the wealthy do not stimulate demand, as claimed by the 2017 bill’s proponents.20
As explained above, given that low inflation and low productivity growth limit the possible year-to-year wage growth American workers can expect, clawing back some national income from profits could be a means by which to get workers a raise. But that would require a shift in worker bargaining power, shifts which, in the current political climate, have only been borne through more direct confrontations, like the recent wave of strikes that have marked frustrations with poor pay and working conditions in education, manufacturing, and health care.
The main task facing progressives concerned about our economic present and future is to increase pay and the labor share of income while bringing more people into the labor market, especially those in marginalized communities. This task can be accomplished through bold pro-worker policies that lift pay and improve working conditions in general, and through policies that target more vulnerable workers and communities in particular. In combination with policies that build worker power and direct action, programs that reaffirm the role of public investment and government spending can be leveraged to raise the economy to its full productive potential to meet the challenges of everything from climate change to crumbling infrastructure. Only then can we begin to remedy the thirty-five-plus years of wage stagnation and worker disempowerment while promoting sustainable growth.
Notes
- Heather Long, “The average American family will get $4,000 from tax cuts, Trump team claims,” Washington Post, October 16, 2017, https://www.washingtonpost.com/news/wonk/wp/2017/10/16/the-average-american-family-will-get-4000-from-tax-cuts-trump-team-claims/.
- Amanda Novello and Jeff Madrick, “11 Ways America Workers are Falling Behind the Rest of the World,” The Century Foundation, September 7, 2018, https://tcf.org/content/commentary/11-ways-american-workers-are-falling-behind-the-rest-of-the-world/.
- Michael McCormack and Jeff Madrick, “We Can Have a High-Wage America,” Challenge Magazine, February 23, 2018, https://www.tandfonline.com/doi/full/10.1080/05775132.2018.1423667.
- Jessica Semega, Melissa Kollar, John Creamer, and Abinash Mohanty, “Income and Poverty in the United States: 2018,” United States Census Bureau, September 10, 2019, https://www.census.gov/library/publications/2019/demo/p60-266.html.
- Liana Fox, “What is the Supplemental Poverty Measure and How Does it Differ from the Official Measure?,” United States Census Bureau, September, 06, 2018, https://www.census.gov/newsroom/blogs/random-samplings/2018/09/what_is_the_suppleme.html.
- James E. Foster, “Absolute Versus Relative Poverty,” American Economic Review, volume 88, number 2, 1998, https://www.jstor.org/stable/pdf/116944.pdf?casa_token=XJdS75SYU08AAAAA:aYXBn5PlOYUGR3ndf084C19oWUsKE3-uPc_ogy6JS3mAqjrTvXMV0AgZfDnI_j6EPlZPZcYY2AIjLqNcTYeLbfZFfLLuSJzF7ko7t-arM1d-oAqSh8u5.
- Francisco Rodriguez and Arjun Jayadev, “The Declining Labor Share of Income,” Journal of Globalization and Development, March 27, 2013, https://www.degruyter.com/view/j/jgd.2012.3.issue-2/jgd-2012-0028/jgd-2012-0028.xml.
- Jessica Semega, Melissa Kollar, John Creamer, and Abinash Mohanty, “Income and Poverty in the United States: 2018,” United States Census Bureau, September 10, 2019, https://www.census.gov/library/publications/2019/demo/p60-266.html.
- World Inequality Database, https://wid.world/data/.
- Joshua D. Angrist, Oscar Jorda, and Guido M. Kuersteiner, “Semiparametric Estimates of Monetary Policy Effects: String Theory Revisited,” Journal of Business & Economic Statistics, May 10, 2017, https://amstat.tandfonline.com/doi/abs/10.1080/07350015.2016.1204919#.XalXD-dKgWr; Josh Bivens, “Focus on the boom, not the slump—The Fed’s new policy framework needs to stop cutting recoveries short,” Economic Policy Institute, June 18, 2019, https://www.epi.org/blog/focus-on-the-boom-not-the-slump-the-feds-new-policy-framework-needs-to-stop-cutting-recoveries-short-epi-macroeconomics-newsletter/.
- Andrew Stettner and Amanda Novello, “Faltering Factories May Presage a Faltering Economy,” The Century Foundation, July 8, 2019, https://tcf.org/content/commentary/faltering-factories-may-presage-faltering-economy/.
- “Gross Domestic Product, Third Quarter 2019 (Advance Estimate),” Bureau of Economic Analysis, October 30, 2019, https://www.bea.gov/system/files/2019-10/gdp3q19_adv_0.pdf.
- A. Michael Spence, “Why the world needs public investment,” World Economic Forum, February 20, 2015, https://www.weforum.org/agenda/2015/02/why-the-world-needs-public-investment/.
- Michael J McCormack, “Financial markets and the working class in the USA: an empirical investigation of financial stress,” Cambridge Journal of Economics, July 9, 2019, https://academic.oup.com/cje/article/43/4/867/5530260.
- Patricia Cohen, “Lots of Job Hunting but No Job Despite Low Unemployment,” New York Times, October 31, 2019, https://www.nytimes.com/2019/10/31/business/economy/long-term-unemployed.html.
- Larry Elliott, “Nations must unite to halt global economic slowdown, says new IMF head,” The Guardian, October 8, 2019, https://www.theguardian.com/business/2019/oct/08/nations-must-unite-halt-global-economic-slowdown-new-imf-head-kristalina-georgieva.
- “Statement Regarding Repurchase Operations,” Federal Reserve Bank of New York, October 23, 2019, https://www.newyorkfed.org/markets/opolicy/operating_policy_191023.
- Micah Maidenberg, “Fed Adds $87.8 Billion to Financial System in Latest Repo Transactions,” Wall Street Journal, October 15, 2019, https://www.wsj.com/articles/fed-adds-87-7-billion-to-financial-system-in-latest-repo-transactions-11571145580.
- William Lazonick, “Profits Without Prosperity,” Harvard Business Review, September 2014, https://hbr.org/2014/09/profits-without-prosperity.
- Thomas Palley, “Inequality and Stagnation by Policy Design: Mainstream Denialism and Its Dangerous Political Consequences,” Challenge, May 9, 2019, https://doi.org/10.1080/05775132.2019.1592843.