The Great Recession has had an immense toll on the ability of Americans to feed themselves. Today, 14.0 percent of American households—about one in seven—suffer from food insecurity, which means they do not have the resources to provide enough food for an active, healthy life for all household members.1 The level of food insecurity is now significantly higher than it was before the recession—11.1 percent of U.S. households in 2007—which means that the nation’s economic recovery has done little to reverse the recent surge in hunger. In fact, during the recovery, the portion of Americans facing food insecurity has only fallen by 0.4 percentage points since its peak in 2011. In effect, the Great Recession has boosted the number of households facing food insecurity from 13.0 million in 2007 to 17.4 million in 2014—an astounding 33.4 percent increase.
America recognizes the need to improve its food security. The federal government currently operates fifteen domestic food and nutrition programs, including the Supplemental Nutrition Assistance Program (SNAP, formerly the Food Stamp Program); the national school lunch program; and the Special Supplemental Nutrition Program for Women, Infants, and Children (WIC).2 But these federal programs can only ameliorate hunger, not eliminate it, even in the best of economies, and were strained by the Great Recession and its aftermath. In 2014, over half of households utilizing SNAP were food insecure. Among households with children that had income less than 185 percent of the poverty line, of those that received free or reduced price lunches in the previous thirty days, 47.5 percent were food insecure, and of those families that received WIC, 41.1 percent were food insecure. These three programs—and the other twelve—help households improve their food insecurity, but one in seven Americans must also rely on food pantries and soup kitchens in their communities to supplement the food that they purchase.3
For decades, anti-hunger organizations have placed a high priority on minimum wage laws as a strategy to prevent food insecurity. The combined impact of increased purchasing power of low-wage working families and federal food nutrition programs (particularly for children) has the chance to reverse the growing levels of food insecurity in the United States. The recent growth in public support for increases in municipal, state, and federal minimum wages—particularly, increasing state minimum wages to $15.00 per hour—gives anti-hunger advocates the potential to use this powerful tool to reduce food insecurity. And in fact, California and New York—two of the nation’s largest states—have passed laws that will see their minimum wage eventually rise to $15.00 an hour, as have numerous smaller jurisdictions. And earlier this year, New Jersey Congressman Donald Norcross proposed to increase the federal minimum wage to $15.00 per hour.4
This report looks at the impact that raising the federal minimum wage would have on America’s food insecurity problem, using the Norcross plan as a model. Under this plan, the federal minimum wage would rise to $8.00 in 2016, and then increase a $1 per year, until it reached $15.00 per hour in 2023. (The proposal extends Congressman Bobby Scott and Washington State Senator Patty Murray’s proposal to increase the federal minimum wage to $12.00 per hour by 2020.)5
Figure 1. The Percentage of Households that are FOOD Insecure by State
Using a rigorously developed economic model (exploiting significant variation between state and federal minimum wages), this report seeks to answer the following questions:
- What is the policy context and why should we care about the link between an increase in the minimum wage and food security?
- How does an increase in the minimum wage improve food security?
- What is the impact of a 10 percent increase in the minimum wage on food security?
- What would be the impact of an increase in the federal minimum wage from $7.25 to $15.00 per hour?
The study’s key findings are:
- An increase in the minimum wage significantly improves food security, with larger increases for nonwhite, high school graduate, and single-parent households.
- The improvement in food security is more the result of lifting up households that face intermittent but significant food insecurity (known as low food security), than of raising those up who face consistent and severe deprivation (known as very low food security). In other words, raising the minimum wage is a policy that can make a major impact on hunger among families who are not jobless, but who still face too large of a budgetary squeeze to afford enough food, each and every week.
- An increase in the minimum wage enables households to worry less about meeting their food needs, to maintain a supply of food, to reduce their reliance on low-cost food, and to afford more balanced meals.
- Because adults are more likely to make sacrifices to their food intake and dietary choices in order to provide for their children, raising the minimum wage has a greater impact on food insecurity among adults than among their children.
- Increasing the federal minimum wage to $15.00 per hour by 2023 would make a major impact on food insecurity across the nation.
- Almost 1.2 million households would achieve food security.6 This represents a 6.5 percent decline in food insecurity.
- Just over 500,000 African-American and Latino households would see their food security improve. (These minority households comprise 44 percent of the 1.2 million households newly achieving food security, yet only 25 percent of all households.)
- One-third (about 349,000) of the impacted households is comprised of single-parent households, and the increase to $15 per hour most dramatically reduces food security among this group.
- Just under 1.0 million urban households will experience an increase in their food security.
- Approximately, 430,000 southern households will become food secure. They constitute 37 percent of the 1.2 million households that will now achieve food security.
- Benefits are not only distributed to households solely at or below poverty. Just over 652,000 households have incomes that exceed 185 percent of the poverty line, and they comprise 56 percent of the beneficiaries.
- The states with the largest number of beneficiary households are California (89,000), Texas (86,000), Florida (64,000), New York (52,000), Pennsylvania (49,000), Illinois (39,000), Georgia (36,000), Ohio (43,000), North Carolina (35,000), Michigan (31,000), and Virginia (31,000).
- The increase in the minimum wage will reduce U.S. food insecurity by 6.5 percent. Six states will experience a decline in food insecurity rates over 8.0 percent: Iowa (8.4), North Dakota (11.4), New Hampshire (9.5), Pennsylvania (8.5), Virginia (9.7), and Wisconsin (8.5).
Defining Food Security
The U.S. Department of Agriculture defines a household’s food security status as a continuum that moves from insecurity to security.7 They use the Current Population Survey’s Food Security supplement to estimate where a household is located on the continuum. Households are identified as insecure or secure, based on their responses to eighteen questions that explicitly ask each household to report only those behaviors that result from financial resource constraints. Based on the recommendations of a National Academy of Sciences study panel, households in the 2000 to 2011 surveys are classified as “very low” food security, “low” food security, or “food secure.”8
Food secure households are able to meet their nutritional needs on a regular basis. They only sometimes (or never) have problems or anxiety about consistently accessing adequate food. Their food intake’s quality, variety, and quantity are not significantly compromised. Low food security households have reduced the quality, variety, and desirability of their diets, yet the quantity of food intake and normal eating patterns were not substantially disrupted. Very low food security households have, at times during the year, seen the eating patterns of one or more household members disrupted and food intake reduced because the household lacked money and other resources for food.
To be placed in one of these three categories, households are asked a series of questions about their behaviors and experiences associated with the difficulty in meeting their food needs. The questions cover a wide spectrum of severity of food insecurity. An example of a question that captures the least severe experience includes asking whether the following statements were often, sometimes or never true:
“We worried whether our food would run out before we got money to buy more.”
“We couldn’t afford to eat balanced meals.”
A midrange severity question is:
“In the last twelve months, did you ever cut the size of your meals or skip meals because there wasn’t enough money for food?”
Two examples of questions that capture the most severe challenges are:
“In the last twelve months, did you ever not eat for a whole day because there wasn’t enough money for food?”, or
“In the last twelve months, did any of the children ever not eat for a whole day because there wasn’t enough money for food?”
All questions ask households to answer the question based on their experiences over the last twelve months. A key feature of each question is that it asks households to confirm that a lack of resources is the reason for the behavior or experience. Income from work is a prime example of a resource. This focus on financial resources adds further legitimacy for exploring the link between minimum wage policy and food insecurity.
A household is designated as “food insecure” if they report three or more conditions that indicate food insecurity. Specifically, this means that during the previous twelve months, they were unable to acquire adequate food for one or more household members because they had insufficient money and other resources for food. Households are also classified as food insecure if they report any combination of three or more conditions, including any more severe conditions.
The three least severe conditions that would result in a household being classified as food insecure are:
- They worried whether their food would run out before they got money to buy more.
- The food they bought didn’t last, and they didn’t have money to get more.
- They couldn’t afford to eat balanced meals.
A household is categorized as having very low food security to the extent that eating patterns of one or more household members were disrupted and their food intake reduced, at least some time during the year, because they could not afford enough food. To be classified as having very low food security, households with no children present must report at least the three conditions listed above, and also that:
- Adults ate less than they felt they should, and
- Adults cut the size of meals or skipped meals and did so in three or more months.
Under this designation, many households will report additional, more severe experiences and behaviors as well. If there are children in the household, their experiences and behaviors are also assessed. In households with children, an additional two “yes” responses are needed for a designation of very low food security.
Who Is Food Insecure?
In 2014, the U.S. Department of Agriculture estimated that 14 percent of U.S. households were classified as food insecure, and just over 19.2 percent of all households with children were food insecure (see Table 1). The latter estimate rises slightly, to 19.9 percent, when the focus is on households with children under age six. Single-parent households headed by a woman or a single man have above-average rates of insecurity (35.3 and 21.7 percent, respectively). One in four households with a non-Latino black head were food insecure, as were one in five Latino households (22.4 percent).9
| Table 1. Households, by Food Security Status and Selected Household Characteristics, 2014 | ||||||||||
| Insecure | ||||||||||
| With low food security | With very low food security | |||||||||
| Category | Total | Food secure | All | |||||||
|
1,000s |
1,000s | Percent | 1,000s | Percent | 1,000s | Percent | 1,000s | Percent | Percent with low food security | |
| All households | 124,044 | 106,618 | 86 | 17,426 | 14 | 10,488 | 8.4 | 6,938 | 5.6 | 60.2% |
| Household composition: | ||||||||||
| With children < 18 years | 39,079 | 31,590 | 80.8 | 7,489 | 19.2 | 5,147 | 13.2 | 2,342 | 6 | 68.7% |
| With children < 6 years | 17,211 | 13,786 | 80.1 | 3,425 | 19.9 | 2,457 | 14.3 | 968 | 5.6 | 71.7% |
| Married-couple families | 25,376 | 22,226 | 87.6 | 3,150 | 12.4 | 2,346 | 9.2 | 804 | 3.2 | 74.5% |
| Female head, no spouse | 9,912 | 6,411 | 64.7 | 3,501 | 35.3 | 2,230 | 22.5 | 1,271 | 12.8 | 63.7% |
| Male head, no spouse | 3,237 | 2,533 | 78.3 | 704 | 21.7 | 476 | 14.7 | 228 | 7 | 67.6% |
| Other household with child | 554 | 419 | 75.6 | 135 | 24.4 | 96 | 17.3 | 39 | 7 | 71.1% |
| With no children < 18 years | 84,965 | 75,029 | 88.3 | 9,936 | 11.7 | 5,340 | 6.3 | 4,596 | 5.4 | 53.7% |
| More than one adult | 50,621 | 45,731 | 90.3 | 4,890 | 9.7 | 2,772 | 5.5 | 2,118 | 4.2 | 56.7% |
| Women living alone | 19,062 | 16,149 | 84.7 | 2,913 | 15.3 | 1,541 | 8.1 | 1,372 | 7.2 | 52.9% |
| Men living alone | 15,283 | 13,150 | 86 | 2,133 | 14 | 1,027 | 6.7 | 1,106 | 7.2 | 48.1% |
| With elderly | 34,269 | 31,230 | 91.1 | 3,039 | 8.9 | 1,941 | 5.7 | 1,098 | 3.2 | 63.9% |
| Elderly living alone | 12,792 | 11,608 | 90.7 | 1,184 | 9.3 | 704 | 5.5 | 480 | 3.8 | 59.5% |
| Race/ethnicity of households: | ||||||||||
| White, non-Hispanic | 84,127 | 75,335 | 89.5 | 8,792 | 10.5 | 4,966 | 5.9 | 3,826 | 4.5 | 56.5% |
| Black, non-Hispanic | 15,424 | 11,393 | 73.9 | 4,031 | 26.1 | 2,434 | 15.8 | 1,597 | 10.4 | 60.4% |
| Hispanic | 16,148 | 12,527 | 77.6 | 3,621 | 22.4 | 2,502 | 15.5 | 1,119 | 6.9 | 69.1% |
| Other, non-Hispanic | 8,346 | 7,365 | 88.2 | 981 | 11.8 | 585 | 7 | 396 | 4.7 | 59.6% |
| Household income-to-poverty ratio: | ||||||||||
| Under 1.00 | 15,812 | 9,560 | 60.5 | 6,252 | 39.5 | 3,409 | 21.6 | 2,843 | 18 | 54.5% |
| Under 1.30 | 20,783 | 13,009 | 62.6 | 7,774 | 37.4 | 4,290 | 20.6 | 3,484 | 16.8 | 55.2% |
| Under 1.85 | 31,376 | 20,790 | 66.3 | 10,586 | 33.7 | 6,030 | 19.2 | 4,556 | 14.5 | 57.0% |
| 1.85 and over | 64,200 | 60,153 | 93.7 | 4,047 | 6.3 | 2,683 | 4.2 | 1,364 | 2.1 | 66.3% |
| Income unknown | 28,468 | 25,676 | 90.2 | 2,792 | 9.8 | 1,775 | 6.2 | 1,017 | 3.6 | 63.6% |
| Area of residence: | ||||||||||
| Inside metropolitan area | 104,931 | 90,781 | 86.5 | 14,150 | 13.5 | 8,601 | 8.2 | 5,549 | 5.3 | 60.8% |
| In principal cities | 35,672 | 30,085 | 84.3 | 5,587 | 15.7 | 3,476 | 9.7 | 2,111 | 5.9 | 62.2% |
| Not in principal cities | 51,892 | 45,779 | 88.2 | 6,113 | 11.8 | 3,600 | 6.9 | 2,513 | 4.8 | 58.9% |
| Outside metropolitan area | 19,114 | 15,839 | 82.9 | 3,275 | 17.1 | 1,886 | 9.9 | 1,389 | 7.3 | 57.6% |
| Census geographic region: | ||||||||||
| Northeast | 22,156 | 19,209 | 86.7 | 2,947 | 13.3 | 1,789 | 8.1 | 1,158 | 5.2 | 60.7% |
| Midwest | 27,260 | 23,489 | 86.2 | 3,771 | 13.8 | 2,180 | 8 | 1,591 | 5.8 | 57.8% |
| South | 46,869 | 39,803 | 84.9 | 7,066 | 15.1 | 4,235 | 9 | 2,831 | 6 | 59.9% |
| West | 27,760 | 24,119 | 86.9 | 3,641 | 13.1 | 2,284 | 8.2 | 1,357 | 4.9 | 62.7% |
| Source: Alisha Coleman-Jensen, Matthew P. Rabbitt, Christian Gregory, Anita Singh, “Household Food Security in the United States in 2014,” United States Department of Agriculture, September 2015, http://www.ers.usda.gov/ |
||||||||||
About 60 percent of the 17.4 million food insecure households have low food security (the other 40 percent have very low food security). Within household structure, the table reveals that two-thirds to three-quarters of insecure households with children have low food security. It is important to note that a larger share of households without children have very low food security. Only 48.2 percent of food insecure men that live alone have low food security (the other 51.9 percent have very low security). A slightly lower share of white households compared to non-white households has low security. As one would expect, food insecure households below 185 percent of the poverty line have smaller portions that have low security. More tend to have very low security. Finally, the percentages of insecure households by metropolitan area and region of residence indicate that most insecure households have low security (ranging from 57.6 percent to 62.7 percent). These households would be the chief beneficiaries of an increase in the minimum wage,10 as their employment and food security outcomes are the most responsive to an increase in the minimum wage.
With respect to the four census regions, the incidence of food insecurity is higher in the South (15.1 percent) than in the Northeast (13.3 percent), Midwest (13.8 percent), or the West (13.1 percent).
Across America, a significant portion of most households’ annual income comes from wages and salaries. For example, for households with less than $10,000, 31.5 percent to 34.2 percent of income is in the form of wages and salary.11 Wages and salary comprised 27.8 percent of a household’s income in the $10,000 to $14,999 range. Between $15,000 and $19,999, wages and salary comprise 35.6 percent of income. From the ranges of $20,000 to $29,999, $30,000 to $39,999, and $40,000 to $49,999, wages and salary constitute 51.1 percent, 61.6 percent, and 72.8 percent of income, respectively.
Even at the lowest segment of the income scale (less than $10,000), the share from earnings exceeds the share made up of public assistance, supplemental security, income, and food stamps. At less than $5,000, the shares are 38.1 versus 31.5 percent. At the $5,000 to $9,999 range, the shares are 34.2 versus 20.7 percent. Above $10,000 the percent of income derived from public assistance falls to less than 10 percent of income. The point being made here is that low-to-moderate income households work, meaning that an increase in the minimum wage will provide additional resources for households that have the greatest need.
The Policy Context and Dynamics
There are several reasons why minimum wage policy can serve as a useful tool for helping households with low-wage workers achieve food security. First, there are broad concerns about U.S. hunger, particularly on the impact that hunger has on child development and the capacity to learn. Food pantries have gone from an emergency service used by a small portion of the population to a fixture of communities. In 2014, 54 percent of Americans using a food pantry were from working families.12 During the Great Recession and the following recovery, nonprofits that operate food pantries and other local-based safety nets not only experienced an increase in the demand for their services, but also new clients, many of which had never utilized social services during their lifetimes.
Second, federal sequestration, state and local fiscal “tightening” measures, and several decades of stagnating income have made it difficult for families to achieve financial stability. Shifting the minimum wage debate’s focus to food security provides advocates with a concrete rationale for increasing the minimum wage. It provides simple, yet very tangible outcome for policy makers and the public to observe. Minimum wage policy helps anti-hunger advocates to address their concerns that, in the current fiscal climate, low-wage workers are unable to receive adequate public support to meet basic necessities.
Food insecurity is most frequently experienced among low-income families, who have complicated, tight household budgets.
Against this backdrop, raising the minimum wage can have a large impact. Food insecurity is most frequently experienced among low-income families, who have complicated, tight household budgets. Food is the most vital of all expenditures, compromising 13.7 to 15.3 percent of average annual expenditures in families with income below $40,000.13 When budgets are tight and families can barely afford housing and utilities, they cut costs in the one flexible area of their budget: food. Research on such “food tradeoffs” is extensive. One study found that a 10 percent drop in temperatures (and concurrent increase in utility costs) leads to a 9 percent drop in food consumption among low-income families, as compared to an 11 percent increase for higher-income families.14 Not surprisingly, low-income families who access subsidized housing and energy assistance are less likely to report child nutrition problems than similarly situated families, because they can spend their limited resources on food.15 For low-income families, gains in earnings have a similar effect and allow for normalized consumption of food at no cost to government.
An increase in the minimum wage adds slack to the household’s budget, providing more resources and thus greater ability to purchase food (and other goods) and to avoid food tradeoffs. The specific amounts spent on food depend on the household’s preferences and budget constraints that make impacting food insecurity challenging. Economists have had difficulty establishing whether food stamp benefits reduce food insecurity—some food stamp households still do not have enough to make ends meet shift cash previously spent on food to other expenses, and thus end up still being food insecure, even after receiving food stamps.16 Moving families to food security requires sufficient resources to cover a budget of basic needs that allows them the sufficient liquid resources to spend enough on food each month.
Measuring How a Minimum Wage Increase Improves Food Security
This report combines data from the CPS Food Supplement with data on state minimum wages to investigate the impact of minimum wage increases on food security. Pooling the micro-data files from 1995 to 2014, this report models the impact of previous minimum wage on food insecurity, and uses those models to estimate what future increases in the minimum wage might bring, using an increasingly popular statistical framework called Regression Discontinuity (which can isolate the impact of small increases in the minimum wage on people with similar characteristics). Instead of using geographic boundaries, this report compares workers in states where the federal minimum wage is binding, to workers in states with minimum wages that are “close” or “near” the current federal minimum wage—thus ruling out the possibility that it is measuring the impacts of other factors (such as the cost of living) on food security.
Over the study period from 1996 to 2014, annually, on average, eighteen states have minimum wages that exceed the federal, from a low of seven states in 1998 and 1999 to a high of thirty-three states in 2008. To illustrate the discontinuity, Table 2 reports the earnings distribution for 2010 to 2014 below $16.00 per hour. During that period the federal minimum wage was set at $7.25 per hour. Over that period, the number of states with minimum wages that exceeded the federal minimum wage of $7.25 per hour increased from fifteen in 2010, to twenty-four states in 2014. The columns in Table 2 report the hourly wage distributions in states where the federal minimum wage is the binding minimum wage and in states where the state minimum wage exceeds the federal minimum. The years from 2010 to 2014 are used because they correspond to when the federal minimum wage was always $7.25 per hour. For the study’s sample—which is based on employed individuals that are 18 to 64 years of age, do not utilize food stamps, and have complete information for the variables of household structure, race and ethnicity, age, gender, educational attainment, household size, and urban residency status—a discontinuity exist at $7.25 per hour.
| Table 2. Illustration of Discontinuity at $7.25 Per Hour (Hourly Wage Distributions for 2010 to 2014) | ||
| Range of State Minimum Wage | States at the Federal Minimum Wage | States Above the Federal Minimum Wage |
| Less than $4.25 | 0.6% | 0.5% |
| $4.25 | 0.0% | 0.0% |
| $4.26 to 4.74 | 0.1% | 0.1% |
| $4.75 | 0.0% | 0.0% |
| $4.76 to 5.14 | 0.2% | 0.1% |
| $5.15 | 0.1% | 0.1% |
| $5.16 to 5.84 | 0.0% | 0.0% |
| $5.85 to 6.54 | 0.4% | 0.3% |
| $6.55 | 0.0% | 0.0% |
| $6.56 to 7.24 | 1.0% | 0.8% |
| $7.25 | 3.2% | 0.7% |
| $7.26 to 7.99 | 5.2% | 3.6% |
| $8.00 | 6.0% | 6.2% |
| $8.01 to 8.99 | 6.7% | 8.0% |
| $9.00 | 5.6% | 6.4% |
| $9.01 to 9.99 | 5.9% | 6.1% |
| $10.00 | 9.3% | 10.7% |
| $10.01 to 10.99 | 6.0% | 5.9% |
| $11.00 | 4.1% | 3.8% |
| $11.01 to 11.99 | 4.9% | 4.8% |
| $12.00 | 6.2% | 7.0% |
| $12.01 to 12.99 | 5.7% | 5.9% |
| $13.00 | 3.5% | 3.9% |
| $13.01 to 13.99 | 5.7% | 4.8% |
| $14.00 | 4.0% | 4.0% |
| $14.01 to 14.99 | 4.6% | 4.3% |
| $15.00 | 6.6% | 7.7% |
| $15.01 to 15.99 | 4.4% | 4.3% |
| Total | 100.0% | 100.0% |
| Notes: The first column shows the hourly wage distribution in states where the federal minimum wage is the binding minimum wage. The second column shows the hourly wage distribution in states where the state minimum wage exceeds the federal minimum. The distributions are for 2010 to 2014, when the federal minimum wage was always $7.25 per hour. The samples consist of individuals that are 18 to 64 years of age, do not utilize food stamps, and have complete information for the following variables: household structure, race and ethnicity, age, gender, educational attainment, household size, and urban residency status. | ||
In states where the federal minimum wage is binding, 3.25 percent of workers with wages less than $16.00 per hour report earning $7.25. Just over 5.0 percent (5.2) earn between $7.26 and $7.99 per hour. In states where the state minimum wage exceeds the federal, 0.7 percent of workers earned $7.25 per hour. This jumps to 3.6 percent in the $7.26 and $7.99 per hour interval. Table 3 shows that the food insecurity drops when moving from $7.25 to the $7.26 and $7.99 per hour interval. The table reveals that the basic characteristics of the individuals across the discontinuity are quite similar. The share of women and minorities does not change. The educational distribution changes very little. Household composition also changes very little. The only differences are in urban residence and the state unemployment rate. States with higher minimum wages tend to have more urban residents and higher jobless rates. However, the take away here is that at the discontinuity, food security jumps, and is probably not due to a change in the characteristics of individuals in these states. The regression analysis will control for these differences.
| Table 3. Comparison of the Characteristics of Workers at the $7.25 per hour Discontinuity (2010 to 2014) | ||
| Minimum Wage | ||
| Variable | $7.25 | $7.26 to $7.99 |
| Food security | 76.5% | 84.9% |
| Low security | 14.1% | 11.1% |
| Very low security | 9.3% | 4.0% |
| Female | 63.0% | 62.2% |
| Latino | 17.4% | 20.0% |
| Black | 10.9% | 9.3% |
| Asian | 3.2% | 3.1% |
| Age | 31.51 | 31.57 |
| HS dropout | 20.6% | 16.9% |
| HS graduate | 70.4% | 68.4% |
| AA degree | 4.2% | 6.7% |
| Single father | 9.0% | 7.1% |
| Single mother | 17.7% | 16.4% |
| Individual male | 6.4% | 11.6% |
| Individual female | 8.7% | 12.9% |
| Number in household | 3.50 | 3.25 |
| Urban resident | 67.8% | 83.6% |
| State unemployment rate | 7.14 | 8.22 |
| Sample size | 311 | 225 |
| Note: The columns show the characteristics of hourly wage worker in states where the federal minimum wage is the binding minimum wage and in states where the state minimum wage exceeds the federal minimum. The years from 2010 to 2014 are used because they correspond to when the federal minimum wage was always $7.25 per hour. The samples consist of individuals that are 18 to 64 years of age, do not utilize food stamps, and have complete information for the following variables: household structure, race and ethnicity, age, gender, educational attainment, household size, and urban residency status. | ||
The report takes a finer-grained look at the impact of minimum wage increases on food security than previous studies, seeing how much minimum wage increases move households up the food security continuum, from very low food security to low food security, or from low food security to food secure. The report also estimates relationships for each of the questions that are used to build the food security index. For example, the first question asks respondents whether they “worried food would run out before we got money to buy more.” The question clearly captures the impact that having greater financial resources, such as higher wages via an increase in the minimum wage, could improve a household’s well-being.
Evidence from Shifts in the Food Security Distribution
The report’s estimates of employment and food security changes associated with a 10 percent increase in the minimum wage are promising (see Table 4).17 The regression discontinuity employment estimates confirm many of the results of many other studies; namely, that increases in the minimum wage from 1995 to 2014 did not yield adverse employment effects. Furthermore, nonwhite, less educated, and single parents experienced an improvement in their employment prospects. These demographic groups are the ones that would receive the greatest benefits from an increase in the minimum wage. The estimates are useful for the “minimum wage job loss” debate, because they come from a new data set and econometric approach, adding further support that modest increases do not reduce employment.
| Table 4. Estimates of the Impact of a 10 Percent Increase in the Minimum Wage | ||||
| Outcomes | All | Nonwhite | Less-Educated | Single Parents |
| Employment | 0.3343a | 0.2778a | 0.4053a | 0.3462a |
| Food secure | 0.1873a | 0.3741a | 0.2088a | 0.5251a |
| Low security | -0.1236a | -0.2389a | -0.1302a | -0.3109a |
| Very low security | -0.0637a | -0.1352a | -0.0786a | -0.2142a |
| Notes: Entries are estimates from regression discontinuity models Author’s calculations from the 1996 to 2014CPS Food Supplements. The samples consist of individuals that are 18 to 64 years of age, do not utilize food stamps, and have complete information for the following variables: household structure, race and ethnicity, age, gender, educational attainment, household size, and urban residency status. The excluded categories are non-household heads, men, whites, college graduates, dual households, and non-urban residence. The models also include year and state dummy variables. The reported RD model is a “Zero Order” ordered probit model of the outcome for each question on a constant, a dummy variable that equals 1 if the state’s minimum wage exceeds the federal minimum wage and 0 if the federal minimum wage is the binding wage, and the rating variable. All models control for the characteristics described above. The entries measure the percentage point difference in food security between states with minimum wages that exceed the federal and states where the federal is binding. An “a” denotes 1 percent level of significance. A “b” denotes 5 percent level of significance, and a “c” denotes the 10 percent level of significance. The significance levels correspond to 2.576 for 1 percent level, 1.960 for 5 percent, and 1.645 for 10 percent. | ||||
These food security results solve why previous studies found that there was little relationship between food security and the minimum wage. Our analysis indicates that this is because previous studies modeled food security as a binary outcome between insecurity and security, lumping both low and very low categories together. By breaking down the food security variable into a three point variable (very low, low security, and security), this report can measure smaller movements in food security.
The estimates reveal that a 10 percent increase in the minimum wage is associated with a 0.141 percentage point increase in food security. The impacts on the food security of nonwhite, less educated, and single parent households all exceed the overall estimate. Nonwhites and single parents are the greatest beneficiaries. The results concretely show that the improvement in food security via an increase in the minimum wage is driven mostly by a movement of households from low security to food secure. For each 10 percent increase in the minimum wage, low security falls by 0.094 percentage points, while very low security falls by 0.047 percentage points. For comparison purposes, refer to the summary statistics reported in Table 1. In all households, 8.4 percent have low food security and 5.6 percent have very low security. Thus, creating a ratio of the elasticity and the shares suggests that an increase in the minimum wage has a small impact on food insecurity. This remains even if the report’s insecurity shares of 6.1 and 2.7 percent are used. The policy simulations will demonstrate otherwise.
Still, the largest food security reduction occurs at the middle of the food security distribution. This is a critical finding. Individuals who are working have more financial resources, and have smaller gaps in their household budget. The results show that minimum wage increases can greatly reduce the plight of families who remain food insecure despite working significant hours. Thus, raising the minimum wage would allow the concentration of limited federal and local anti-hunger resources on those families at very low-levels of food security who are working fewer hours, if at all, and who are thus less likely to benefit from a minimum wage increase. Additional anti-poverty tools must be used in conjunction with increases in the minimum wage to significantly reduce poverty for all families.
Evidence from the Individual Food Security Questions
Another approach to illustrate the dynamics of an increase in the minimum wage is to analyze the responses to the individual questions that households were asked about their food situation over the past twelve months.18 This report focuses on the questions that have three outcomes: “never true,” “sometimes true,” and “often true.”19
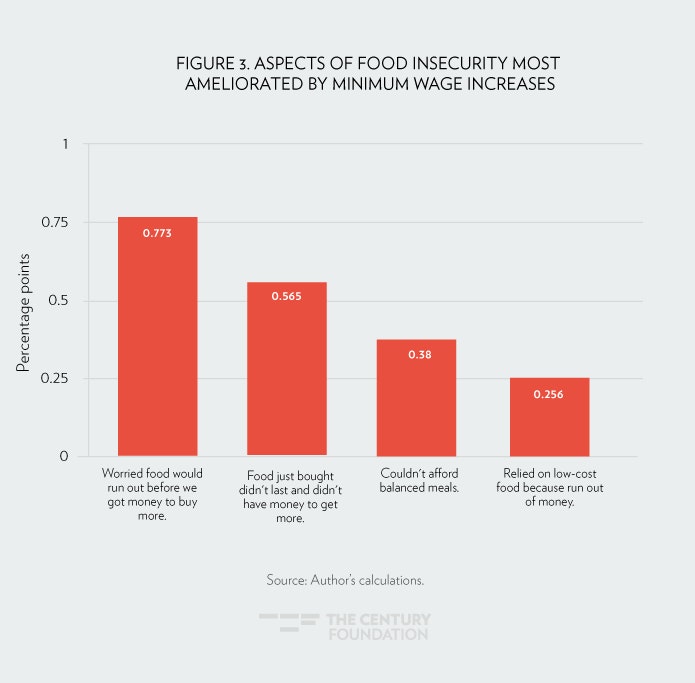
Table 5 presents the impacts of minimum wage increases on specific aspects of food insecurity. These findings are consistent with the earlier results; namely, that food security improves because more households move from low security to food secure. The model indicates that raising the minimum wage increases the chances that a low-income family will never run out of food, and will never have to worry about running out of food before they get more money (a frequent worry of families on food stamps). The model results indicate that a 10 percent increase in the minimum wage raises a household’s odds of never running out of food before they received more money by 0.773 of a percentage point. The elasticities for “sometimes true” and “often true” indicate that the reduction in never having to worry about food running out occurs because more households shift from reporting “sometimes true” to “never true.” The increase in the minimum wage provides a boost to households that just fall short of security. In fact, all of the questions that require a response of “never true,” “sometimes true,” or “often true” have the expected signs and are measured with a high level of precision.
Notes: Author’s calculations from the 1996 to 2014 CPS Food Supplements. The samples consist of individuals that are 18 to 64 years of age, do not utilize food stamps, and have complete information for the following variables: household structure, race and ethnicity, age, gender, educational attainment, household size, and urban residency status. The excluded categories are non-household heads, men, whites, college graduates, dual households, and non-urban residence. The models also include year and state dummy variables. The reported RD model is a “Zero Order” ordered probit model of the outcome for each question on a constant, a dummy variable that equals 1 if the state’s minimum wage exceeds the federal minimum wage and 0 if the federal minimum wage is the binding wage, and the rating variable. All models control for the characteristics described above. The entries measure the percentage point difference in food security between states with minimum wages that exceed the federal and states where the federal is binding. An “a” denotes 1 percent level of significance. A “b” denotes 5 percent level of significance, and a “c” denotes the 10 percent level of significance. The significance levels correspond to 2.576 for 1 percent level, 1.960 for 5 percent, and 1.645 for 10 percent. The term “(SN)” refers to a question that was used in Joseph J. Sabia and Robert Nielsen, “The Effect of Minimum Wages on Material Hardship: Evidence from the SIPP,” Review of Economics of the Household (2012).The most important finding is that less educated, nonwhite, and single-parent households experience a greater reduction in having to worry about running out of food before they receive more money, a greater reduction in the chance that their food runs out, and a larger reduction in not being able to afford balanced meals. They also do not have to rely as much on low-cost food because they run out of money. For example, for nonwhite, less educated, and single-parent households, a 10 percent increase in the minimum wage lowers the odds of running out of food by 0.856, 0.370, and 0.795 percentage points, respectively— all higher than the reduction for the typical household.
Although smaller in magnitude and not as precisely estimated, the seventh, eighth and ninth questions that are coded by month also confirm the hypothesis that an increase in the minimum wage improves food security. An increase reduces the number of months in which adults ever cut the size of their meals or skip them because there is not enough money for food. The same occurs for the question that deals with responses by children.
What else does the analysis reveal by focusing on the individual food security questions? An increase in the minimum wage has a greater impact on adults. The food security questions that are directed toward children have a weaker relationship with an increase in the minimum wage. This report interprets the difference as parents choosing to sacrifice their nutritional needs before they harm the food security of their children. In addition, children benefit from free school lunches and breakfasts, meaning that their food intake is less impacted by budget constraints. An increase in the minimum wage allows them to make fewer sacrifices to their diet and food intake.20
What a Federal Minimum Wage of $15.00 per Hour Would Do
To demonstrate that the estimated impacts improve household well-being, this report simulates the effects of New Jersey Congressman Norcross’ recent proposal to increase the federal minimum wage to $15.00 per hour.21 It is important to note that until the Norcross proposal, most national proposals have been to increase the federal minimum wage to $12.00 per hour. Specifically, Washington State Senator Patty Murray and Virginia Congressman Bobby Scott proposed to increase the federal minimum wage from its current $7.25 per hour to $12.00 per hour by 2020. Before presenting the simulations, this report summarizes the public conversation that has emerged around increasing the federal minimum wage to $15.00 per hour.
The Fight for $15 movement22 is driving efforts to increase the minimum wage to $15.00 per hour. This grassroots effort calls for local and state governments to increase the minimum wage to $15.00 per hour for all workers, but especially fast food and retail workers. To date, most increases of this size have covered city and county (for example, Los Angeles, Chicago, San Francisco, and Seattle) jurisdictions.23 More than twelve have passed phased-in $15 per hour wage floors. Because of the higher than usual increases, many of the municipalities cover only a segment of the labor force. For example, Massachusetts enacted a $15 base pay for home care workers. Pittsburgh, Rochester (New York), and Milwaukee are incrementally increasing their municipal employee’s minimum wages to $15. Almost twenty-four companies and schools increased their minimum wages to $15 per hour (for example, Facebook, Google, Nationwide Insurance, and the University of California).
Fight for $15 has also broken through at the state level. The nation’s largest state, California, has agreed to legislation to increase the minimum wage to $15.00 by 2021, and New York will phase in a $15.00 wage in the New York City area as part of new statewide increase. Other states, including Oregon and Missouri, are considering increases. The Commonwealth of Massachusetts is weighing the proposal for fast-food and big-box retail workers.24
But what would happen to food security if Fight for $15 were to have success at the federal level? Under the Norcross plan, the federal minimum wage would rise to $8.00 in 2016, and then increase a dollar a year until it reaches $15.00 per hour in 2023.25 This report took the following steps to generate food insecurity estimates if the Norcross proposal were adopted.
- Compute the size the minimum wage’s annual increase (in percent). For example, a move from $7.25 to $8.00 per hour is a 10.34 percent increase.
- Multiply the annual percent increase in the minimum wage by the elasticities from Table 4. This product corresponds to the predicted change in food security associated with the annual proposed increase in the minimum wage.
- The number of affected households is the product of the number in a category (for example, food secure in a given year) and the elasticity in Step 2.
- To compute the cumulative increase in food security, and reductions in low security and very low security, this report sums the annual changes from 2016 to 2023.
Based on steps 1 to 4, and the estimates in Table 4 and the USDA’s estimates of the number of households that are food secure in 2014, approximately 1.2 million households would achieve food security between 2016 and 2023 (see Table 6).26 It is important to note that the model does not take into account the possible loss of food stamps and tax credits for families with children as the minimum wage increases. Food stamp amounts are reduced as families earn more, which could have impacts of food security.27 Thus, these estimates represent potential upper bounds. Nevertheless, an increase to $15.00 per hour would represent a major anti-hunger initiative—meaning that 6.7 percent of all food insecure households would be able to meet their nutritional needs without the federal government or the philanthropic sector adding to efforts to expand anti-hunger aid.
| Table 6. Simulations of Norcross Proposal to Hike the Federal Minimum Wage to $15.00 per hour | ||
| Category | Cumulative Total | As Percent of 2014 Insecurity |
| All households | 1,159,000 | 6.7% |
| Household composition: | ||
| With children < 18 years | 341,000 | 4.6% |
| With children < 6 years | 149,000 | 4.4% |
| Married-couple families | 241,000 | 7.7% |
| Female head, no spouse | 250,000 | 7.1% |
| Male head, no spouse | 99,000 | 14.1% |
| Other household with child | 5,000 | 3.7% |
| With no children < 18 years | 812,000 | 8.2% |
| More than one adult | 493,000 | 10.1% |
| Women living alone | 175,000 | 6.0% |
| Men living alone | 142,000 | 6.7% |
| Race/ethnicity of households: | ||
| White non-Hispanic | 811,000 | 9.2% |
| Black non-Hispanic | 244,000 | 6.1% |
| Hispanic | 268,000 | 7.4% |
| Other | 156,000 | 15.9% |
| Household income-to-poverty ratio: | ||
| Under 1.00 | 104,000 | 1.7% |
| Under 1.30 | 141,000 | 1.8% |
| Under 1.85 | 225,000 | 2.1% |
| 1.85 and over | 652,000 | 16.1% |
| Income unknown | 278,000 | 10.0% |
| Area of residence: | ||
| Inside metropolitan area | 982,000 | 6.9% |
| In principal cities | 325,000 | 5.8% |
| Not in principal cities | 495,000 | 8.1% |
| Outside metropolitan area | 172,000 | 5.3% |
| Census geographic region: | ||
| Northeast | 208,000 | 7.1% |
| Midwest | 255,000 | 6.8% |
| South | 430,000 | 6.1% |
| West | 262,000 | 7.2% |
| Notes: The estimates are created as follows. The first step is to calculate the annual percent increase in the federal minimum wage. The second step is to multiply the percent increase by the elasticities in Table 3. This is the increase in food security for the minimum wage’s annual increase. To compute the number of households that will experience an increase in food security, the estimate in Step 2 is multiplied by the number of food secure households in a given year. | ||

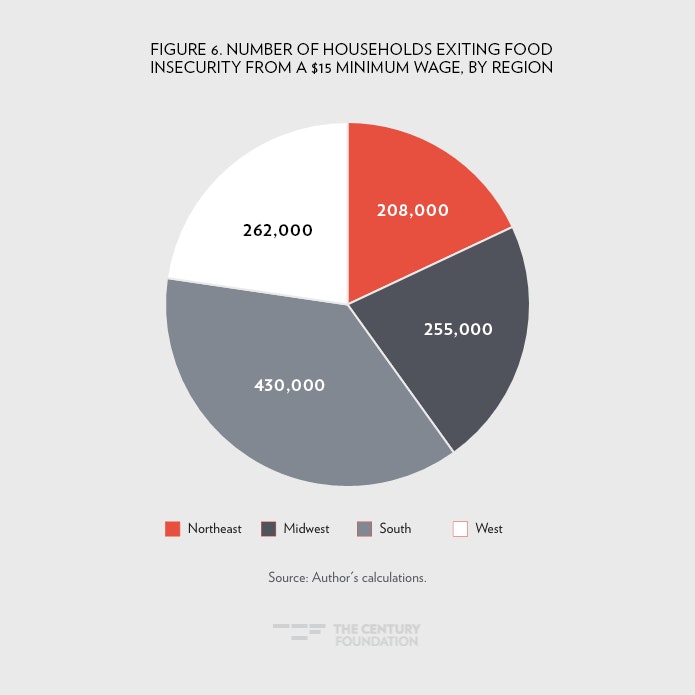
Just over 500,000 African-American and Latino households would see their food security improve, corresponding to an 6.1 to 7.4 percent reduction in nonwhite insecurity. These minority households comprise 45 percent of the 1.2 million households, yet African-American and Latino households comprise only 25 percent of all U.S. households. Almost one-quarter (349,000) of the impacted households are single-parent households. This corresponds to a 7.1 percent reduction in single mother household insecurity and 14.1 percent reduction for households headed by fathers. Single-parent households are 11 percent of all households. Most households that receive a boost reside in urban areas. Approximately 980,000 urban households would experience an increase in their food security, a 6.9 percent reduction in insecurity. From a regional standpoint, the largest number of beneficiaries would be in the South, where approximately, 430,000 households would become food secure. They constitute 37 percent of the 1.2 million households that would achieve food security, quite similar to their 38 percent of all households.
Consistent with the earlier finding that the greatest impact from an increase in the minimum wage is the movement of households from low security to food secure, households that are above 185 percent of the poverty line would have the largest number of households that become food secure under the plan. A total of 652,000 households that are above 185 percent of the poverty line would also benefit from the series of increases. They comprise 56 percent of the beneficiaries, four percentage points higher than their share of all households.
Table 7 reports estimated impacts for each state. The U.S. total differs slightly from the total reported in Table 6, because the state-level estimates of food security are based on an average of the USDA data from 2012 to 2014.28 The entries indicate that the largest number of beneficiaries will occur in California (89,000, or a 4.9 percent drop in insecurity), Texas (86,000, 5.2 percent), Florida (64,000, or 5.8 percent), Illinois (39,000, or 6.7 percent), New York (52,000, or 4.7 percent), Pennsylvania (49,000, or 8.5 percent), Ohio (36,000, or 4.5 percent), Georgia (36,000 and 5.8 percent), and North Carolina (35,000 and 5.4 percent). More interesting are the six states that will experience a decline in food insecurity rates of over 8.0 percent: Iowa (8.4), North Dakota (11.4), New Hampshire (9.5), Pennsylvania (8.5), Virginia (9.7) and Wisconsin (8.5). In these states, approximately 123,000 households would become food secure. They represent 11 percent of the 1.2 million households that would now have enough resources to achieve food security.
| Table 7. Simulations of Norcross Proposal to Hike the Federal Minimum Wage to $15.00 per hour | |||
| Reduction in Food Insecurity | |||
| State | Actual 2014 Food Insecurity | Total | As a Percent of 2014 Food Insecurity |
| United States | 17,549,389 | 1,139,000 | 6.5 |
| AK | 32,640 | 2,000 | 6.1 |
| AL | 326,592 | 18,000 | 5.5 |
| AR | 231,636 | 10,000 | 4.3 |
| AZ | 403,480 | 21,000 | 5.2 |
| CA | 1,825,065 | 89,000 | 4.9 |
| CO | 286,824 | 16,000 | 5.6 |
| CT | 195,017 | 9,000 | 4.6 |
| DC | 41,316 | 1,000 | 2.4 |
| DE | 44,407 | 3,000 | 6.8 |
| FL | 1,104,000 | 64,000 | 5.8 |
| GA | 618,580 | 36,000 | 5.8 |
| HI | 56,826 | 4,000 | 7.0 |
| IA | 143,640 | 12,000 | 8.4 |
| ID | 86,010 | 6,000 | 7.0 |
| IL | 578,331 | 39,000 | 6.7 |
| IN | 386,608 | 24,000 | 6.2 |
| KS | 186,030 | 11,000 | 5.9 |
| KY | 321,300 | 16,000 | 5.0 |
| LA | 314,688 | 16,000 | 5.1 |
| MA | 255,552 | 18,000 | 7.0 |
| MD | 285,625 | 21,000 | 7.4 |
| ME | 89,586 | 4,000 | 4.5 |
| MI | 583,884 | 31,000 | 5.3 |
| MN | 224,224 | 15,000 | 6.7 |
| MO | 409,416 | 20,000 | 4.9 |
| MS | 249,920 | 10,000 | 4.0 |
| MT | 48,990 | 3,000 | 6.1 |
| NC | 649,797 | 35,000 | 5.4 |
| ND | 26,208 | 3,000 | 11.4 |
| NE | 106,196 | 6,000 | 5.6 |
| NH | 52,400 | 5,000 | 9.5 |
| NJ | 385,047 | 25,000 | 6.5 |
| NM | 99,015 | 7,000 | 7.1 |
| NV | 168,872 | 8,000 | 4.7 |
| NY | 1,104,336 | 52,000 | 4.7 |
| OH | 805,961 | 36,000 | 4.5 |
| OK | 246,510 | 14,000 | 5.7 |
| OR | 248,745 | 9,000 | 3.6 |
| PA | 579,690 | 49,000 | 8.5 |
| RI | 53,594 | 3,000 | 5.6 |
| SC | 270,077 | 18,000 | 6.7 |
| SD | 40,936 | 3,000 | 7.3 |
| TN | 431,624 | 24,000 | 5.6 |
| TX | 1,654,640 | 86,000 | 5.2 |
| UT | 127,015 | 9,000 | 7.1 |
| VA | 318,150 | 31,000 | 9.7 |
| VT | 32,886 | 2,000 | 6.1 |
| WA | 371,544 | 16,000 | 4.3 |
| WI | 269,154 | 23,000 | 8.5 |
| WV | 117,198 | 6,000 | 5.1 |
| WY | 33,740 | 2,000 | 5.9 |
| Notes: See Table 5 for detailed description of how the estimates are generated. A state’s estimate is adjusted for the fact that several have state minimum wages that exceed the federal minimum wage. For example, the increase in the federal minimum wage does not become binding until 2019 for the District of Columbia, and 2018 for Minnesota, Vermont, Washington, Rhode Island, Oregon, Massachusetts, Connecticut, and California. | |||
Recommendations
The evidence presented in this report supports an increase in the minimum wage from its current level of $7.25 to $15.00 per hour. Such an increase would help families recover from the Great Recession and decades of stagnant wage growth, and would put downward pressure on food insecurity that remains elevated since its upward spike. The increase would also create a level playing field across jurisdictions and states, easing the human resource application of the policy. Over the past few years, as the number of municipalities and states raised their minimum wage above the federal, more and more businesses that operate across county and state boundaries were forced to spend extra resources to comply with the various pay floors. A federal minimum wage of $15.00 per hour would provide a uniform standard for employers. For employees, it would improve their family’s well-being.
Once the federal minimum wage reaches $15.00 per hour, to avoid having to engage in drawn-out political battles over raising it again, it should be increased annually based on the CPI-U. Annual increases in the minimum wage would proactively prevent households from falling out of food security and into low security.
Conclusion
Today, approximately 17.4 million households experience food insecurity. Over 10.0 million experience low security, and approximately 7.0 million face very low security. The tepid economic growth since the Great Recession has done little to lower the number of food insecure households, and many of them increasingly have had to utilize the government’s fifteen domestic food and nutrition programs and tap into emergency providers in their communities, such as food pantries, to supplement the food that they purchase. Collectively, the nation’s efforts to enable American households to achieve food security have fallen short.
This reports shows that a modest increase in the minimum wage would have no adverse impact on employment, but would have a significant impact on improving food security of low-wage households that work, with larger increases for nonwhite, high school graduate, and single parent households. The improvement in food security is mostly for households who face intermittent but significant food insecurity (known as low food security), rather than those who face consistent and severe deprivation (known as very low food security). In other words, a minimum wage increase can make a major impact on hunger among families with working members, but who face too large of a budgetary squeeze to afford enough food, each and every week. This research should encourage advocates to talk about how increases in the minimum wage can reduce food insecurity, and can even result in more effective government by reducing expenditures on welfare programs.
…this report shows that increasing the federal minimum wage to $15.00 per hour by 2023 would make a major impact on food insecurity across the nation.
Most importantly, this report shows that increasing the federal minimum wage to $15.00 per hour by 2023 would make a major impact on food insecurity across the nation. The share of food insecure households would fall by 6.5 percent. African-American and Latino households would see their food security improve, corresponding to reductions in insecurity of 6.1 and 7.4 percent. These minority households comprise a disproportionate share of the households that now become food secure. Single parents would also be winners from an increase in the minimum wage to $15.00 per hour. The simulations indicate a 7.1 percent reduction in food insecurity in households headed by single mothers, and a 14.1 percent reduction for households headed by single fathers.
In sum, given that the economic, political, and cultural constraints are not going away any time soon, an increase in the minimum wage to $15.00 per hour would provide an effective and efficient way of reducing American food insecurity. Given the current political challenges associated with increasing federal and state minimum wages to $15.00 per hour, the currently proposed incremental increases must be complemented by more assistance from fiscal policies, such as the Earned Income Tax Credit. Addressing very low food security would also require improvements in federal anti-hunger programs and local food distributions networks, alongside any wage increases.
Notes
- “Food Security in the U.S.,” United States Department of Agriculture, Economic Research Service, http://www.ers.usda.gov/topics/food-nutrition-assistance/food-security-in-the-us/key-statistics-graphics.aspx.
- SNAP provides monthly benefits that enable eligible low-income households to purchase approved food items at authorized food stores. Eligibility is based on household monthly income, assets, and certain basic expenses. In an average month of FY14, the program provided benefits to 46.5 million people (approximately 15 percent of individuals). The average monthly benefit per person was about $125, and total Federal expenditures for the program were almost $74 billion.
The National School Lunch Program operates in over 100,000 public and nonprofit private schools and residential child-care institutions. The meals provided by this program are federally subsidized. Free or reduced-price lunches are available to low-income students. In FY14, each day, the program provided lunches to an average of 30.4 million children. Just over two-thirds of the lunches were free, and an additional 8 percent were delivered at reduced prices.
The WIC program is a preventive nutrition program that provides grants to States to support distribution of supplemental foods, health care referrals, and nutrition education for low-income pregnant, breastfeeding, and non-breast-feeding postpartum women, for infants in low-income families, and for children in low-income families who are younger than five years old and who are found to be at nutritional risk. Most State WIC agencies provide vouchers that participants use to acquire supplemental food packages at authorized food stores. In FY14, WIC served an average 8.3 million participants per month at an average monthly cost for food (after rebates to WIC from manufacturers) of about $44 per person. - “Hunger in America 2014,” Feeding America, 2014, http://www.feedingamerica.org/hunger-in-america/our-research/hunger-in-america/hia-2014-executive-summary.pdf.
- “The Fight for A Higher Minimum Wage,” News Release, January 14, 2016, https://norcross.house.gov/media-center/press-releases/fight-higher-minimum-wage.
- Jared Bernstein, “The Raise the Wage Act: The New Proposal to Raise the Federal Minimum Wage to $12 in 2020,” Washington Post, April 30, 2015, https://www.washingtonpost.com/posteverything/wp/2015/04/30/the-raise-the-wage-act-the-new-proposal-to-raise-the-federal-minimum-wage-to-12-in-2020/?utm_term=.299f84375e22.
- Several caveats are in order: (1) This report is not able to adjust for the fact that several states have minimum wages that exceed the federal, and (2) it assumes the parameter estimates are the same across states. The first implies that this report’s estimates may be too large.
- “Food Security in the U.S,” United States Department of Agriculture Economic Research Service, September 8, 2015, http://www.ers.usda.gov/topics/food-nutrition-assistance/food-security-in-the-us/measurement.aspx#hunger.
- Panel to Review U.S. Department of Agriculture’s Measurement of Food Insecurity and Hunger, Measuring Food Insecurity and Hunger: Phase 1 Report (Washington, D.C.: The National Academies Press, 2005), http://www.nap.edu/read/11227/chapter/1.
- Alisha Coleman-Jensen, Matthew P. Rabbitt, Christian Gregory, Anita Singh, “Household Food Security in the United States in 2014,” United States Department of Agriculture, September 2015, http://www.ers.usda.gov/media/1896841/err194.pdf.
- See, for example, David Cooper, “Raising the Minimum Wage to $12 by 2020 Would Lift Wages for 35 Million American Workers,” Economic Policy Institute, July 14, 2014,
http://www.epi.org/publication/raising-the-minimum-wage-to-12-by-2020-would-lift-wages-for-35-million-american-workers/. - “Income before Taxes: Annual expenditure means, shares, standard errors, and coefficients of variation,” Table 1202, Consumer Expenditure Survey, U.S. Bureau of Labor Statistics, September 2015, http://www.bls.gov/cex/2014/combined/income.pdf.
- Mary Babic, Theresa DelVecchio Dys, Monica Hake, Meghan O’Leary, Elaine Waxman, and Andrew Yarrow, “From Paycheck to Pantry: Hunger in Working America,” Feeding America, http://www.feedingamerica.org/hunger-in-america/our-research/hunger-in-working-america/from-paycheck-to-pantry.pdf.
- “Income before Taxes,” Bureau of Labor Statistics Consumer Expenditure Survey, 2014, http://www.bls.gov/cex/2014/combined/income.pdf.
- Jayanta Bhattacharya, “Heat of Eat? Cold Weather Shocks and Nutrition in Poor American Families?” NBER Working Paper Series 9004, June 2002, http://www.nber.org/papers/w9004.pdf.
- Joan M. Hermsen and J. Sandy Rikoon, “Food Tradeoffs among Food Pantry Clients in Missouri, 2005 and 2010,” Department of Sociology, University of Missouri, http://foodsecurity.missouri.edu/wp-content/uploads/2014/12/Hermsen-Rikoon-Food-Tradeoffs.pdf.
- Christian Gregory, Matthew P. Rabbit, David C. Ribar, “The Supplemental Nutrition Assistance Program and Food Insecurity,” University of Kentucky Center for Poverty Research Discussion Paper Series, DP2013-10, http://www.ukcpr.org/sites/www.ukcpr.org/files/documents/DP2013-10_0.pdf.
- Note that Table 4 presents employment results because although this is CPS data, which many studies use, it is the first study that uses the Food Security Supplement. This is important because the supplements come from a variety of months: April (1995, 1997, and 1999), September (1996, 2000), August (1998), and December for the 2001 to 2011.
- The findings of other studies support this disaggregation. See Mark Nord Heather Hopwood, “Recent Advances Provide Improved Tools for Measuring Children’s Food Security,” Journal of Nutrition 137, no. 3 (2007): 533–36 and Jayanta Bhattacharya, Janet Currie, and Steven Haider, “Poverty, Food Insecurity, and Nutritional Outcomes in Children and Adults,” Journal of Health Economics 23, no. 4 (2004): 839–62.
- Nine of the Food Security questions are coded as a “yes” or a “no.” The other nine questions have three outcomes. Six of the nine food security questions ask respondents whether the statement was “often true,” “sometimes true,” or “never true” for them or other household members, allowing me to model them as an ordered probit. For these questions, I create a categorical variable that equals 0 if the respondent answers “never true,” 1 if “sometimes true,” and 2 if “often true.” Three questions ask respondents whether a particular food situation occurs “Only One or Two Months,” “Some Months, but not Every Month,” or “Almost Every Month.” A similar categorical variable that ranges from 0 to 2 is constructed. Ordered probit models are estimated for each question. In the documentation, these variables are hesh2, hesh3, hesh4, hesh5, hessh1, hessh2, hessh4, hessh3, and hessh5.
- This report’s results differ from those in Joseph J. Sabia and Robert Nielsen, “The Effect of Minimum Wages on Material Hardship: Evidence from the SIPP,” Review of Economics of the Household (2012). They find that an increase in the minimum wage has no impact on food security, while this report finds a positive impact. Why do the results in this report differ from those in Sabia and Nielson? First, this report uses the CPS’s twelve-month food security measure, while they use a SIPP four-month measure. Second, depending on the household’s composition, they use two to five questions to develop their food insecurity measure, not even half of the CPS Food Security Supplement’s eighteen questions. Their food insecurity measure is constructed as follows. SIPP respondents are first asked whether it was “often true, sometimes true, or never true” that “The food that (I/we) bought just didn’t last and (I/we) didn’t have money to get more. (I/we) couldn’t afford to eat balanced meals.” These are questions (2) and (3) in Table 5 of this report. Depending on the responses to these questions and the household’s composition, respondents were asked one or more of the following questions to measure both adult and childhood insecurity. “My child was/our child was/the children were not eating enough because (I/we) couldn’t afford enough food,” “In the past four months did you or the other adults in the household ever cut the size of your meals or skip meals because there wasn’t enough money for food?” “In the past four months did you or the other adults in the household ever eat less than you felt you should because there wasn’t enough money to buy food?” The first two questions correspond to questions 6 and 7 in Table 5. The last question is a variant of questions 8 and 9 in Table 5. Sabia and Nielson create a food insecurity dummy variable that equals 1 if the respondent said that these questions occurred “often” or “sometimes,” and 0 if they never are true. Sabia and Nielson use two of the food security questions that have the greatest incidence, but they model food security as a binary outcome. This report first demonstrates the need to model food security as an ordered probit that allows for a distinction between “Very Low” and “Low Security” households and households where the statements are “often true” and “sometimes true.” Their minimum wage variable is the natural log of the higher of the state or federal minimum wage. They include time-invariant state effects and state-invariant time effects. This means that the identification of the log minimum wage variable comes from within-state variation in the minimum wage. This report also includes this variable, but in the Regression Discontinuity Framework, the log minimum wage variable controls for selection bias, while the coefficient on the dummy variable that measures whether the state’s minimum wage exceeds the federal provides identification of the minimum wage’s impact on food security. Sabia and Nielson also face limitations with the SIPP food security sample. The food insecurity information is only available for three years: 1998, 2003 and 2005. This reduces their sample by 72 percent from 464 to 128 observations. During these three years, eleven states changed their minimum wages. This report uses food security information in every year from 1996 to 2011, providing well over twenty-nine states that increased their minimum wages to levels that exceeded the prevailing federal minimum wage. Plus, the models used for this report estimate at the person level, providing over a million observations.
- New Jersey Representatives Frank Pallone, Bonnie Watson Coleman, and Bill Pascrell are co-sponsors.
- “Fight for 15,” Fightfor15.org.
- On January 1, 2016, the following fourteen states increased their minimum wages: Alaska, $8.75 to $9.75; Arkansas, $7.50 to $8.00; California, $9.00 to $10.00; Colorado, $8.23 to $8.31; Connecticut, $9.15 to $9.60; Hawaii, $7.75 to $8.50; Massachusetts, $9.00 to $10.00; Michigan, $8.15 to $8.50; Nebraska, $8.00 to $9.00; New York, $8.75 to $9.00; Rhode Island, $9.00 to $9.60; South Dakota, $8.50 to $8.55; Vermont, $9.15 to $9.60; and West Virginia, $8.00 to $8.75.
- California’s election board must first certify the over 500,000 petitions that were submitted.
- David Madden, “Local Congressman to Sponsor Bill to Increase Federal Minimum Wage,” CBS Philly, January 14, 2016, http://philadelphia.cbslocal.com/2016/01/14/local-congressman-to-sponsor-bill-to-increase-federal-minimum-wage/.
- Several caveats are in order: (1) This report is not able to adjust for the fact that several states have minimum wages that exceed the federal, and (2) it assumes the parameter estimates are the same across states. The first implies that this report’s estimates may be too large.
- Preliminary RD estimates indicate that the increase in the minimum wage is not associated with a major decline in SNAP, WIC, and Free/Reduced Lunch Program participation.
- The model does not take into account the possible loss of food stamps and tax credits for families with children as the minimum wage increases. Thus, these estimates represent potential upper bounds.