This past July, the Department of Education under the Trump administration made a controversial move to delay regulations to address disproportionality for students of color in special education under the Individuals with Disabilities Education Act (IDEA).1 The original regulations—dubbed the “Equity in IDEA” regulations2—required that states use a consistent method for tracking and identifying districts where students of color are disproportionately identified for special education, placed in substantially separate settings, and disciplined at higher rates than their white peers. The Obama administration initially issued these regulations after the Government Accountability Office released a report3 highlighting considerable variability in states implementation of the provisions in IDEA to address disproportionality. Specifically, the GAO found that, in 2010, twenty-one states did not identify a single district as demonstrating significant disproportionality in special education. This finding raised concerns that these states were failing to effectively implement the disproportionality provisions in IDEA to track and address inequities for students of color.
Now, with the delay from the Trump administration, several organizations and policymakers are concerned that school districts will do even less to address equity in IDEA.4
To justify the delay, the Department of Education noted: “The Department also believes that the racial disparities in the identification, placement, or discipline of children with disabilities are not necessarily evidence of, or primarily caused by, discrimination.”5 Specifically, the department claimed that racial disproportionality can be appropriate because of “correlatives of poverty” —meaning that students of color should have higher rates of identification in special education because students of color are also more likely to come from low-income households and children from low-income households are more likely to have disabilities. This logic relies on two assumptions: (1) Low-income students are and should be disproportionately represented in special education and (2) Any disproportionality that occurs for students of color occurs among low-income students of color.
To determine the accuracy of these assumptions, policymakers must first understand the experience of low-income students in special education. However, little research currently exists examining the identification and placement of low-income students in special education, in part, because states are not required to report special education data by students’ income status. To be clear, the purpose of this paper is not to wave away racial disproportionality and the underlying bias that may contribute to it; we believe these dynamics exist and are problematic.6 Rather, the purpose is to better understand the disproportionality that occurs for low-income students.
In this report, we focus on the first assumption focused on low-income students and describe the identification and placement patterns for these students in special education across three states. In particular, we found:
- across all three states, students from low-income families were more likely to be identified for special education than their non-low-income peers; and
- across all three states, students from low-income families were also more likely to be placed in substantially separate classrooms than their non-low-income peers.
Past research has assumed a positive correlation between poverty and special education assignment to be appropriate, because children in poverty have experiences (lead exposure, low-birthweight, malnutrition) that tend to be more associated with disability. Therefore, the prevalence of disability is higher among low-income students and should also be higher in special education. While this connection may be true to an extent, the assumed appropriateness of higher special education identification for low-income students can be problematic because it allows educators, researchers, and policymakers to ignore potential systemic biases that may also result in higher rates of identification for special education. Our research highlights potential concerns with simply assuming the higher rates are consistently appropriate. Primarily, we find that students from low-income families are more often identified in more subjective disability categories, and that once identified as such, students from low-income families are more often placed in substantially separate classrooms where expectations for success tend to be lower, education outcomes tend to be worse, and stigma associated with special education is higher.
It is critical that all students receive the services they need to be successful and be identified for special education if needed. However, it is also critical that general education be flexibly designed to meet the needs of all students to help prevent inappropriate identification to special education. As such, we recommend:
- Data Transparency: Policymakers should amend IDEA to require the disaggregation of special education data (including identification, placement, and discipline) by income-status.
- Additional Research: Policymakers should fund research to better understand the experiences of low-income students in special education and identify practices to better meet their needs.
- Building Educator Capacity: Policymakers and educators should build the capacity of all teachers to better intervene and support students with diverse learning needs including through Multi-Tiered Systems of Support (MTSS), Universal Design for Learning (UDL), and Positive Behavior Interventions and Support (PBIS).
- Supporting Families: Policymakers continue to support programs that support and train parents to better understand the law.
A Lack of Research on Socioeconomic Disproportionality
Differences in the educational opportunities and school performance of students from low-income families as compared to non-low-income students have long been an issue of concern for educators and policymakers. As such, much of the federal role in education since the passage of the Elementary and Secondary Education Act in 1965 has focused on improving opportunities for economically disadvantaged students. Despite these efforts, gaps in academic outcomes, graduation, and post-secondary enrollment persist. Specifically, students from low-income families continue to score far below non-low-income students on the National Assessment of Educational Progress (NAEP) and graduate high school at lower rates than non-low-income students.7 These differences continue into adulthood, where children from low-income families earn lower wages, are more likely to be incarcerated, and have a lower life expectancy than otherwise similar non-low income peers.8
To improve opportunities for students from low-income families, educators, researchers, and policymakers have sought to better understand the educational experiences of these students. Special education identification and placement remain under-examined educational phenomena, in which the experiences of low-income students may differ substantially from their non-low-income peers. Identification for special education can be beneficial for students as it provides access to critical services, accommodations, and rights under the law. However, identification for special education can also result in lowered expectations, stigma, and segregation from general education classrooms.
In previous work, researchers have studied identification and placement in special education by race and ethnicity, finding that African American students and Hispanic students have higher rates of identification.9 As a result of that research, policymakers pushed states and districts to report and address disproportionality in their schools. While some researchers have argued this disproportionality can be attributed to a higher proportion of students of color also experiencing the effects of poverty, little research has actually examined whether and to what extent disproportionality exists among students from low-income families.
Educators and policymakers need a better understanding regarding the intersection of income status and special education. In this report, we examine, descriptively, potential differences in special education identification and placement among low-income and non-low income students across three states.10
Background and Context
Students with disabilities eligible for special education services in the United States have a right to a Free Appropriate Public Education (FAPE) under the Individuals with Disabilities Education Act (IDEA). Specifically, under IDEA, students are entitled to accommodations, supports, interventions, and services to enable them to have access and make progress in the general education curriculum. These accommodations, supports, interventions, and services are outlined for each eligible student in an Individualized Education Program (IEP) and determined by the IEP team (which can include teachers, parents, and administrators, and may include the student). Importantly, these services and supports agreed upon by the IEP team are provided at no cost to families. Additionally, parents of children deemed eligible are also provided rights under IDEA, including a right to due process. In 2014 approximately, 6 million students (or about 13 percent of students) were eligible for special education.11
Determinations of Eligibility and Placement
In order to be eligible for special education services under the IDEA, a student must meet two criteria (1) be identified as having a disability in one of thirteen federally defined disability categories and (2) because of that disability, need special education services. The two-part requirement for eligibility—having a disability and needing special education services—means that neither all children with disabilities in school nor all children who need additional support in school are entitled to services under IDEA. Some students, with more significant disabilities, may be identified prior to entering kindergarten but most become eligible during their school tenure. This identification process typically begins with a referral for evaluation from a classroom teacher or a parent after a child has experienced some challenges in school. After being referred for special education, the school district is responsible for conducting an evaluation to determine eligibility. The evaluation must use multiple “assessment tools and strategies to gather relevant functional, developmental, and academic information about the child.”12 Upon completion of the evaluation, educators and other professionals, along with the child’s parents, collaboratively determine whether the child meets the eligibility requirements for IDEA. Importantly, a child should not be found eligible if the determining factor is the result of “lack of appropriate instruction.”13
After a student is identified as eligible for special education, the IEP team convenes to develop the child’s IEP. As a part of the IEP, the team determines the child’s “placement,” or where the child will receive services and specialized instruction as outlined in the IEP. In determining placement, IDEA requires that students with disabilities be educated in the “least restrictive environment” (LRE) where, to the “maximum extent appropriate,” students with disabilities are educated with nondisabled peers.14 Though the law emphasizes the preference for inclusive placements in general education settings, the placement options for students range from full participation in general education to separate classrooms within traditional public schools to placement in separate public or private schools.
Figure 1
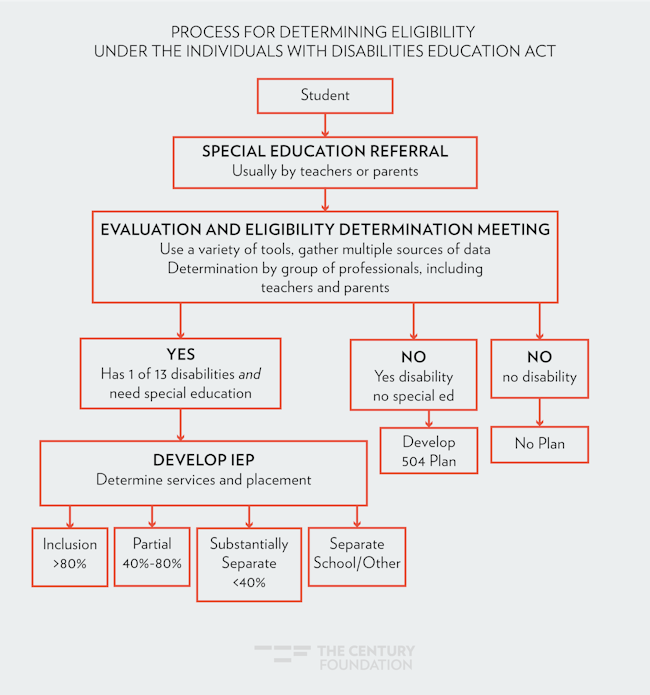
The U.S. Department of Education requires that states collect data on the amount of time students with disabilities are educated in classes with students without disabilities. For the purposes of data collection, students’ educational placements are then categorized as (1) included in general education classrooms for 80 percent or more of the day (full inclusion placement); (2) included between 40 percent to 79 percent of the day (partial inclusion placement); and (3) included less than 40 percent of the day (substantially separate placement). For a full inclusion placement, a student typically receives most of their education in general education with perhaps a pull-out or resource room support; whereas a student in a substantially separate placement typically receives most of their academic instruction in separate special education classrooms.
The Paradox of Special Education
Ever since the passage of the original IDEA, educators, researchers, and policymakers have acknowledged concern over the “paradox of special education.”15 The paradox being: special education provides students with critical services, supports, accommodations, and legal rights that help them succeed in school; yet, at the same time, special education identification can result in lowered expectations from teachers, limited access to the general education curricula, and stigma.16 Researchers have found that students placed in substantially separate settings have worse academic outcomes than students placed in general education settings.17 In addition to worse outcomes, placement in substantially separate classrooms can limit students’ access to high-quality teachers, challenging curricula, and social interactions with nondisabled peers.18 As such, the negative consequences of misidentification become more problematic if students are both misidentified and placed in substantially separate settings.
The challenge for educators is therefore to appropriately identify students as eligible for special education; that is, identify those students who, because of a disability, require special education services to access the school curriculum, while at the same time not identify those students whose challenges in school are unrelated to disability. In addition to appropriate identification, educators must also work to ensure that students are educated in the least restrictive environment in order to avoid the most concerning consequences.
Disproportionality
Given the importance of accurate identification and placement of students who qualify for special education, researchers and policymakers have expressed concern over the disproportionate representation of students of color in special education and their placement in substantially separate classrooms. As a result of the concerns related to disproportionality, Congress included provisions to address disproportionality within IDEA. Specifically, these provisions require states to collect and report data on the identification, placement, and discipline rates in special education for students of color. States are then required to set a threshold for identifying districts where significant disproportionality exists. Districts identified with significant disproportionality are required to set aside 15 percent of their IDEA funds to support implementation of coordinated early intervening services, including practices such as Multi-Tiered Systems of Support (MTSS). The rationale behind this requirement is that providing more intensive interventions in general education will help to prevent the inappropriate identification of students who may need some additional support but not need special education.
After these requirements had been in effect for a few years, members of Congress asked the Government Accountability Office (GAO) to assess their implementation.19 The GAO found that only 2 percent of districts across the country had been identified by their states as needing to use funds for early intervening services; the GAO determined that this low rate was due to variability in how states defined thresholds for disproportionality. Additionally, the GAO found that twenty-one states did not identify even a single district as having disproportionality. After the release of the GAO report, the Department of Education put out a Request for Information from the field about how to address disproportionality. Using that information, the Obama administration issued regulations in December 2016 that, in part, require states to utilize a more consistent methodology for determining disproportionality. Initially, the regulations were supposed to begin implementation this past summer; however, the Trump administration recently moved to delay implementation for two years.20 In justifying the delay, the Trump administration argued that the causes of racial disproportionality are not clear, specifically suggesting that increased rates of identification for students of color may be the result of an interaction between race and poverty.
It is true children from low-income families could be more likely to experience disability due to greater exposure to environmental toxins, low-birth weight, differences in nutrition, and lower access to health services. However, to date, little research exists examining the rates of identification and placement in special education for students from low-income families. Existing research exploring these topics are limited in their scope because they either focus on a singular community or they measure income-status using community-based factors rather than student level data.21 Educators, policymakers, and researchers need additional information focused on the extent of the disproportionality for low-income students.
Research Questions and Design
To develop a more comprehensive understanding of the identification and placement of low-income students in special education, this report seeks to answer the following questions:
- What are the rates of identification in special education for low-income students as compared to non-low-income students?
- What are the rates of placement in substantially separate classrooms for low-income students as compared to non-low-income students?
For this report, we used student-level data from all K–12 students enrolled in public schools during the 2013–14 school year in three states: two moderately sized states (between 500,000 students and 1.5 million students) and one large state (greater than 1.5 million students). These are referred to as State A, State B, and State C, respectively. For each state we examined student level data, including information on student disability status, whether or not the student received a free or reduced-priced lunch, and the student’s educational placement. Specifically, in this report, we describe the following student characteristics from the data:
- Disability Status: Disability status indicates a student is eligible for special education services.
- Disability Category: To be eligible for special education, students must be identified with one of thirteen disabilities categories. In addition to describing patterns for all students with disabilities, in this report, we highlight information on specific disabilities: Learning Disability (LD), Emotional Disability (ED), Intellectual Disability (ID), and Sensory Disability (SD). We focus on the first three categories, because they are disability categories that are more likely to be identified in school, where there may be more subjectivity involved when a student is identified with such a label. We focus on sensory disabilities (including hearing impairment and visual impairment) as a comparison, as those disabilities are considered more objective with clearer diagnostic criteria.
- Educational Placement: As previously described, student’s educational placement corresponds with the percent of time the student is educated with nondisabled peers. Specifically, we highlight information on placement in substantially separate classrooms indicating a student is educated with their nondisabled peers less than 40 percent of the school day.
- Income Status: We used student eligibility for free or reduced price lunch as a proxy for income status. Students are eligible if their family’s annual income falls below 185 percent of the federal poverty guidelines. In 2013–14, for a family of four, 185 percent corresponded with an annual salary of about $43,500 22.
In this report, we focus specifically on the descriptive patterns of identification and placement across the three states.23
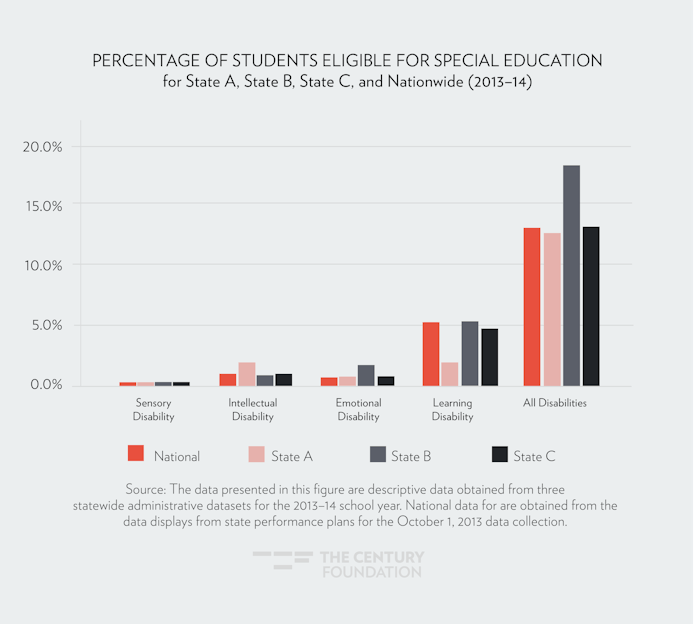
Findings: Identification
As noted above, nationally, approximately 13 percent of public school enrolled students ages 6 through 21 years old are eligible for special education.24 For context, in Figure 2, we present the the percentage distribution of students with disabilities and select disability categories nationally, as compared to State A, State B, and State C. Notably, State B identifies a higher proportion of students as eligible for special education. Additionally, State A has a lower proportion of students as eligible with specific learning disability and a higher proportion eligible with intellectual disability.
Figure 2
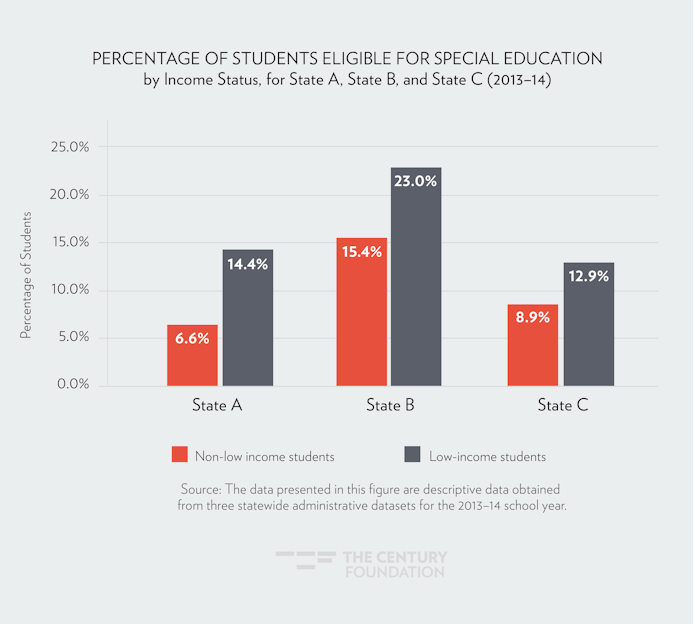
Finding 1: Low-income students were more likely to be identified for special education services than non-low-income peers.
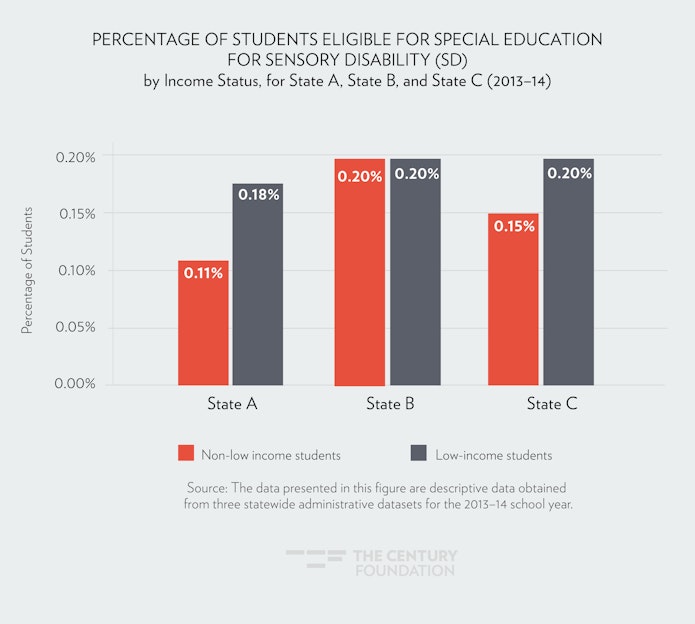
In Figure 3, we present the percentage of students eligible for special education by income status across all three states. As displayed, low-income students were identified for special education services at higher rates than their non-low-income peers. In State B, 23 percent of low-income students were identified as eligible for special education services as compared to 15.4 percent of non-low-income students. Although State B had the highest rate of identification among low-income students, State A had the largest difference in enrollment between low-income and non-low-income students, with low-income students being identified at over twice the rate of non-low-income students.
Figure 3
Finding 2: Low-income students were more likely to be identified for special education in more subjective disability categories than their non-low-income peers.
In Figures 4 through 7, we present the percentage of students eligible for special education for students with a learning disability, emotional disability, intellectual disability, and sensory disability by income status across all three states. Students from low-income families continue to have higher identification rates across these specified disability categories, but in the more subjectively defined disability categories (LD, ED, and ID) the magnitude of the difference is greater than in the more objective sensory disability category. In particular, across all states, descriptively, students from low-income families had about twice or more than twice the identification rate with emotional disability or intellectual disability as compared to non-low-income children. However, the rates of identification for sensory disabilities by income status are more similar.
Figure 4
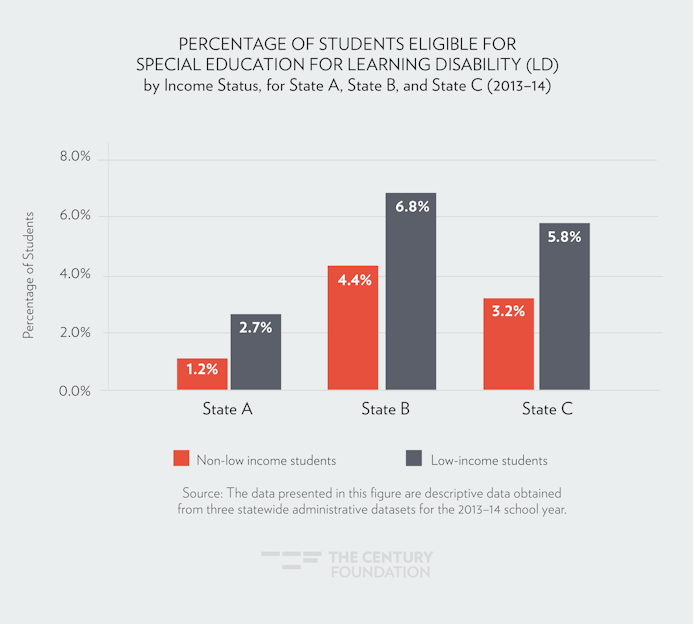
Figure 5
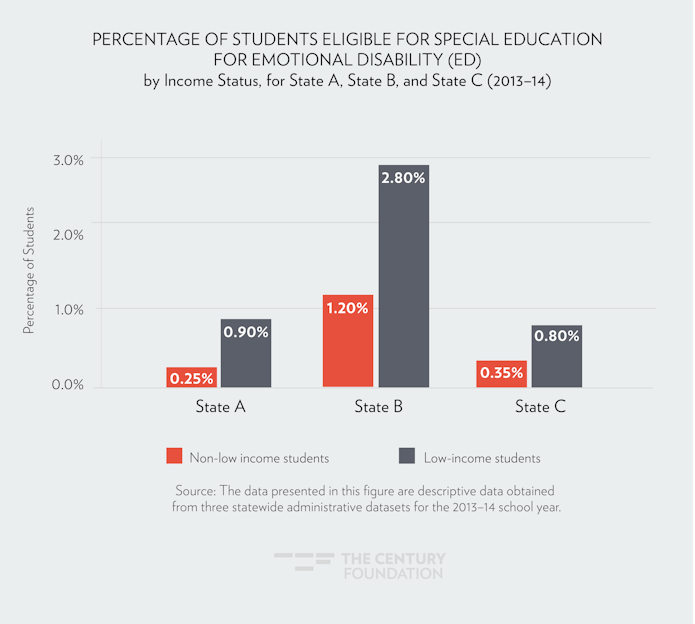
Figure 6
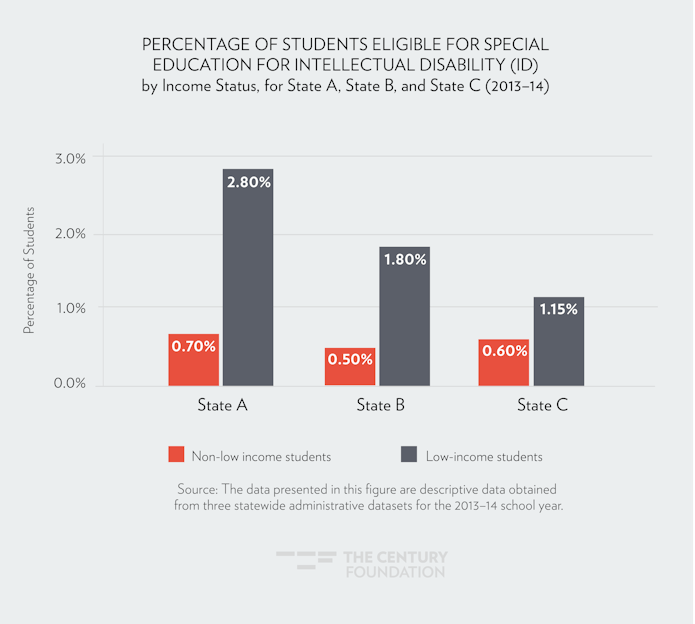
Figure 7
Findings: Placement
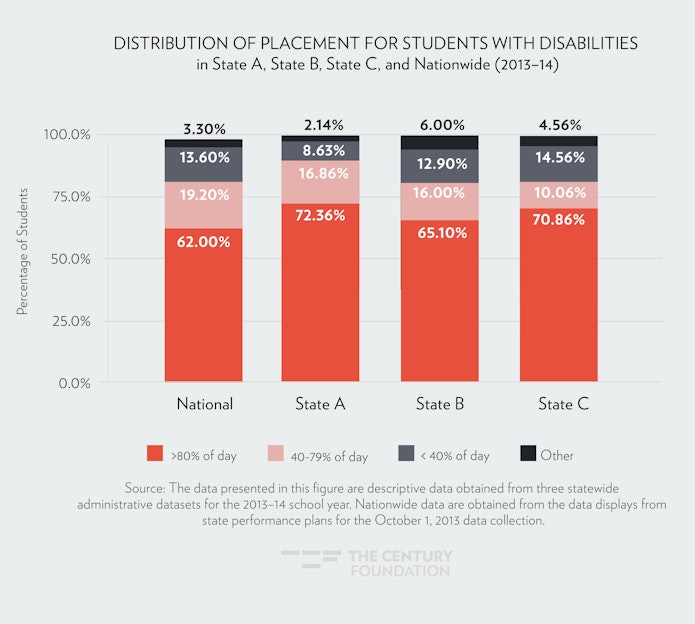
In Figure 8, we present the placement distribution for students with disabilities nationwide as well as for the three states included in the analysis. For each, about two-thirds of all students are educated in the general education setting for 80 percent or more of their school day. For the purposes of the analysis in this report, we focus on the difference across placement patterns for students who are educated in substantially separate classrooms within traditional public schools. These are students who are reported by local school districts as spending less than 40 percent of their school day with nondisabled peers. Notably, State A, with only 9 percent of students with disabilities educated in substantially separate classrooms, has a lower rate when compared to the nationwide rate or the rates of other states in this report.
Figure 8
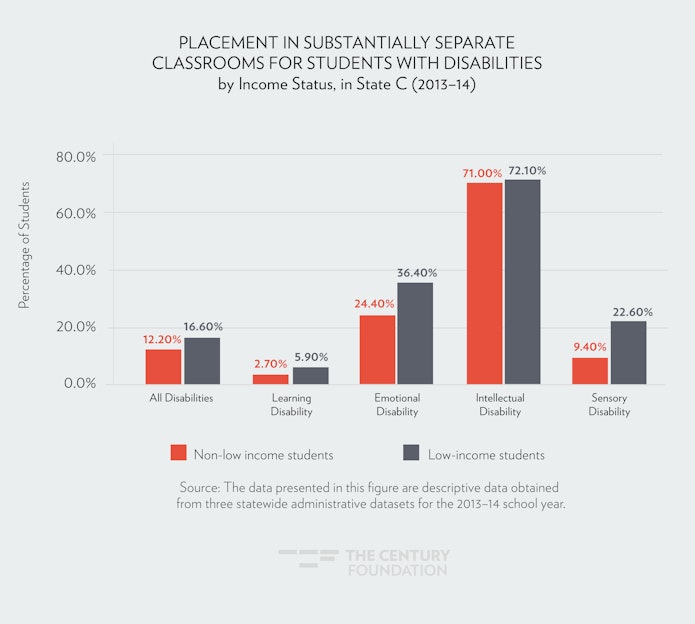
Finding 3: Low-income students with disabilities were more likely to be placed in substantially separate classrooms than their non-low-income peers.
Once identified, low-income students were placed in substantially separate classrooms at higher rates than their non-low-income peers across the three states. In Figure 9 through 11, we depict the rates of placement in substantially separate classrooms for low-income as compared to non-low-income students for all students with disabilities as well as select disability categories. The difference in placement rates for low-income as compared to non-low-income students was narrowest in State A (9 percent compared to 8 percent) and largest in State B (19 percent compared to 8 percent).
Within certain disability categories the differences between low-income and non-low-income students with disabilities are more substantial. Looking across disability categories in nearly every case, with the exception of intellectual disability, students from low-income families had twice (or more) the rate of placement in substantially separate classrooms than non-low-income students. For instance, in State B, 33.5 percent of low-income students with emotional disabilities were placed in substantially separate settings as compared to 15 percent of non-low-income students with emotional disabilities.
Figure 9
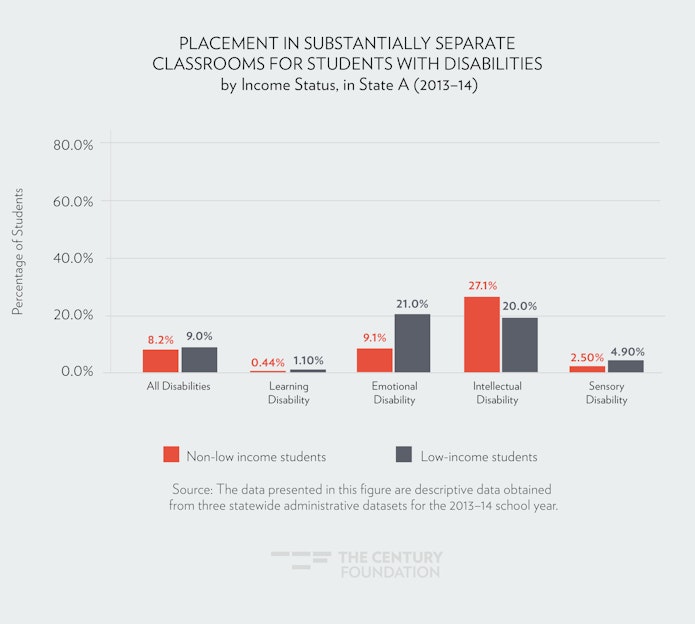
Figure 10
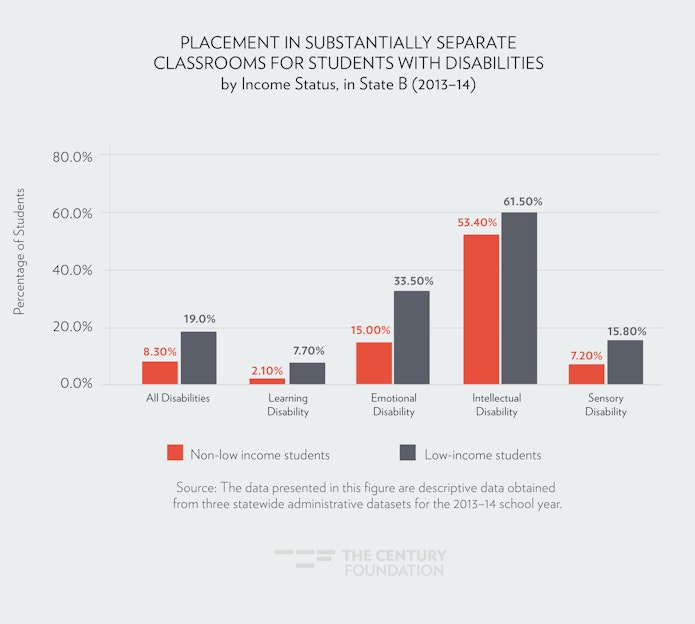
Figure 11
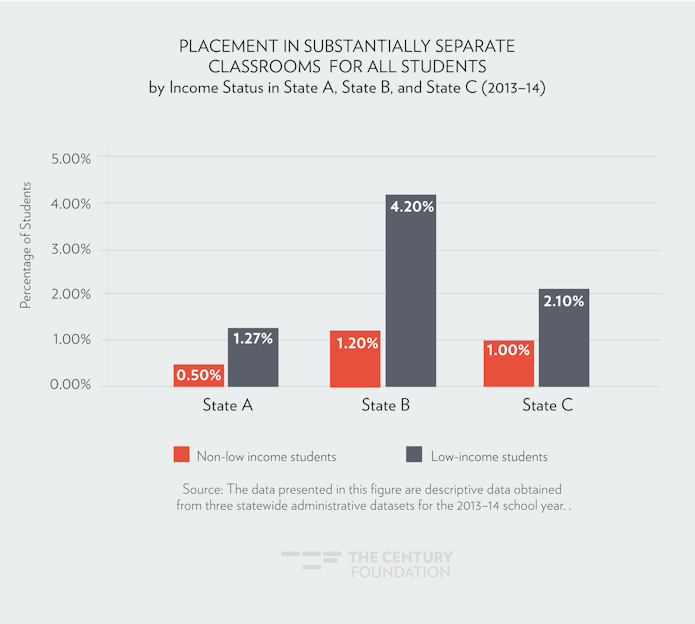
Given the higher rates of identification for special education among low-income students, looking at placement as a percentage of students eligible for special education masks some of the differences between the overall populations of low-income and non-low-income students. Another way to consider the experiences of students is to look at the percent of all students in substantially separate classrooms. Considering the data this way offers a better comparison when trying to assess difference in the exposure to the potential negative consequences of placement in substantially separate classrooms (including stigma, low-expectations) for the population of low-income students as a whole. As depicted in Figure 12, in each state, low-income students were more than twice as likely to be educated in substantially separate classrooms than non-low-income students. For instance, in State B, 4.2 percent of all low-income students are educated in substantially separate special education classrooms. That rate is 3.5 times higher than the rate of 1.2 percent of all non-low-income students.
Figure 12
Discussion
In this report, we provide descriptive statistics for the identification and placement for low-income students in special education. Specifically, we found that low-income students were more likely to be identified for special education and subsequently placed in substantially separate classrooms than their non-low-income peers. Although these data provide only an initial examination into the experiences of low-income students in special education, they highlight notable differences for students from low-income families and non-low-income families.
In a study on special education and racial disproportionality, University of Miami professor Beth Harry and University of Colorado professor Janette Klingner have noted that disproportionality “must be considered a problem if either the precursors to or the outcomes of placement are inappropriate or inadequate.”25 Although these data do not examine the appropriateness or adequacy of the identification process, they do present clear evidence of disproportionality in special education, specifically in more subjectively defined categories and in substantially separate classrooms. As is often the case, assuming the correlation between special education and poverty reflects a true difference in the underlying abilities of low income and non-low income students is problematic. It is problematic because it allows policymakers and educators to continue potential inequities without critically looking at ways in which the school system may be creating or exacerbating these differences. Given the negative consequences associated with, in particular, substantially separate classrooms, educators, researchers, and policymakers should further examine school systems and the experiences of students from low-income families to better support these students and ensure their needs are being appropriately met.
Recommendations
Given these findings, we suggest policymakers, researchers, and practitioners consider the following recommendations.
- Data Transparency: IDEA currently requires states disaggregate special education data including identification, placement, and discipline, by race and ethnicity. To help better understand the experiences of students from low-income families and inform decisions for special education, federal policymakers should require that these data also be disaggregated by income-status.
- Additional Research: The findings presented here provide a descriptive examination of the identification and placement patterns for low-income students in special education. Researchers should further explore these issues to understand the appropriateness of the disproportionate identification and placement in special education.26 Examining the interaction between race and income as it relates to special education identification and placement is essential to better understand how racial disproportionality is related to poverty.Researchers should also explore the mechanisms behind the differential rates. For instance, how do teacher perceptions, evaluation procedures, district programs and practices, and environmental factors influence identification and placement for low-income students in special education?
- Building Capacity: The findings in this report suggest that schools are not sufficiently meeting the needs of low-income students within general education currently. Schools, districts, states, and policymakers should seek to build the capacity of all teachers to better support students with diverse learning needs. Multi-Tiered Systems of Support (MTSS), Universal Design for Learning (UDL), and Positive Behavior Interventions and Support (PBIS) can be useful frameworks for better supporting students with diverse learning needs within the general education setting. Policymakers and school leaders should also support ways for providing in-school wraparound services, including counseling and mental health supports. When general education can provide interventions and supports to children within the general education to mitigate some of the concerns associated with poverty, fewer children may be inappropriately referred for special education.
- Schools can use funds from several programs in the Every Student Succeeds Act (ESSA), including Title IA (funded at nearly $15.9 billion),27 Support Effective Instruction Grants (funded at $2 billion), and Student Support and Academic Enrichment Grants (funded at nearly $1.2 billion) to support these efforts. Additionally, districts can use up to 15 percent of their IDEA funds to implement coordinated early intervening services for students at-risk of being identified special education.Importantly, any effort to address disproportionality in schools does not change a school’s responsibility for “child find” under IDEA. Schools still have the obligation to refer and evaluate children with suspected disabilities to determine whether those students need special education services. As the Department of Education has outlined, use of MTSS cannot be used to “delay or deny” a child an evaluation.28
- Supporting Families: Families can be key partners to ensuring students receive the supports and services they need in school. Caregivers play a pivotal role in IEP meetings when determining services as well as placement. To ensure students from low-income families receiving effective services in the least restrictive environment, their caregivers need to be well-equipped to know and understand their rights under the law. Policymakers should continue to support Community Parent Resource Centers (CRPCs) and Parent Training and Information Centers (PTIs, funded at $27 million) to better support low-income families.
To reduce economic and social inequalities, students, regardless of income status, must have equal opportunities to benefit from education. If general education systems are not sufficiently prepared to meet the needs for students from low-income families and as a result students are getting inappropriately identified and then placed in substantially separate classrooms at higher rates, these students are not be afforded a equal opportunity. Policymakers and educators should act on these recommendations to better inform and improve opportunities for students from low-income families.
Acknowledgments
The authors would like to thank the Spencer Foundation for their generous support for the research for this project.
Notes
- U.S. Department of Education. “Delay of compliance date, Assistance to States for the Education of Children with Disabilities,” Federal Register 83, no. 128 (July 3, 2018): 31,306, https://www.gpo.gov/fdsys/pkg/FR-2018-07-03/pdf/2018-14374.pdf.
- U.S. Department of Education. “Equity in IDEA, Assistance to States for the Education of Children with Disabilities,” Federal Register 81, no. 243 (December 19, 2016): 92,376, https://www.gpo.gov/fdsys/pkg/FR-2016-12-19/pdf/2016-30190.pdf.
- U.S. Government Accountability Office (GAO), “Standards Needed to Improve Identification of Racial and Ethnic Overrepresentation in Special Education,” GAO 13-137, February 27, 2013, https://www.gao.gov/products/GAO-13-137.
- The Leadership Conference to Assistant Secretary Collett, “RE: Docket ID ED-2017-OSERS-0128,” May 14, 2018, http://civilrightsdocs.info/pdf/policy/letters/2018/SigDisJointComment051418SIGNERS.pdf; Bobby Scott and Patty Murray to Assistant Secretary Collett, “RE: Docket ID ED-2017-OSERS-0128,” May 14, 2018, http://democrats-edworkforce.house.gov/imo/media/doc/2018-05-14%20Bicameral%20Significant%20Disproportionality%20Comment%20Letter.%20pdf.pdf.
- U.S. Department of Education. “Delay of compliance date, Assistance to States for the Education of Children with Disabilities,” Federal Register 83, no. 128 (July 3, 2018): 31,306, https://www.gpo.gov/fdsys/pkg/FR-2018-07-03/pdf/2018-14374.pdf.
- In forthcoming research, we focus on the second assumption and examine whether disproportionality exists for students of color when controlling for income-status.
- U.S. Department of Education, “The Nation’s Report Card,” 2017, https://www.nationsreportcard.gov; U.S. Department of Education, “Regulatory Adjusted Graduation Rate 2014-2015,” Ed Data Express, https://eddataexpress.ed.gov/.
- Raj Chetty, et al., “The Association between Income and Life Expectancy in the United States, 2001–2014,” Journal of the American Medical Association 315, no. 14 (April 11, 2016); Also see the Health Inequality Project website, https://healthinequality.org/.
- See, for example, Minority Students in Special and Gifted Education, ed. Suzanne M. Donovan and Christopher T. Cross (Washington, D.C.: National Academies Press, 2002); Dan J. Losen and Gary Orfield, Racial Inequity in Special Education (Cambridge, MA: Harvard Education Press, 2002).
- As noted above, in forthcoming research, we also explore the interaction between race and income status on special education identification and placement.
- Retrieved from U.S. Department state data display based on the number of first grade through twelfth grade students enrolled in public schools for the 2013–14 school year, at https://www2.ed.gov/fund/data/report/idea/partbspap/allyears.html.
- IDEA, 20 U.S. Code Sec 1414(b)(2).
- IDEA, 20 U.S. Code Sec 1414(b)(5).
- IDEA, 20 U.S. Code Sec 1412(a)(5).
- Minority Students in Special and Gifted Education, ed. Suzanne M. Donovan and Christopher T. Cross (Washington, D.C.: National Academies Press, 2002).
- Alfredo J. Artiles, et al. “Justifying and explaining disproportionality, 1968–2008: A critique of underlying views of culture,” Exceptional Children 76, no. 3, (2010): 279–99; Beth Harry and Janette K. Klingner, Why Are So Many Minority Students in Special Education? Understanding Race and Disability in Schools (New York: Teachers College Press, 2014); Dan J. Losen and Gary Orfield, Racial Inequity in Special Education (Cambridge, MA: Harvard Education Press, 2002); Minority Students in Special and Gifted Education, ed. Suzanne M. Donovan and Christopher T. Cross (Washington, D.C.: National Academies Press, 2002).
- Thomas Hehir, et al., “A Summary of the Evidence on Inclusive Education,” Abt Associates, August 2016, https://www.researchgate.net/publication/312084483_A_Summary_of_the_Research_Evidence_on_Inclusive_Education/download; Larry Newman, et al., “Secondary School Programs and Performance of Students with Disabilities: A Special Topic Report of findings from the National Longitudinal Transition Study-2 (NLTS2) (NCSER 2012-3000),” National Center for Special Education Research, 2011, https://ies.ed.gov/ncser/pubs/20123000/pdf/20123000.pdf; Laura Schifter, “Using Survival Analysis to Understand Graduation of Students with Disabilities” Exceptional Children 82, no. 4 (2016), https://doi.org/10.1177/0014402915619418; Thomas Hehir, et al., “Special education in the Commonwealth of Massachusetts: Study commissioned by the Massachusetts Department of Elementary and Secondary Education,” 2012, retrieved from http://www.doe.mass.edu/sped/hehir/.
- Russell J. Skiba, et al., “Disparate access: The disproportionality of African American students with disabilities across educational environments,” Exceptional Children 72, no. 4 (2006): 411; James McLeskey, Naomi C. Tyler, and Susan S. Flippin, “The supply of and demand for special education teachers: A review of research regarding the chronic shortage of special education teachers,” Journal of Special Education 38, no. 1 (2004): 5–21.
- U.S. Government Accountability Office (GAO), “Standards Needed to Improve Identification of Racial and Ethnic Overrepresentation in Special Education,” GAO 13-137, February 27, 2013, https://www.gao.gov/products/GAO-13-137.
- U.S. Department of Education, “Delay of compliance date, Assistance to States for the Education of Children with Disabilities,” Federal Register 83, no. 128 (July 3, 2018): 31306, https://www.gpo.gov/fdsys/pkg/FR-2018-07-03/pdf/2018-14374.pdf.
- Aydin Bal, Amanda L. Sullivan, and John Harper, “A situated analysis of special education disproportionality for systemic transformation in an urban school district,” Remedial and Special Education 35, no. 1 (2014), https://doi.org/10.1177/0741932513507754; Dan J. Losen and Gary Orfield, Racial Inequity in Special Education (Cambridge, MA: Harvard Education Press, 2002).
- U.S. Department ofAgriculture, “Child Nutrition Programs Income Eligibility Guidelines,” Federal Register 78, no. 61 (March 29, 2013): 19179, https://www.gpo.gov/fdsys/pkg/FR-2013-03-29/pdf/C1-2013-06544.pdf.
- See forthcoming research for modeled information examining the intersection of income-status and race in special education identification and placement.
- Retrieved from U.S. Department of Education state data display, based on the number of first grade through twelfth grade students enrolled in public schools for the 2013–14 school year, https://www2.ed.gov/fund/data/report/idea/partbspap/allyears.html.
- Beth Harry and Janette K. Klingner, Why Are So Many Minority Students in Special Education?: Understanding Race and Disability in Schools (New York: Teachers College Press, 2014), 168.
- As noted previously, in forthcoming research, we examine the intersection of race and income status as it relates to special education identification and placement.
- U.S. Department of Education, “Fiscal Year 2019 Congressional Action Budget Table,” October 9, 2018 https://www2.ed.gov/about/overview/budget/budget19/19action.pdf.
- U.S. Department of Education “Memo: A Response to Intervention (RTI) Process Cannot Be Used to Delay-Deny an Evaluation for Eligibility under the Individuals with Disabilities Education Act,” OSEP 11-07, January 21, 2011 https://www2.ed.gov/policy/speced/guid/idea/memosdcltrs/osep11-07rtimemo.pdf.