
The relationship between charter schools and school integration has been complicated from the start. In the late 1980s, inspired by a vision articulated by Albert Shanker, president of the American Federation of Teachers, policy leaders and educators in Minnesota began dreaming up ideas for a new kind of public school which would empower teachers, integrate students, and serve as educational laboratories. They began brainstorming laws and policies that would be needed to make this a reality. In an influential report, the Citizens League, a Minnesota community policy organization, outlined a vision for “chartered schools” that included “Building Additional Quality through Diversity” as one of two main tenets. At the time, it was already clear that racial and socioeconomic integration in schools was one of the most effective educational interventions for raising the achievement of students of color and those from low-income backgrounds (and research in the decades following has only added to that evidence).1 The Citizens League’s report called for requirements to ensure that charter schools would have “an affirmative plan for promoting integration by ability level and race.”2 However, in 1991, when Minnesota passed the first charter school law in the country, school integration provisions were nowhere to be found.3 Today, a pending class action lawsuit accuses the state of allowing cities and towns to establish school policies that enable segregation and names charter schools as one of the drivers of racial isolation.4
At a time when socioeconomic segregation in schools is steadily rising and racial segregation is, by many measures, worse than it was in the 1970s,5 the potential for charter schools to either fight or abet segregation is consequential. As of the 2017–18 school year, an estimated 3.2 million children—6 percent of all public school students—attended charter schools.6 These charter schools are affected by many of the same policies, community histories, and racial and economic power dynamics that have led to extreme school segregation in many states, but they also have key flexibilities that traditional public schools do not have. As schools that are typically built from scratch, and which have the freedom to design, staff, and implement school models that appeal to a wide range of families and enroll students from multiple neighborhoods, charter schools have the potential to be powerful tools for furthering racial and socioeconomic integration in public schools. But for a variety of reasons—including the ins and outs of state policies—charter schools have rarely lived up to that vision.
States set the key laws and policies that allow charter schools to open, determine their funding, and set accountability mechanisms. In the twenty-eight years since Minnesota passed the first charter school law, the number of states with charter schools has grown to forty-three (and the District of Columbia). While there are many commonalities among charter school policies in most states, there is also considerable variation with regard to key aspects of charter school policy that have the potential to support school integration and curb segregation. For instance, some states consider the diversity of charter school enrollment as part of application and renewal decisions, while others do not; some states require and fund transportation for charter school students, while others do not; and some states allow charter schools to consider diversity-related factors in their lottery to encourage integration, while others do not.
This report analyzes charter school policies and enrollment trends in each state to attempt to answer the fundamental question, How well do states support integration in charter schools? The centerpiece of our analysis is a series of state profiles—with key findings, recommendations, enrollment data, and policy information for each state. (View your state scorecard here.) The narrative text provided here in this report explains the methodology used to create those profiles and provides a summary of some national trends.
The overall pattern of these results is clear: states are failing when it comes to supporting integration in charter schools.
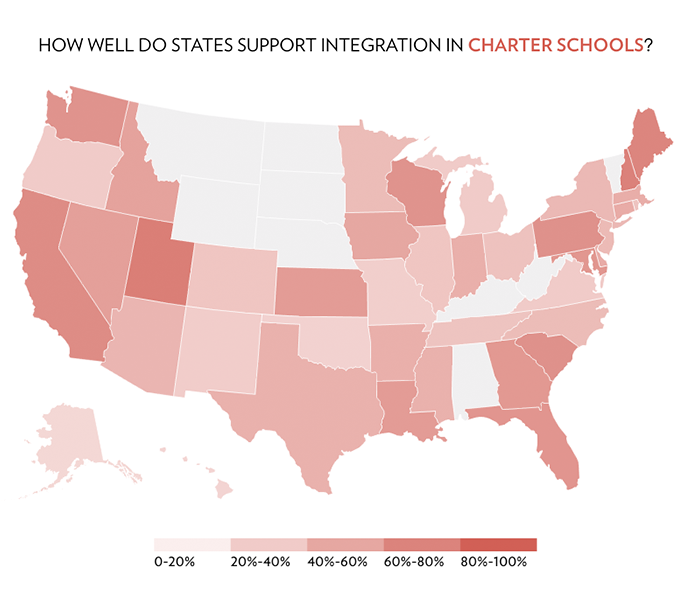
While each state has a unique charter school landscape in terms of both policies and enrollment trends, the overall pattern of these results is clear: states are failing when it comes to supporting integration in charter schools. The highest score for any state on the report’s combined measure of policies and enrollment demographics is just 62 percent out of 100 percent, earned by Utah. No single state has in place all ten of the policies the authors identified as supportive of integration; on average, states have less than half of these in place.
How well do states support integration in charter schools?
See how your state stacks up and view your state scorecard here.
The policy analysis in this report reveals that most states lack basic protections to ensure that all students, including marginalized groups, have access to charter schools in the admissions and enrollment process. For example:
- Only five states specifically prohibit charter schools from requiring mandatory parent volunteer hours.
- Only four states require charter schools to open up seats that become available when students leave mid-year, or before the school’s final grade, to new students.
- Only seven states specifically require all charter schools to provide free and reduced-price meals.
- Fewer than half of all states require and fund transportation of charter school students.
- Thirteen states allow some charter schools to use selective admissions criteria, such as academic records or test scores, interviews, performances, or “interest” screens.
In addition, few states require a robust consideration of charter schools’ likely effects on integration as part of the application and renewal process:
- Only six states require authorizers to consider the diversity of the student body and the charter school’s effect on enrollment demographics in district schools as part of charter school application and renewal decisions.
- Only fifteen states require charter schools to provide detailed outreach plans addressing how they will recruit families with diverse backgrounds.
Weighted lotteries, on the other hand, are an area of untapped potential for individual charter schools and authorizers to promote integration in many states. Roughly two-thirds of states appear to allow charter schools to use some form of weighted lottery considering diversity factors. Thus far, however, few charter schools have implemented such lotteries.7
Alongside this policy analysis, enrollment trends reveal a similarly bleak picture. In an analysis of racial integration in the five counties with the largest charter enrollments in each state, no state showed charter schools increasing racial integration in all of those counties, and more than one-third of states did not show charter schools having a positive effect in any of those same counties.
The message to state policymakers, therefore, is that all states have ways in which they should strengthen existing charter school laws and policies to support integration and prevent segregation in charter schools. Moreover, these findings create a call to action for charter school leaders and authorizers to seize untapped potential for better using the charter school model as a tool to promote regional integration.
These findings create a call to action for charter school leaders and authorizers to seize untapped potential for better using the charter school model as a tool to promote regional integration.
Elsewhere, The Century Foundation has documented growing interest among educators in creating charter schools that reflect the racial and socioeconomic diversity of their communities. These schools are often engaged in highly creative efforts to create inclusive environments, moving beyond desegregated school buildings to foster truly integrated classrooms. It is deeply troubling that the demonstrated interest of many charter school educators, parents, and students for schools that celebrate diversity is not being supported by state policies.
This report begins with a discussion of our methods for policy analysis and our findings on policy trends. Next, we discuss the methodology and findings from our analysis of charter school enrollment demographics in each state. Finally, we explain our system for turning these analyses into scores that can be used to compare states and make recommendations for how state policies can better support integration in charter schools.
Methods for Policy Analysis
Based on a review of existing research and conversations with key advocates, policymakers, researchers, and leaders from both charter and traditional public school sectors, we identified ten key policies that support integration in charter schools. In choosing these policies, we focused on encouraging racial and socioeconomic integration, though we recognize that effective school integration also requires looking at other aspects of diversity, such as the inclusion of students with disabilities and English language learners.8 We then reviewed charter school policies in all fifty states, plus the District of Columbia. Of these, forty-three states plus the District of Columbia turned out to have functional charter school laws (from here on, we refer to this group as forty-four states). Six states—Montana, Nebraska, North Dakota, South Dakota, Vermont, and West Virginia—do not have charter school laws. Kentucky, which passed a charter school law in 2017 but, as of February 2019, had not passed funding for charter schools and had no charter schools in operation in the state, is also not included.
Our state policy review was anchored in each state’s charter school law. In addition to looking at the statutes, we also looked at relevant state regulations, guidance from state education departments, and policy documents from charter school authorizers. We sent our draft policy analyses to reviewers in each state at both the state department of education and state charter advocacy organizations (in those states in which these exist). We received feedback from reviewers in thirty-five of the forty-four states. (Given the complexity and scope of this policy review, we imagine that there may still be places in which our review has errors or omissions, and we welcome readers to email Halley Potter at [email protected] with additional feedback.)
Policy Trends across States
According to our analysis, the key policies that support integration in charter schools fall into four broad categories: the removal of barriers to access, affirmative supports for diverse enrollment, authorizing processes that encourage diversity, and other policies. Below we list each policy, a brief explanation of why it was included in our review, and information on how many states have that policy in place. Table 1 presents a summary of this analysis.
Table 1
| State Charter School Policies Supporting Integration | |||
| State Totals (of the 43 states plus the District of Columbia with functional charter school laws) | |||
| Yes | Partially | No/Unclear | |
| Removing Barriers to Access
1. Selective Admissions Requirements Prohibited Does the state specify that charter schools: a. May not use any selective admissions requirements (must be open to any student eligible to attend a regular public school)? |
31 | 6 | 7 |
| b. May not charge any fees other than those charged by other public schools? | 24 | 1 | 19 |
| c. May not require mandatory parent volunteer hours? | 5 | 0 | 39 |
| d. Must abide by a general non-discrimination provision (with respect to race/ethnicity and other categories)? | 42 | 0 | 2 |
| e. Must “backfill” to enroll new students when students leave the school? | 4 | 0 | 40 |
| 2. Transportation Provided and Funded
Does the state include requirements and funding for the transportation of charter school students that are similar to those that apply to district students? |
18 | 6 | 20 |
| 3. Free and Reduced-Price Meals Provided
Does the state require all charter schools to participate in the federal free and reduced-price lunch program (or to provide a comparable free meals program)? |
7 | 0 | 37 |
| 4. Reporting on Discipline and Student Attrition Required
Does the state require charter schools to report data on student discipline and re-enrollment rates and make this data available to the public? |
18 | 17 | 9 |
| Affirmative Supports for Diverse Enrollment
5.Enrollment Preferences to Promote Diversity Allowed Does the state either explicitly allow or not prohibit charter schools to consider diversity-related factors (such as socioeconomic status or educational risk factors) in their lottery to encourage integration? |
26 | 3 | 15 |
| 6. Charters Encouraged to Serve and Reflect Diverse Communities
Does the state: a. Allow charter schools to enroll students from multiple school districts or across a region, without requiring a preference for in-district students? |
17 | 14 | 13 |
| b. Not restrict charter school location to high-poverty districts or otherwise prohibit charter schools from locating in racially and socioeconomically diverse areas? | 40 | 1 | 3 |
| c. Require charter schools to set enrollment targets based on the demographics of the communities served and take steps to reach those targets? | 7 | 6 | 31 |
| Does the state include all three elements (6a, 6b, and 6c)? | 1 | 42 | 1 |
| 7. Unified Enrollment Supported
Does the state require or support unified enrollment systems? |
3 | 2 | 39 |
| Authorizing Processes that Encourage Diversity
8.Authorizers Review Diversity of Charter School Enrollment Does the state require authorizers to consider the diversity of the student body (with respect to categories such as race/ethnicity, socioeconomic status, language, and disability) as part of charter school application and renewal decisions, including an analysis of the charter school’s effect on enrollment demographics in district schools? |
6 | 20 | 18 |
| 9. Diverse Outreach Plans Required
Does the state require authorizers to ask charter applicants for detailed plans regarding how they will disseminate information to prospective students and parents, including efforts to reach families with diverse racial, ethnic, linguistic, and socioeconomic backgrounds and students with disabilities? |
15 | 9 | 20 |
| 10. Authorizer Accountability Possible
Does the state have the ability: a. to review authorizer performance? |
33 | 5 | 6 |
| b. to sanction authorizers? | 23 | 4 | 17 |
| Other
Does the state include any other notable provisions with respect to diversity, including supports for English language learners (ELLs) or students with disabilities (SWDs)? |
N/A | N/A | N/A |
Removing Barriers to Access
Policies 1–4 on the list concern removing barriers that could prevent some students—particularly low-income students, students of color, and other marginalized groups—from attending charter schools.
1. Selective Admissions Requirements Prohibited
Does the state specify that charter schools:
- May not use any selective admissions requirements (must be open to any student eligible to attend a regular public school)
- May not charge any fees other than those charged by other public schools?
- May not require mandatory parent volunteer hours?
- Must abide by a general non-discrimination provision (with respect to race/ethnicity and other categories)?
- Must “backfill” to enroll new students when students leave the school?
While charter schools are typically open enrollment schools, in some states, certain charter schools are allowed to use selective admissions criteria, such as academic records or test scores, interviews, performances, or “interest” screens. These admissions criteria have the potential to impact racial and socioeconomic diversity. In addition, though charter schools are tuition-free, state policies vary as to whether charter schools are forbidden to require parents to complete mandatory service hours or charge additional fees (such as those for an application, uniforms, or transportation) as a condition of enrollment—requirements which all have the potential to limit access for low-income students. States also differ as to whether charter schools are required to admit new students to fill any seats that become available if students leave mid-year or before the school’s final grade (such as leaving a high school after the tenth grade) or whether they are allowed to limit enrollment of new students to the beginning of the school year or to certain entry grades (for example, no new students admitted after ninth grade in a high school). These “backfilling” policies also have the potential to impact diversity, as students who are living in poverty or experiencing homelessness are more likely to move schools.9 And although charter schools are required to abide by federal non-discrimination provisions,10 states vary as to whether they specify that charter schools must comply with state non-discrimination standards.
Of the forty-four states with functional charter school laws, all except Alaska and Kansas include non-discrimination provisions for charter schools, but some states have more extensive lists of protected categories than others. For example, some states, including California, Connecticut, Iowa, and Massachusetts, specify that charter schools may not discriminate against students based on sexual orientation or gender identity. Most states also prohibit charter schools from using selective admissions requirements or charging fees other than those charged by district schools. However, only five states (California, Georgia, Illinois, Louisiana, and Utah) specifically prohibit charter schools from requiring mandatory parent volunteer hours, and only four states (Connecticut, Georgia, Idaho, and Massachusetts) require charter schools to backfill enrollment. It is not clear how prevalent mandatory parent volunteer hours or policies against backfilling actually are, since in most states these decisions are left up to individual charter schools or authorizers. For instance, in California, a 2014 report found that 30 percent of schools examined had some sort of parent work quota11—a finding that prompted the state Department of Education to inform charter schools that such policies are illegal,12 and ultimately led to new legislation clearly prohibiting the practice.13 Conversely, although Indiana has no statewide policy on backfilling, one of the state’s authorizers, the Indiana Public Charter School Board, has a policy of requiring schools to backfill.14
2. Transportation Provided and Funded
Does the state include requirements and funding for the transportation of charter school students that are similar to those that apply to district students?
3. Free and Reduced-Price Meals Provided
Does the state require all charter schools to participate in the federal free and reduced-price lunch program (or to provide a comparable free meals program)?
Because housing patterns are frequently segregated by race and class,15 school integration often requires bringing together students from multiple neighborhoods—which makes transportation an essential component of charter school integration. Fewer than half of all states include requirements and funding for transportation of charter school students that are similar to those for district students.
Fewer than half of all states include requirements and funding for transportation of charter school students that are similar to those for district students.
Additionally, the provision of free and reduced-price meals to qualifying students is essential in order to achieve socioeconomic integration; however, only seven states (California, Delaware, District of Columbia, Iowa, Maryland, Ohio, and Texas) specifically require all charter schools to provide free and reduced-price meals. As of 2015–16, only 2 percent of students in district schools attended schools that did not participate in the federal free and reduced-price meal program (or had missing data), compared to 9 percent of charter school students.16 In some states, such as Washington, that do not explicitly require charter schools to provide free and reduced-price meals, all charter schools in the state participate in the program anyway. However, in some states without the requirement, a sizable proportion of charter schools do not offer free and reduced-price meals. For example, as of 2013–14, 20 percent of Colorado charter schools did not participate in the federal free and reduced-price lunch program.17
4. Reporting on Discipline and Student Attrition Required
Does the state require charter schools to report data on student discipline and re-enrollment rates and make this data available to the public?
Harsh or unfairly enforced discipline codes at a school can prove an impediment to students staying enrolled at a school, as can failing to provide mandated special education services or accommodations for disabilities and the practice of “counseling out” low-performing students; individual instances of such practices in charter schools have been documented,18 and all of these practices often disproportionately impact students of color.19 Regular and disaggregated reporting on disciplinary actions and student attrition/re-enrollment can help shed light on which students are being suspended or expelled from a given school, as well as which students are leaving the school and why. This information can in turn help authorizers and state officials find and address patterns in inequitable practices.20 Most states require at least some reporting on discipline or student attrition, but only eighteen states clearly require charter schools to make public data on both.
Affirmative Supports for Diverse Enrollment
The second group of policies in the list relate to tools and requirements that encourage and enable diverse enrollment in charter schools.
5. Enrollment Preferences to Promote Diversity Allowed
Does the state either explicitly allow or not prohibit charter schools to consider diversity-related factors (such as socioeconomic status or educational risk factors) in their lottery to encourage integration?
Weighted lotteries and “set-aside” policies21 that give priority to or reserve seats for particular groups of students based on diversity-related factors can be powerful tools for achieving diverse enrollment in charter schools, magnet schools, and other schools that use lottery-based admissions.22 The diversity factors that are considered most frequently are related to socioeconomic status (such as eligibility for free or reduced-price lunch; eligibility for other public assistance programs, such as TANF, SNAP, and/or Medicaid; participation in Section 8 or residence in public housing; self-reported household income; or parental educational attainment), but other types of factors can promote integration as well. For example, dual language immersion schools with weighted lotteries based on students’ home languages can also promote integration by language, resulting in classrooms that include a mix of students who are native English speakers and those who use the target language at home; they often also functionally promote racial and socioeconomic diversity as well.23 State laws regarding the use of weighted lotteries are often unclear; however, roughly two-thirds of states appear to allow charter schools to implement weighted lotteries that could be used to encourage integration—either by explicitly allowing such preferences or by remaining silent on the issue—while a third of states appear to prohibit the use of such lotteries.24
Despite most states seeming to have room in their laws to allow some consideration of diversity-related factors in charter admissions, relatively few charter schools have implemented weighted lotteries to encourage integration.
It is worth noting that despite most states seeming to have room in their laws to allow some consideration of diversity-related factors in charter admissions, relatively few charter schools have implemented weighted lotteries to encourage integration. Although there is no central catalog of individual school-based weighted lottery policies, a 2016 inventory by The Century Foundation of school districts and charter schools with enrollment policies to encourage socioeconomic integration identified just fourteen charter schools and networks with such policies in place. 25Weighted lotteries may be an area of untapped potential for individual charter schools and authorizers to use to promote integration in many states.
6. Charters Encouraged to Serve and Reflect Diverse Communities
Does the state:
- Allow charter schools to enroll students from multiple school districts or across a region, without requiring a preference for in-district students?
- Not restrict charter school location to high-poverty districts or otherwise prohibit charter schools from locating in racially and socioeconomically diverse areas?
- Require charter schools to set enrollment targets based on the demographics of the communities served and take steps to reach those targets?
Another way to support integration is to ensure both that charter schools (1) are able to serve diverse communities by locating in diverse districts or by serving multiple districts, and (2) are required to take steps to ensure that the diversity of those communities is reflected by their student populations. Though these policies work together, they do not necessarily encourage integration on their own. For example, inter-district enrollment or location in a diverse area without a requirement to reflect the communities served could be used to target students of only one demographic, such as attracting a disproportionately white student body from across multiple districts, resulting in increased segregation. And, if charter schools are not able to serve integrated communities or diverse regions, enrollment targets end up encouraging charter schools to replicate the segregated housing and schooling patterns that surround them. These policies are a key area for improvement for all states. Only one state, North Carolina, meets all three of these policy components; notably, the state has also been criticized for poor enforcement of the demographic enrollment targets which are written into its charter law.26
7. Unified Enrollment Supported
Does the state require or support unified enrollment systems?
Unified enrollment systems allow families to use a single process to apply to any public school, whether district or charter, in their district. These systems have the potential to make it easier for families of all backgrounds to navigate the school selection process by creating a single set of application requirements and timelines, consolidating translation services, and making information accessible in multiple formats.27 Although unified enrollment systems are typically developed by individual cities, five states (Delaware, District of Columbia, Louisiana, Massachusetts, and Nevada) have policies that support, encourage, or require unified enrollment in some way.
Authorizing Processes that Encourage Diversity
The final set of policies in the list addresses the role that the charter school authorizing process plays in encouraging integration and preventing segregation in charter schools.
8. Authorizers Review Diversity of Charter School Enrollment
Does the state require authorizers to consider the diversity of the student body (with respect to categories such as race/ethnicity, socioeconomic status, language, and disability) as part of charter school application and renewal decisions, including an analysis of the charter school’s effect on enrollment demographics in district schools?
9. Diverse Outreach Plans Required
Does the state require authorizers to ask charter applicants for detailed plans regarding how they will disseminate information to prospective students and parents, including efforts to reach families with diverse racial, ethnic, linguistic, and socioeconomic backgrounds and students with disabilities?
As the bodies with the authority to decide which charter schools are approved to open or continue operating and which are denied or closed, authorizers play a huge role in shaping a given state’s charter school sector, and they often have considerable leeway in making these decisions. State policies can help guide authorizers’ practices by requiring them to consider the actual or proposed diversity of enrollment as part of their application and renewal decisions; they can also ask for detailed plans for addressing diverse outreach. More than half of states require authorizers to consider the diversity of charter school enrollment in some manner in approval or renewal decisions, but only six states (California, Connecticut, Florida, Mississippi, New Jersey, and Wisconsin) have policies that meet all of our authorizing, renewal and recruitment criteria designed to promote integration. Connecticut’s charter law, for example, specifies that, “In determining whether to grant a charter, the State Board of Education shall consider the effect of the proposed charter school on the reduction of racial, ethnic and economic isolation in the region in which it is to be located.”28 It also allows for the state education commissioner to place a charter on probation at any time if the school has failed to achieve measurable progress in reducing racial, ethnic, and/or economic isolation.29
Fifteen states meet our full criteria for requiring charter schools to provide detailed plans about diverse outreach. Rhode Island, for example, requires charter schools to engage in proactive recruitment in the community in order to diversify the applicant pool, and to use multiple outreach methods. Compliance with outreach plans is part of a charter school’s annual assessments, which include analyzing data regarding the school’s applicant pool.30
10. Authorizer Accountability Possible
Does the state have the ability:
- To review authorizer performance?
- To sanction authorizers?
State policies governing authorizers—including those with the potential to impact school integration—have limited power if they are not able to hold authorizers accountable by reviewing their performance (and sanctioning authorizers which perform poorly). Currently, thirty-three states have the power to review authorizer performance (although this review is often not required), but only twenty-three states have policies allowing the state to sanction authorizers.
Other Policies Affecting Integration
Although our policy review focused on supports for racial and socioeconomic integration, we also noted additional charter policies that could impact school integration, including those addressing serving students with disabilities and English language learners. The degree to which states address either student population specifically in their charter policies varies widely. Alaska, for example, does not prohibit charter schools from refusing to enroll a student with disabilities whom they believe will not benefit from the school’s teaching methods,31 while Louisiana’s policies include a number of specific requirements regarding serving English language learners and students with disabilities.32 Some states, including Louisiana and New York, have specific requirements about communicating with students in the languages predominantly spoken in the community. However, it is notable that even in states such as Tennessee, Rhode Island, and Massachusetts, which have fairly strong requirements regarding outreach and recruitment of English language learners, state charter law does not require the state to offer any source of funding for translation of student recruitment materials and outreach efforts.
States also vary as to whether or not charter schools are considered their own local education agencies (LEAs) for the purpose of providing special education services—meaning that some charter schools are responsible for providing a host of services to students with disabilities, whereas for other charter schools, the local school district bears the responsibility for providing many of these services. The lack of clarity, continuity, and oversight that can result when the charter school is not the special education LEA was recently demonstrated in a complaint against the New York City Success Academy charter network.33 In New York State, school districts retain LEA status for the provision of special education services in charter schools, which means that none of the charter school staff responsible for implementing IEPs are LEA employees. This structure can lead to lack of adequate IEP implementation and other deficiencies, which in this case caused the state education department to find both the school network and New York City to be out of compliance with a host of special education requirements.
Very few states require a comprehensive, clear approach to ensuring that students with disabilities and English language learners are offered the range of supports needed to ensure equal access to the educational environment.
Most states also do not clarify who is financially responsible when a charter school student requires intensive special education services. Only three states (Arizona, Delaware, and New York) specify charter school versus district responsibility for high cost, low-incidence disability placements. Overall, very few states require a comprehensive, clear approach to ensuring that students with disabilities and English language learners are offered the range of supports needed to ensure equal access to the educational environment (which is required by federal law).34
Summary of Policy Trends
The overall portrait of state charter school policies with respect to integration is one with many holes—as well as a few bright spots. Prohibitions against selective admissions requirements are widespread, but not clear-cut or uniform. Key supports for integration such as transportation and access to free and reduced-price meals are only guaranteed in a fraction of states. Additionally, most states lack requirements for a robust consideration of diversity as part of the charter school authorizing process. Nevertheless, two-thirds of states allow for some sort of weighted lottery to promote diversity, a tool that more charter schools could implement.
Methods for Enrollment Analysis
In addition to reviewing charter school policies in each state, we also analyzed demographic enrollment data for charter schools and district schools in each state to provide a snapshot of diversity and integration in that state’s public schools. The profile for each state (for the forty-one states, plus the District of Columbia, for which enrollment data was available35) includes data on overall enrollment in charter schools versus all public schools (district and charter) with respect to race, economic status, English proficiency, and disabilities, as well as the average exposure to peers of different races and economic backgrounds.
The profile of each state also includes an analysis based on the index of dissimilarity—a measure of the level of student body integration—for the state’s five counties with the largest charter school enrollment. The index of dissimilarity measures how closely schools in a geographic region (in this case, a county) resemble the overall demographic profile of public school enrollment in that area. For our calculations, we analyzed racial integration; the index of dissimilarity indicates the percentage of students of color, or of white students, who would have to change schools in order to achieve an even distribution of white students and students of color across all schools in the county.
While school district boundaries are sometimes used for demographic comparisons, these boundaries themselves are often large drivers of segregation.
This analysis was designed to measure how well charter schools are functioning as tools for increasing racial integration across a given county. Counties were chosen as the unit of comparison from the geographic markers available in federal education data sets because counties, in many (though not all) cases, establish reasonable boundaries within which school integration could take place. While school district boundaries are sometimes used for demographic comparisons, these boundaries themselves are often large drivers of segregation. According to one study, as of the year 2000, segregation between districts accounted for more than 70 percent of all racial school segregation in large metropolitan areas and 66 percent of the school segregation in smaller metropolitan areas.36 Whereas only thirteen states, which are located mostly in the South, have countywide school districts in all or most counties, most states have multiple school districts per county.37 There are about 3,000 counties in the United States38 (compared to more than 13,000 school districts39 nationwide), and the median land mass of a county is about 600 square miles40 (compared to roughly 100 square miles41 for a school district). Most counties encompass multiple towns and school districts yet represent areas that are geographically compact enough to make some cross-county travel for school attendance possible.
If the index of dissimilarity for a county increases when charter schools are included in the calculation, this indicates that enrollment in charter schools is, on average, more dissimilar from the overall county demographics than the rest of the public schools in the county; thus, charter schools can be interpreted as having a negative effect on school integration in that county. By contrast, if the index of dissimilarity decreases when charter schools are included, this indicates that enrollment in charter schools is, on average, closer to the overall county demographics than the rest of the public schools in the county; thus, charter schools can be interpreted as having a positive effect on school integration in that county. Importantly, this calculation does not indicate whether public schools overall in a county would be more or less integrated if charter schools did not exist, because it does not take into account how charter enrollment affects other schools or where charter students would be enrolled if they did not attend that charter. It also does not necessarily indicate whether charter schools are more or less integrated than other schools in their district, since this calculation represents a county—and, in many cases, there are multiple school districts included in that county. In fact, it is possible, for example, for every school—both district and charter—which is located in a particular district to have a negative effect on school integration across a county that includes multiple districts if the district lines themselves are large contributors to segregation in that area. However, our analysis only analyzed the effect of excluding or including charter schools in these calculations.
Enrollment Trends across States
Our analysis showed that the demographic trends in charter school enrollment vary widely across states but, by and large, charter schools are not promoting integration, based on the measures included.
Statewide Charter Demographics
Comparing the overall charter school population to the overall public school population (which includes both district and charter schools) in each state clarifies the challenges of generalizing about charter school demographics. States are almost evenly split between those in which charter schools enroll a greater proportion of low-income students (as compared to total public school enrollment) and those in which charter schools enroll a smaller proportion. In most states (twenty-nine), charter schools enroll a smaller percentage of white students than the total public school population, but in thirteen states, charter schools enroll a greater percentage of white students. In most states, charter schools also enroll a smaller percentage of English learners and a smaller percentage of students with disabilities—but there are plenty of states in which the opposite is true. English language learner enrollment in charters is greater than the average for all public schools in sixteen states, and the same is true for enrollment of students with disabilities in ten states.
Our analysis of students’ average exposure to peers of different racial and economic backgrounds also reveals large variation across states. Patterns include:
- Differences by student race: In California, the poverty rate of the average student’s school varies considerably depending on a student’s race, but is similar across district and charter schools.
- Differences by sector: Across all racial groups, the average Illinois student in a charter setting attends a school with a higher poverty rate than the average student in a district setting.
- More racial diversity: The average white student in a D.C. charter school is in a more racially diverse setting than the average white student in a district school.
- Less racial diversity: In North Carolina, the average white charter student attends a school with greater white enrollment than the average white district student, and the average black charter student attends a school with greater black enrollment than the average black district student.
- Similar demographics: On average, Utah students in district and charter schools attend schools with roughly the same racial demographics.
There is no one narrative that sums up the trends in charter school enrollment nationwide, and statewide data may also obscure significant local variation. These demographic enrollment statistics are heavily influenced not only by which students charter schools are serving (or not serving) within a community, but also by where charter schools are (and are not) located within a state. As such, it is impossible to determine from these statistics whether charter schools are serving a proportional of students in different demographic groups based on their location. It is clear, however, that there are state-level demographic enrollment patterns worthy of further investigation.
Racial Integration in Counties
The dissimilarity index calculations show that, in most cases, charter schools are not functioning as tools for increasing racial integration across a county. In an analysis of the change in dissimilarity index when including charter schools in the five counties with the largest charter enrollments in each state, seventeen states did not show charter schools having a positive effect on racial school integration in any of these counties. That means that in these counties, charter schools were, on average, more dissimilar from the overall county demographic balance of students of color and white students than the rest of the public schools in the county. Only nine states (Florida, Kansas, Maine, Maryland, New Hampshire, Pennsylvania, South Carolina, Utah, and Wisconsin) show charter schools having a positive effect on racial integration in a majority of their counties with the largest charter school enrollments.
Only nine states (Florida, Kansas, Maine, Maryland, New Hampshire, Pennsylvania, South Carolina, Utah, and Wisconsin) show charter schools having a positive effect on racial integration in a majority of their counties with the largest charter school enrollments.
Again, these results may be driven by where charter schools are located and not just whom they serve. Charter schools may be located in school districts or neighborhoods in which most public schools—district or charter—contribute to increased levels of segregation across a county by virtue of the demographics of the population living there and how district lines are drawn. However, if that is so, it leads to questions about how charter policies and practices could change those dynamics: What would it take to locate charter schools in a wider variety of neighborhoods, for instance, or to encourage them to serve students from multiple districts?
Scoring the States
Each state’s profile provides information on unique features of that state’s policy context and enrollment trends that cannot be summed up by a single statistic. However, in order to enable some comparisons across states, we attempted to quantify these profiles in terms of three scores: a policy score, an enrollment score, and an overall score found by averaging the policy and enrollment scores. Table 2 lists the scores and rankings for each state.
Table 2
| State Support for Integration in Charter Schools: Overall, Policy, and Enrollment Scores | ||||||
| State | Overall Score | Rank | Policy Score | Rank | Enrollment Score | Rank |
| Utah | 62% | 1 | 43% | 25 | 80% | 1 |
| New Hampshire | 61% | 2 | 42% | 28 | 80% | 1 |
| Maine | 59% | 3 | 51% | 13 | 67% | 3 |
| California | 55% | 4 | 70% | 6 | 40% | 10 |
| South Carolina | 52% | 5 | 44% | 22 | 60% | 4 |
| Pennsylvania | 52% | 6 | 43% | 25 | 60% | 4 |
| Wisconsin | 51% | 7 | 42% | 27 | 60% | 4 |
| Washington | 51% | 8 | 68% | 7 | 33% | 16 |
| Florida | 50% | 9 | 40% | 29 | 60% | 4 |
| Maryland | 49% | 10 | 37% | 31 | 60% | 4 |
| Georgia | 48% | 11 | 57% | 11 | 40% | 10 |
| Louisana | 46% | 12 | 72% | 4 | 20% | 18 |
| Kansas | 46% | 13 | 32% | 35 | 60% | 4 |
| Nevada | 44% | 14 | 48% | 16 | 40% | 10 |
| Idaho | 42% | 15 | 44% | 24 | 40% | 10 |
| Iowa | 40% | 16 | 47% | 20 | 33% | 16 |
| Connecticut | 37% | 17 | 73% | 2 | 0% | 26 |
| Delaware | 37% | 18 | 73% | 1 | 0% | 26 |
| District of Columbia | 36% | 19 | 73% | 3 | 0% | 26 |
| Massachusetts | 36% | 20 | 71% | 5 | 0% | 26 |
| Indiana | 35% | 21 | 31% | 36 | 40% | 10 |
| Arkansas | 35% | 22 | 49% | 14 | 20% | 18 |
| Texas | 34% | 23 | 48% | 18 | 20% | 18 |
| Mississippi | 34% | 24 | 67% | 8 | 0% | 26 |
| Arizona | 32% | 25 | 25% | 40 | 40% | 10 |
| New York | 30% | 26 | 60% | 9 | 0% | 26 |
| New Jersey | 29% | 27 | 58% | 10 | 0% | 26 |
| North Carolina | 28% | 28 | 56% | 12 | 0% | 26 |
| Minnesota | 28% | 29 | 36 % | 33 | 20% | 18 |
| Ohio | 25% | 30 | 49% | 14 | 0% | 26 |
| Rhode Island | 24% | 31 | 48% | 16 | 0% | 26 |
| Tennessee | 24% | 32 | 47% | 19 | 0% | 26 |
| Illinois | 23% | 33 | 26% | 39 | 20% | 18 |
| Colorado | 23% | 34 | 46% | 21 | 0% | 26 |
| Michigan | 20% | 35 | 20% | 41 | 20% | 18 |
| Oregon | 20% | 36 | 39% | 30 | 0% | 26 |
| Virginia | 20% | 37 | 19 % | 42 | 20% | 18 |
| New Mexico | 19% | 38 | 18% | 43 | 20% | 18 |
| Missouri | 18% | 39 | 36% | 32 | 0% | 26 |
| Oklahoma | 16% | 40 | 32% | 34 | 0% | 26 |
| Hawaii | 15% | 41 | 31% | 36 | 0% | 26 |
| Alaska | 13% | 42 | 27% | 38 | 0% | 26 |
| Alabama | ** | ** | 44% | 22 | ** | ** |
| Wyoming | ** | ** | 5% | 44 | ** | ** |
| Kentucky | * | * | * | * | * | * |
| Montana | * | * | * | * | * | * |
| Nebraska | * | * | * | * | * | * |
| North Dakota | * | * | * | * | * | * |
| South Dakota | * | * | * | * | * | * |
| Vermont | * | * | * | * | * | * |
| West Virginia | * | * | * | * | * | * |
| * State has no functional charter school law. ** State did not have charter school enrollment data available. Note: In cases of ties, states with the same score were assigned the same (highest) rank. |
||||||
Policy Scores
The policy score is designed to capture how well a state’s charter school law supports opportunities for charter schools to promote integration. We scored each state according to our list of ten policies. Each question was worth one point, with subparts of multi-part questions each worth a fraction of point. States got full credit if they had that policy in place, half credit if they met part but not all of the criteria for that policy, and no credit if they did not have the policy or it was unclear whether or not the policy exists. A score of 10 out of 10, or 100 percent, represents the strongest possible law based on our rubric. The median score across states was 4.4 points out of 10, or 44 percent, with individual state scores ranging from 5 percent to 73 percent.
Enrollment Scores
The enrollment score is designed to provide one measure of how well charter schools are functioning as tools for racial integration in a state in practice. We translated our analysis of dissimilarity indices into a score for each state. That score that represents the percentage of the five counties with the largest charter school enrollments in which charter schools have a net positive or neutral effect on racial integration, as measured by decreasing or maintaining the index of dissimilarity when included in the calculation for a county. (In states with fewer than five counties with charter schools, the score is calculated using all counties with charter school enrollments.) For example, a state in which two out of five counties with the largest charter enrollments see a decrease in the index of dissimilarity when charters are included in that calculation would receive an enrollment score of 40 percent. The median score across states was 20 percent, with individual state scores ranging from 0 percent to 80 percent. Because the enrollment scores are based only on the index of dissimilarity, they reflect how evenly students of different races are distributed across schools—but not how much racial diversity students are actually exposed to in their schools.
Overall Scores
The overall score averages the policy score and the enrollment score to provide a measure of how well a state is supporting integration in charter schools both through policy and in practice. The states at the bottom of the list for overall scores—Alaska, Hawaii, Oklahoma, Missouri, and New Mexico—consistently had few of the key policies in place and showed integration in fewer than half of the counties with the largest charter enrollments. The top of the list, however, is less predictable: California is the only state that fell within the top ten states for both policy scores and enrollment scores, and the states with the highest overall scores—Utah, New Hampshire, Maine, California, and South Carolina—are mostly states that have strong enrollment scores and average policy scores.
Interpreting the Scores
These scores should represent the beginning of a conversation, not the end. The enrollment score is based on only one measure of school integration; using multiple measures, or a different measure altogether, might yield a different picture. In addition, the policy score weights each policy equally and does not account for the interaction of policies. Connecticut and New Jersey, for example, each have above-average policy scores, but each state also has key policy limitations that have the potential to drastically reduce the possibility for integration in charter schools. Connecticut’s law contains strong language about holding charter schools accountable for integration, including the power for the commissioner of education to place a charter school on probation if it fails to make progress in reducing segregation, but the state currently restricts the opening of charter schools to only certain districts with low-achieving schools. New Jersey’s law likewise includes explicit provisions designed to assess the impact that charter schools will have on school integration (and factors that into approval and renewal decisions), but New Jersey does not allow charter schools to enroll students from multiple districts without a preference for in-district students. As a recent lawsuit against the state points out, most of the segregation across public schools in New Jersey occurs between school districts rather than within them, so inter-district enrollment is crucial if charter schools are to have an integrating effect.42
With those caveats in mind, the overwhelming finding of our analysis is clear: across the board, states are failing when it comes to supporting integration in charter schools. An overall score of 100 percent would indicate that a state includes all of the key provisions supporting school integration in their charter policies and shows charter schools having a positive effect on racial integration in all of the top counties with largest charter school enrollments. No state come anywhere close to 100 percent. The highest score for any state, earned by Utah, is just 62 percent.
Interestingly, there is no clear relationship between policy scores and enrollment scores. Some of the states with the highest policy scores had low enrollment scores, and most of the states with the highest enrollment scores had only average policy scores. The lack of a clear relationship between stronger charter policies with respect to school integration and stronger outcomes for integrated enrollment in charters echoes findings from a 2011 study by Virginia Commonwealth University professor Genevieve Siegel-Hawley and Pennsylvania State University professor Erica Frankenberg that found charter school laws addressing segregation did not necessarily result in less segregation within a state’s charter schools.43 Indeed, across other areas of charter policy—such as accountability and funding—researchers have also struggled to find a relationship between stronger policies and better outcomes for charter schools.44
This does not mean that state charter school policies have no impact on outcomes, but it does mean that they are not the only inputs that matter. Figure 1 offers one way of conceptualizing how charter school policies—and specifically state charter school policies—fit into the bigger picture of school integration and segregation across all schools in an area. Charter school policies are just one factor among many—alongside housing patterns, district policies, and parent choices, for example—that impact school diversity. State policies are, in turn, only one level of charter school oversight, and the impact of these policies is also dependent on the degree to which they are enforced.
Figure 1
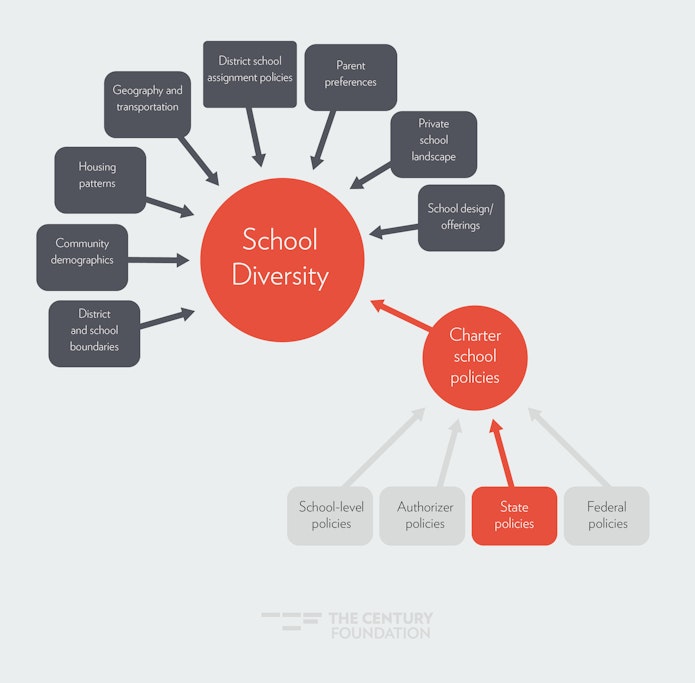
In their report “Advancing Intentional Equity in Charter Schools,” University of Wisconsin–Madison professor Julie Mead and University of Connecticut professor Preston Green lay out a framework for comprehensive federal, state, and authorizer actions that govern charter school planning, oversight, and complaint procedures.45 This framework is helpful to keep in mind when considering the power—and limitations—of state charter school policies. Enforcement of state and federal charter policies and the specifics of authorizer and school-level practices may ultimately have a greater impact on school demographics than state or federal policies themselves.
It is also possible that there are other confounding variables that impact charter school diversity. Some of the states with the highest enrollment scores—Utah, New Hampshire, and Maine—have predominantly white public school enrollment and, due in part to this homogeneity, have had lower levels of school segregation in general than many other states.46 Many of the states with low enrollment scores—such as Illinois, Michigan, New York, and New Jersey—are states with high levels of segregation across all public schools, not just charters.47 Furthermore, some state charter school policies that specifically address segregation and integration were created in response to a history of segregation in that state or were added in response to specific problems seen in the charter sector that might not be fully resolved. (One example of this is California’s recent implementation of laws clarifying that charter schools cannot require parent work hours and must provide free and reduced-price meals.48) While it seems unlikely that state charter school policies have no effect on integration in charter schools, it is clear that they are only one piece of a complicated puzzle.
Recommendations for States
With charter school policies and enrollment trends so varied across states, recommendations for increasing integration in charter schools should be tailored to states. The profile for each state highlights several key ways that policymakers in that state could strengthen supports for integration and, for some states, also includes a call for authorizers or charter school leaders to better implement or take advantage of existing provisions in state policy. For example, dozens of states, including New York and New Jersey, could better support integration in charter schools by allowing charter schools to enroll students from multiple districts without requiring preference for in-district students. Georgia, Massachusetts, Nevada, North Carolina, and South Carolina could all better enforce existing laws requiring charter schools to meet certain demographic enrollment targets or to reflect the demographics of their communities. Connecticut and Missouri could allow more charter schools to open in racially and socioeconomically diverse areas. States including Florida, Texas, and Wisconsin, as well as the District of Columbia, could allow charter schools to use weighted lotteries to promote diversity. Lastly, individual charter schools in states such as California, Colorado, and Hawaii could take advantage of the option that already exists to implement such weighted lotteries.
The theme across all of these state-by-state recommendations, however, is that states can and should be doing much more to support integration and prevent segregation in charter schools:
- All states have ways in which they can strengthen their charter school laws and policies to support integration and prevent segregation in charter schools. No single state has all ten of the policies supporting integration that we identified in place, and states on average have less than half of the policies in place.
- Charter school leaders and authorizers should seize untapped potential for using the charter school model as a tool to promote regional integration. In an analysis of racial integration in the five counties with the largest charter enrollments in each state, no state showed charter schools increasing racial integration in all of those counties, and more than one-third of states did not show charter schools having a positive effect in any of those same counties.
- States with relatively strong charter school policies supporting integration but low levels of charter school integration across counties should evaluate how better enforcement of current policies—or different practices on the part of charter school leaders and authorizers—could increase integration in the state. These states include Delaware, Connecticut, the District of Columbia, Louisiana, and Massachusetts, among others.
Conclusion
At its heart, the charter school model is about granting flexibility in exchange for accountability. When it comes to policies supporting integration, work is needed on both sides of that equation: charter schools need more flexibility in some areas and more accountability in others. The ability to use weighted lotteries to promote integration, to enroll students from multiple districts, and to locate in diverse areas are important tools for allowing charter schools to create models that can draw and serve diverse student populations. At the same time, ensuring fair and open admissions, requiring transportation and meal supports, and implementing an authorizing process that considers the impact of a school’s proposed or actual enrollment on school integration are necessary guardrails for charter schools.
The analysis in this report makes clear that all states are currently falling short in support for integration in charter schools. The accompanying state profiles outline numerous ways that each state can improve its charter policies to give charter schools the flexibility and accountability needed to make them better tools for advancing racial and socioeconomic integration. This report also makes clear that enacting such policies is only part of what is needed; enforcement, school-level policies, and the constellation of other community and educational factors that impact segregation in public schools are also essential.
However it is done, moving the needle on segregation in public schools, both charter and district, is essential work for every state—and the nation as a whole. Study after study establishes that diversity makes people smarter:49 Students educated in racially and socioeconomically integrated settings show stronger test scores and graduation rates, increased college enrollment, and improved critical thinking skills.50 Unlocking these benefits begins with creating schools with diverse enrollment across race, socioeconomic status, language, disability, and other characteristics—but it does not end there. The student advocacy group IntegrateNYC provides a useful framework for understanding “real integration” as comprised of the “Five R’s”: not just achieving diverse racial demographics in enrollment, but also ensuring fair resource allocations among and within schools, building strong relationships among students and staff within a school, reforming school discipline through a lens of restorative justice, and hiring teachers and staff that represent the diversity of the study body.51 Those are benefits that all public schools—district and charter—should strive to provide.
Acknowledgments
The authors would like Mike Cassidy for his extensive help collecting and analyzing data on school enrollment for this report and Samantha Washington for her research assistance. They would also like to express gratitude to the many colleagues who provided feedback during various points in the research process, including Amanda Meyer and James Liebman at the Center for Public Research and Leadership at Columbia Law School; Christina Collins, Alison Gendar, and Dick Riley at the United Federation of Teachers; David Frank at the New York State Education Department’s Charter School Office; David Tipson and Matt Gonzales at New York Appleseed; Dirk Tillotson at Great School Choices, Inc.; Erica Frankenberg at Pennsylvania State University; Genevieve Siegel-Hawley at Virginia Commonwealth University; Jon Rosenberg at Hebrew Public; Joshua Starr at PDK International; Julie Mead at the University of Wisconsin-Madison; Kriste Dragon at Citizens of the World Charter Schools; Leo Casey, Matthew Di Carlo, Esther Quintero, and Burnie Bond at the Albert Shanker Institute; Matt Walker at Teach For America; Michael Magee at Chiefs for Change; Neil Campbell at the Center for American Progress; Preston Green at the University of Connecticut; Renita Thukral, Christy Wolfe, Robert Reed, and Todd Ziebarth at the National Alliance for Public Charter Schools; Ricardo Soto at the California Charter Schools Association; Scott Pearson at the DC Public Charter School Board; Sonia Park and Elsa Duré at the Diverse Charter Schools Coalition; Valerie Braimah at City Charter Schools; Verone Kennedy and Jennifer Nagourney at the New York City Department of Education, Office of Charter School Partnership and Authorization; and Veronica Brooks-Uy and Amanda Fenton at the National Association of Charter School Authorizers. Finally, they are grateful for the many hours spent by reviewers in the states, including individuals at state education departments and state charter associations or advocacy organizations, answering questions and providing feedback on drafts of the state profiles.
Notes
- Amy Stuart Wells, Lauren Fox, and Diana Cordova-Cobo, “How Racially Diverse Schools and Classrooms Can Benefit All Students,” The Century Foundation, February 9, 2016, https://tcf.org/content/report/how-racially-diverse-schools-and-classrooms-can-benefit-all-students/.
- School Structure Committee, “Chartered Schools = Choices for Educators + Quality for All Students, Minneapolis,” Citizens League, November 17, 1988, https://citizensleague.org/wp-content/uploads/2017/07/PolicyReportEducationNov-1988.pdf, 15.
- Richard D. Kahlenberg and Halley Potter, A Smarter Charter: Finding What Works for Charter Schools and Public Education (New York: Teachers College Press, 2014), 11–14; and Laws of Minnesota 1991, chapter 265, article 9, section 3, https://www.revisor.mn.gov/laws/1991/0/265/.
- Josh Verges, “MN Supreme Court: parents’ Lawsuit Accusing State of Racially Segregating Students Can Proceed,” TwinCities.com Pioneer Press, July 25, 2018, https://www.twincities.com/2018/07/25/mn-supreme-court-parents-lawsuit-accusing-state-of-racially-segregating-students-can-proceed/.
- Gary Orfield and Erica Frankenberg, “Brown at 60: Great Progress, a Long Retreat and an Uncertain Future,” The Civil Rights Project, University of California–Berkeley, May 15, 2014, http://civilrightsproject.ucla.edu/research/k-12-education/integration-and-diversity/brown-at-60-great-progress-a-long-retreat-and-an-uncertain-future/Brown-at-60-051814.pdf.
- Rebecca David and Kevin Hesla, “Estimated Public Charter School Enrollment, 2017–2018,” national Alliance for Public Charter Schools, March 2018, https://www.publiccharters.org/sites/default/files/documents/2018-03/FINAL%20Estimated%20Public%20Charter%20School%20Enrollment%2C%202017-18.pdf; and “Table 203.10. Enrollment in Public Elementary and Secondary Schools, by Level and Grade: Selected year, Fall 1980 through Fall 2027,” Digest of Education Statistics 2017, National Center for Education Statistics, December 2017, https://nces.ed.gov/programs/digest/d17/tables/dt17_203.10.asp.
- Halley Potter, “Updated Inventory of Socioeconomic Integration Policies: Fall 2016,” The Century Foundation, October 14, 2016, https://tcf.org/content/commentary/updated-inventory-socioeconomic-integration-policies-fall-2016/.
- For more information on equity issues facing students with disabilities and English language learners in charter schools, see, e.g., National Center for Special Education in Charter Schools, http://www.ncsecs.org/, and Julie F. Mead and Preston Green, “Advancing Intentional Equity in Charter Schools,” The Century Foundation, March 7, 2019, https://tcf.org/content/report/advancing-intentional-equity-charter-schools/; Carolyn Sattin-Bajaj, Unaccompanied Minors: Immigrant Youth, School Choice, and the Pursuit of Equity (Cambridge: Harvard Education Press, 2014); Madeline Mavrogordato and Marc Stein, “Accessing Choice: A Mixed-Methods Examination of How Latino Parents Engage in the Educational Marketplace,” Urban Education 51, no. 9 (November 2016), https://doi.org/10.1177/0042085914553674; Madeline Mavrogordato and Julie Harris, “Eligiendo Escuelas: English Learners and Access to School Choice,” Educational Policy 31, no. 6 (2017), https://doi.org/10.1177/089590481772422.
- Sarah D. Sparks, “Student Mobility: How It Affects Learning,” Education Week, August 11, 2016, https://www.edweek.org/ew/issues/student-mobility/index.html.
- Julie F. Mead and Preston Green, “Advancing Intentional Equity in Charter Schools,” The Century Foundation, March 7, 2019, https://tcf.org/content/report/advancing-intentional-equity-charter-schools/.
- Hilary Hammell, “Charging for Access: How California Charter Schools Exclude Vulnerable Students by Imposing Illegal Family Work Quotas,” Public Advocates, 2014, https://www.publicadvocates.org/our-work/education/access-quality-education/charter-schools/forced-parent-work-policies/.
- Arianna Prothero, “California to Charter Schools: Drop parent Volunteering Requirements,” Education Week, February 2, 2015, http://blogs.edweek.org/edweek/charterschoice/2015/02/california_to_charter_schools_parent_volunteering_requirements_are_illegal.html.
- “What AB 1360 Means for Your Charter Petition & School Policies,” California Charter Schools Association, November 6, 2017, http://library.ccsa.org/blog/2017/11/what-ab-1360-means-for-your-charter-petition-school-policies-1.html.
- “Backfilling in Charter Public Schools,” National Alliance for Public Charter Schools, May 2016, https://cdn2.hubspot.net/hubfs/560116/x%20GEN%20Storage/BackfillingRelease_5102016.pdf.
- Paul Jargowsky, “Architecture of segregation: Civil Unrest, the Concentration of Poverty, and Public Policy,” The Century Foundation, August 7, 2015, https://tcf.org/content/report/architecture-of-segregation/; and Richard Rothstein, The Color of Law: A Forgotten History of How Our government Segregated America (New York: Liveright Publishing Corporation, 2017).
- “Characteristics of Traditional Public Schools and Public Charter Schools,” National Center for Education Statistics, April 2018, https://nces.ed.gov/programs/coe/indicator_cla.asp.
- “Charter School Options for School Nutrition Program Participation,” Colorado Department of Education, n.d., https://c.ymcdn.com/sites/coloradoleague.site-ym.com/resource/resmgr/Files-BOPNewsltr/SchoolNutritionProgramOption.pdf.
- See, e.g., Joshua D. Angrist, Parag A. Pathak, and Christopher R. Walters, “Explaining Charter School Effectiveness,” American Economic Journal: Applied Economics 5, no. 4 (2012): 1–27, https://economics.mit.edu/files/9102; and Danielle Dreilinger, “Special Education Shortcomings Founda at New Orleans Schools,” NOLA.com, December 21, 2016, https://www.nola.com/education/2016/12/special_education_monitor_nola.html.
- “Discipline Disparities for Black Students, Boys, and Students with Disabilities,” United States Government Accountability Office, March 2018, https://www.gao.gov/assets/700/690828.pdf.
- Julie F. Mead and Preston Green, “Advancing Intentional Equity in Charter Schools,” The Century Foundation, March 7, 2019, https://tcf.org/content/report/advancing-intentional-equity-charter-schools/.
- For information on “set-aside” admissions plans, see “New York Appleseed Statement on Set-Aside Admissions Plans for Individual Schools,” New York Appleseed, n.d., https://www.nyappleseed.org/new-york-appleseed-statement-set-aside-admissions-plans-individual-schools/.
- For more information on weighted lotteries and other strategies for diverse enrollment, see Halley Potter, “Recruiting and Enrolling a Diverse Student Body in Public Choice Schools,” The Century Foundation, January 29, 2019, https://tcf.org/content/report/recruiting-enrolling-diverse-student-body-public-choice-schools/.
- Conor Williams, “Improving Equitable Access to Dual Language Immersion Charter Schools in Washington, D.C.,” The Century Foundation, January 23, 2019, https://tcf.org/content/commentary/improving-equitable-access-dual-language-immersion-charter-schools-washington-d-c/.
- See also Lauren E. Baum, “State Laws on Weighted Lotteries and Enrollment Practices,” National Alliance for Public Charter Schools, 2015, http://www.publiccharters.org/sites/default/files/migrated/wp-content/uploads/2015/06/NPC035_WeightedLotteries_Digital_rev.pdf. Note, however, that in the time since the publication of the National Alliance for Public Charter Schools’ report, several states have changed their laws with respect to weighted lotteries, and federal policy on weighted lotteries in charter schools has changed as well. See “P.L. 114-95, The Every Student Succeeds Act (ESSA),” National Alliance for Public Charter Schools, January 19, 2016, 3, http://www.publiccharters.org/sites/default/files/migrated/wp-content/uploads/2016/01/NAPCS-ESSA-CSP-Summary-and-Background-1-19-16.pdf.
- Halley Potter, “Updated Inventory of Socioeconomic Integration Policies: Fall 2016,” The Century Foundation, October 14, 2016, https://tcf.org/content/commentary/updated-inventory-socioeconomic-integration-policies-fall-2016/.
- Kris Nordstrom, “Stymied by Segregation: How Integration Can transform North Carolina Schools and the Lives of Its Students,” North Carolina Justice Center, 2018, https://www.ncjustice.org/wp-content/uploads/2018/11/STYMIED-BY-SEGREGATION-Integration-can-Transform-NC-FINAL-web.pdf.
- Kevin Hesla, “Unified Enrollment: Lessons Learned from Across the Country,” National Alliance for Public Charter Schools, September, 2018, https://www.publiccharters.org/sites/default/files/documents/2018-09/rd3_unified_enrollment_web.pdf; and Betheny Gross and Christine Campbell, “A Guide to Unifying Enrollment: The What, Why, and How for Those Considering It,” Center on Reinventing Public Education, May 2017, https://www.crpe.org/publications/unifying-enrollment-guide.
- CT Gen. Stat. § 10-66bb (c).
- CT Gen. Stat. §10-66bb(h) (1)(C).
- RI Gen. Laws § 16-77.2-2(10), 16-77.3-2(10), 16-77.4-2(10); “Rhode Island Charter Public Schools: Lottery & Enrollment Guidance,” Rhode Island Department of Education, http://www.ride.ri.gov/Portals/0/Uploads/Documents/Students-and-Families-Great-Schools/Charter-Schools/RIDE%20Lottery%20and%20Enrollment%20Guidance%20FINAL%20MERGED.pdf (accessed February 5, 2019); and “Charter School Performance Review System: A Guide for the Charter School Community,” Rhode Island Department of Education, September, 2018, http://www.ride.ri.gov/Portals/0/Uploads/Documents/Students-and-Families-Great-Schools/Charter-Schools/Accountability/Charter_Performance_Review_System_Handbook.pdf.
- “Questions and Answers about Charter Schools,” Alaska Department of Education and Early Development, https://education.alaska.gov/alaskan_schools/charter/pdf/faqs.pdf (accessed January 29, 2019).
- LA Rev. Stat. §§ 17: 1960, 3991, 3996; 28 LA Adm. Code, Bulletin 126, § 515.
- Written Decision, Advocates for Children v. The New York City Department of Education (NYCDOE) and Success Academy Charter Schools, Received December 4, 2018, https://www.advocatesforchildren.org/sites/default/files/on_page/success_complaint_nysed_decision.pdf?pt=1.
- Julie F. Mead and Preston C. Green, “Chartering Equity: Using Charter School Legislation and Policy to Advance Equal Educational Opportunity,” National Education Policy Center, 2012, http://nepc.colorado.edu/publication/chartering-equity.
- Alabama and Wyoming were not included in the enrollment analysis, even though they were included in the policy analysis, because neither had charter school enrollment data available in the federal Common Core of Data for 2015–16 (the most recent year available at the time of the analysis). Alabama had no charter schools open in 2015–16, and Wyoming is missing charter school enrollment data for 2015–16. The Common Core of Data uses racial categories that exclude persons of Hispanic ethnicity.
- Charles T. Clotfelter, After Brown: The Rise and Retreat of School Desegregation (Princeton, N.J.: Princeton University Press, 2004), table 2.4
- The thirteen states that primarily have countywide school districts are Alabama, Florida, Georgia, Kentucky, Louisiana, Maryland, Mississippi, Nevada, North Carolina, South Carolina, Tennessee, Virginia, and West Virginia. The rest of the states have multiple districts per county, with the exception of Hawaii and the District of Columbia, which each have just one school district. Thoma A. DeLuca, “Do Countywide LEAs Allocate Expenditures Differently from Community-centric LEAs? Evidence from National Center for Education Statistics Common Core Data,” Journal of Education Finance 40, no 3 (2015), 222–52, https://www.jstor.org/stable/2445948.1
- “How Many Counties Are There in the United States?” U.S. Geological Survey, n.d., https://www.usgs.gov/faqs/how-many-counties-are-there-united-states.
- “Table 98. Number of Public School Districts and Public and Private Elementary and Secondary Schools: Selected Years, 1869–70 through 2010–11,” Digest of Education Statistics 2012, National Center for Education Statistics, November 2012, https://nces.ed.gov/programs/digest/d12/tables/dt12_098.asp.
- 2010 U.S. Census Data, retrieved from https://www.census.gov/library/publications/2011/compendia/usa-counties-2011.html#LND.
- School District Geography and Geographic Size,” ProximityOne, January 2019, http://proximityone.com/schooldistrict_size.htm#table.
- Rachel M. Cohen, “New Jersey Is Getting Sued Over School Segregation,” CityLab, January 3, 2019, https://www.citylab.com/equity/2019/01/new-jersey-school-segregation-lawsuit-brown-v-board-housing/579373/.
- Genevieve Siegel-Hawley and Erica Frankenberg, “Does Law Influence Charter School Diversity? An Analysis of Federal and State Legislation,” Michigan Journal of Race and Law 16, no. 2 (2011): 321–76, https://heinonline.org/HOL/Page?handle=hein.journals/mjrl16&div=13&g_sent=1&casa_token=.
- Robin Lake, “Charter School Quality: Policy Matters, but So Does Implementation,” Center on Reinventing Public Education, June 10, 2014, https://www.crpe.org/thelens/charter-school-quality-policy-matters-so-does-implementation.
- Julie F. Mead and Preston Green, “Advancing Intentional Equity in Charter Schools,” The Century Foundation, March 7, 2019, https://tcf.org/content/report/advancing-intentional-equity-charter-schools/.
- For a comparison of segregation across states, see, e.g., Gary Orfield, Jongyeon Ee, Erica Frankenberg, and Genevieve Siegel-Hawley, “Brown at 62: School Segregation by Race, Poverty and State,” The Civil Rights Project/Proyecto Derechos Civiles, University of California–Los Angeles, May 16, 2016, https://www.civilrightsproject.ucla.edu/research/k-12-education/integration-and-diversity/brown-at-62-school-segregation-by-race-poverty-and-state.
- Gary Orfield, Jongyeon Ee, Erica Frankenberg, and Genevieve Siegel-Hawley, “Brown at 62: Schol Segregation by Race, Poverty and State,” The Civil Rights Project/Proyecto Derechos Civiles, University of California–Los Angeles, May 16, 2016, https://www.civilrightsproject.ucla.edu/research/k-12-education/integration-and-diversity/brown-at-62-school-segregation-by-race-poverty-and-state
- Arianna Prothero, “California to Charter Schools: Drop parent Volunteering Requirements,” Education Week, February 2, 2015, http://blogs.edweek.org/edweek/charterschoice/2015/02/california_to_charter_schools_parent_volunteering_requirements_are_illegal.html.
- K. Phillips, “How Diversity Makes Us Smarter,” Scientific American 311, no. 4 (October 2014), http://www.scientificamerican.com/article/how-diversity-makes-us-smarter/.
- “The Benefits of Socioeconomically and Racially Integrated Schools and Classrooms,” The Century Foundation, February 10, 2016, https://tcf.org/content/facts/the-benefits-of-socioeconomically-and-racially-integrated-schools-and-classrooms/.
- “Real Integration,” IntegrateNYC, https://www.integratenyc.org/realintegration (accessed March 19, 2019).