Integrated schools and classrooms help all students thrive in a diverse world. But creating more opportunities for integration requires first diagnosing the problem by understanding the different levels and causes of school segregation in communities across the country.
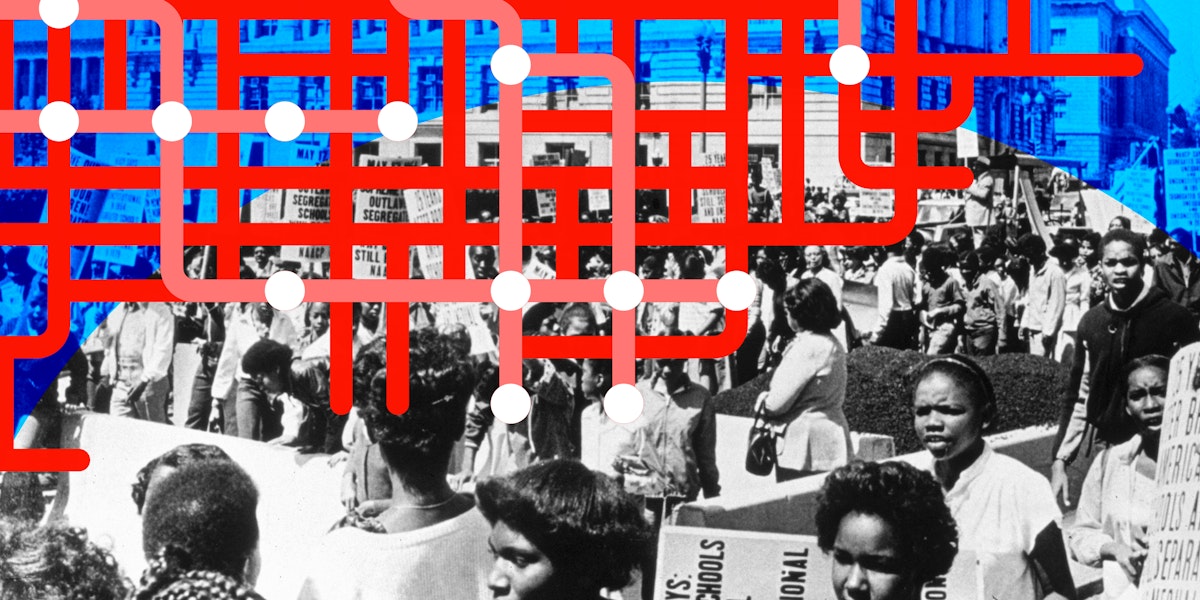
When the U.S. Supreme Court handed down its decision in Brown v. Board of Education in 1954, the demographics of American schoolchildren and the composition of our schools looked dramatically different than they do today. At that time, the school-age population was roughly 85 percent White, 12 percent Black, and less than 4 percent other races (including people of both Hispanic and non-Hispanic origin in these categories).1 These students were harshly segregated, particularly in the South, where essentially all Black students attended all-Black schools.2 The driver of this racial isolation was de jure segregation, official policies separating students by race.
Today, America’s school-age population is much more diverse: 48 percent White, 27 percent Hispanic, 15 percent Black, 6 percent Asian, 1 percent American Indian, and 4 percent multiracial.3 However, this diversity still doesn’t always translate into integration. The de facto separation of students by race continues to be commonplace. As of the 2018–19 school year, one in six public school students attended schools where over 90 percent of their peers had their same racial background (that is, for example, a White student attended a school that is over 90 percent White, or an Asian student attended a school that is over 90 percent Asian); 19 percent of White students, 15 percent of Black students, 17 percent of Hispanic students, 13 percent of American Indian students, and 0.5 percent of Asian students fell into this category, experiencing very little racial diversity in their schools.4
American schools today are also highly segregated by economic status. Racial redlining of neighborhoods has been replaced with exclusionary zoning policies that keep low-income families out of certain communities.5 Housing markets are heavily impacted by school district boundaries and attendance zones. And school choice policies create an uneven playing field for families of different socioeconomic means trying to access different schools.
The causes of both racial and economic segregation are also more complex than they were in 1954. Although de jure segregation has ended, a number of population changes and educational trends over the past six decades have contributed to changing school compositions, including the creation of new private schools; demographic shifts across school district lines and within them, driven by migration, immigration, and population growth; redrawing school attendance boundaries; and the rise of school choice policies.
The increasing diversity of the American school population as well as the variety of factors contributing to school segregation today call for data to understand how these complicated dynamics interact and play out in our nation’s classrooms. To that end, The Century Foundation (TCF) has partnered with the Segregation Index, led by Ann Owens, associate professor in the Department of Sociology at the University of Southern California, and Sean F. Reardon, professor of poverty and inequality in education and professor (by courtesy) of sociology at Stanford University, to create a first-of-its-kind school segregation data dashboard, “School Segregation in Cities Across America Mapped,” for public and private schools in every metro area in the country.6 We have visualized the findings in an interactive map, available here, which also provides information about data sources and methodology. The analysis is based on federal data from the Private School Universe Survey (PSS) and the corresponding Common Core of Data (CCD) for the 2017–18 school year (the most recent year for which both are available),7 and includes:
- racial segregation measures for public and private schools, comparing enrollment of different racial/ethnic groups, including White, Black, Hispanic, Asian, and American Indian students;
- economic segregation measures for public schools based on free- and reduced-price lunch eligibility;
- a breakdown of the different factors driving segregation in each metro area; and
- measures of exposure to poverty in public schools for different racial groups.
The data and analysis done for this project provide valuable insights into national trends as well as local context for school integration. The school segregation data dashboard is designed as a tool for policy leaders, advocates, community members, and researchers across the country to understand their local contexts and compare with other places. This report summarizes some of the key findings.
Levels of Segregation across U.S. Metro Areas
The data set used for this report includes measures of segregation by race/ethnicity and segregation by income using what is known as the variance ratio segregation index (also known as eta-squared, the normalized exposure index, or the relative diversity index).8 The variance ratio is an evenness index that measures the difference between two groups in their exposure to students from one of the groups (ignoring the existence of all other groups). The values of the index can range from 0 to 1. If segregation were 0, every school would have the same racial composition—there would be no difference, for example, in the percentage of Black students in the average White student’s school versus in the average Black student’s school. If segregation were 1, it would mean both groups were totally isolated—White students and Black students would be enrolled in completely separate schools. The index can also be interpreted in proportional terms: if segregation were 0.7, it would mean that schools are 70 percent as segregated as they could possibly be.
What follows are key findings resulting from the calculations for and analysis of this variance ratio segregation index.
More than six decades after Brown v. Board, high levels of racial and economic segregation persist in schools across metro areas.
The data calculations made for this report show that the average level of segregation between White and non-White students in all schools (public and private) across all 403 metro areas in the country is 0.21. That value is equivalent to a 21-point difference between the percentage of White students at the average White student’s school and the percentage of White students at the average non-White student’s school. For example, in a metro area where the average White student attends a school that is 61 percent White and 39 percent non-White, that 21-point difference means the average non-White student in that metro area attends a school that is 40 percent White and 60 percent non-White (that is, the difference between 61 percent White at the first school and 40 White and the second school is 21 points, and the difference between 39 percent non-White at the first school and 60 percent non-White at the second school is also 21 points).
TCF’s school segregation data dashboard provides a map that visualizes the variation in levels of segregation in each metro area. Users may look up the level of non-White–White segregation (and other types of segregation by race/ethnicity) for any metro to see how segregation in that metro area compares to the average across areas or to other metro areas.
Black–White segregation is especially high in metro areas.
The average Black–White segregation across all metro areas is 0.24, whereas Hispanic–White segregation is 0.18, Asian–White is 0.09, and American Indian–White is 0.05. Among those metro areas with the most students in each non-White group (that is, the 100 metro areas with most Black students, 100 metro areas with most Hispanic students, and so on), the levels of segregation for each of these measures is considerably higher. (See Figure 1.)
Figure 1
Looking at the number of metro areas where segregation is especially high reveals a similar pattern. Out of 403 metro areas, there are thirty-nine (nearly 10 percent) in which Black–White segregation is over 0.5—meaning the equivalent of a 50-point difference between the racial composition of the average Black student’s school as compared to the average White student’s school. With a variance ratio of 0.5, that means in a metro area where the average Black student’s school is 75 percent Black, the average White student’s school would be just 25 percent Black. Only seven metro areas have similarly high Hispanic–White segregation, just four have such high levels of American Indian–White segregation, and none have equivalently high levels of Asian–White segregation.
Metro areas also have high levels of economic segregation.
The data analyzed for this report also include measures of economic segregation across all public schools in each metro area, based on data on student eligibility for free or reduced-price lunch (FRL; note that there is no free or reduced-price lunch eligibility data available for private schools). Segregation between students who are eligible for FRL (those from families earning up to 185 percent of the federal poverty line) and students who are not eligible is an average of 0.19 across all metro areas. That means that the difference in FRL rate in the average low-income (FRL-eligible) versus non-low-income student’s school is 19 percentage points—the equivalent, for example, of a metro in which the average low-income student’s school is 70 percent low-income while the average non-low-income student’s school is just 51 percent low-income. Focusing just on the 100 metro areas that enroll the largest numbers of FRL-eligible students, the average segregation rises to 0.28.
TCF’s school segregation data dashboard allows users to look up segregation between FRL-eligible and non-eligible students, as well as segregation between students eligible for free lunch only versus those not eligible, for any metro area.
These statistics show that both racial and economic segregation remain formidable challenges. Furthermore, our data on exposure to poverty by race/ethnicity shows how racial and economic segregation are intersecting and compounding phenomena.
Students of color have higher average rates of poverty in their schools than White students.
White students on average attend schools with much lower poverty rates than students of other races/ethnicities. Across all metro areas, the FRL rate is 16 percentage points higher in the average Black student’s school than the average White student’s school in the same metro. Hispanic students on average attend schools where FRL rates are 14 percentage points higher than their White counterparts, American Indian students experience an average of 8 percentage points higher, and Asian students attend schools that are 1 percentage point higher, on average. (See Figure 2.)
Figure 2
School segregation is most extreme in the Northeast.
Looking across the four main regions—Midwest, Northeast, South, and West—the Northeast has the highest levels of non-White–White and FRL–non-FRL segregation, as well as the highest levels of Black–White, Hispanic–White, and Asian–White segregation. (See Figure 3.) American Indian–White segregation is highest in the West.
The interactive map in TCF’s school segregation data dashboard provides visuals of these regional patterns.
Figure 3
Factors Contributing to Segregation
While the total levels of segregation in metro areas shown above are alarming, those measurements do not explain why such high levels of segregation exist; that is, the variance ratio segregation index on its own doesn’t show what factors are contributing to such high levels of segregation between schools and between districts. Helpfully, the total racial segregation in a metro area as measured by the variance ratio segregation index can be decomposed into a series of factors that together total 100 percent of segregation (when weighted by each component’s size and diversity). (See Figure 4.)
Figure 4
One way to group these factors is into four main categories; that is, the total segregation in a metro area can be the sum of the following factors (as visualized by the blue shapes in Figure 4):
- Segregation between private schools. This component may be larger, for example, in a metro area where many students attend private schools and where there are stark differences in the racial composition of those schools—such as having predominantly Black private schools as well as predominantly White private schools.
- Segregation between public and private schools. This component may be larger, for example, if many students in the metro attend private schools and the racial or economic composition of private school students differs markedly from that of public school students—such as in an area in which private schools opened to serve White students fleeing public schools during desegregation.
- Segregation between public school districts. This component may be larger, for example, if there are significant differences in the demographics of different school districts in the same metro area–such as in a metro that is divided into many smaller school districts with urban districts serving more students of color and suburban districts mainly enrolling White students.
- Segregation between schools, within public school districts. This component may be larger, for example, in a geographically expansive school district with traditional public schools that reflect high levels of neighborhood segregation and thus have markedly different student demographics.
Looking at what proportion of the total segregation is due to each of these factors helps paint a clearer picture of the conditions and policies that are driving school segregation nationwide and in individual metro areas. Users may look up any metro area on the School Segregation Data Dashboard to see the breakdown of segregation factors in that metro, providing a helpful diagnostic tool for understanding root causes of school segregation in that area.
Nationwide, the biggest factor contributing to racial school segregation, by far, is segregation between public school districts.
On average across the 403 metro areas, more than half (54 percent) of the total non-White–White segregation is due to segregation between public school districts. (See Table 1.) In more than two-thirds of all metro areas (280 out of 403), segregation between districts is the largest component of non-White–White segregation.
Table 1
| Components of Non-White–White Segregation in U.S. Metro Areas, as Percentage of Total, by Region | ||||
| Between Private Schools | Between Public and Private Schools | Between Public Districts | Within Public Districts | |
| Midwest | 6% | 3% | 69% | 22% |
| Northeast | 7% | 3% | 76% | 14% |
| South | 5% | 8% | 41% | 46% |
| West | 6% | 7% | 45% | 42% |
| All Regions | 6% | 6% | 54% | 35% |
|
Source: Authors’ calculations based on federal data from 2017–18 Private School Universe Survey (PSS) and Common Core of Data (CCD). |
||||
For economic school segregation, within-district differences are a bigger factor.
Because there is no student economic data for private schools, the decomposition of economic segregation in our data is confined to segregation between public districts and segregation within public districts. Within-district segregation is a bigger driver of economic segregation nationwide, accounting for an average of 57 percent of the segregation between FRL and non-FRL students. (See Table 2.) The 403 metro areas are roughly split as to whether within-district segregation (209 metro areas) or between-district segregation (194 metro areas) is the bigger factor.
Table 2.
|
Components of FRL–Non-FRL Segregation in U.S. Metro Areas, as Percentage of Total, by Region |
||
| Between Public Districts | Within Public Districts | |
| Midwest | 58% | 42% |
| Northeast | 73% | 27% |
| South | 25% | 75% |
| West | 39% | 61% |
| All Regions | 43% | 57% |
|
Source: Authors’ calculations based on federal data from 2017–18 Private School Universe Survey (PSS) and Common Core of Data (CCD). |
||
These patterns, however, vary considerably by region.
Segregation between districts is a much larger factor in the Northeast and Midwest.
Between-district segregation makes up a whopping 76 percent of non-White–White segregation and 73 percent of FRL–non-FRL segregation in the Northeast, and the proportions for the Midwest are not far behind (see Tables 1 and 2).
Segregation within districts is a bigger factor in the South and West.
Within-district differences make up 75 percent of the FRL–non-FRL segregation in the South and 61 percent in the West. Within-district segregation is also the leading factor in non-White–White segregation in the South, whereas in the West, within-district segregation is nearly equal to between-district segregation (42 percent versus 45 percent) as a driver of non-White–White segregation.
These statistics reflect the impact of the different policies and practices surrounding school district boundaries in different regions across the country. Most states have multiple school districts per county, often resulting in having many smaller districts as well as high levels of segregation across districts that reflect residential segregation in the metro area. This is particularly true in the Northeast. Long Island, beyond the boundary of New York City, for example, has just two counties, which are divided into over 120 school districts, most of which serve small geographic areas and just a few thousand students. The result is that some of these school districts have almost all White enrollment and others serve almost entirely students of color.9 Schools within these districts tend to be demographically similar to each other, but between-district segregation is high.
By contrast, thirteen states, which are located mostly in the South, have countywide school districts in all or most counties.10 This arrangement tends to result in fewer school districts per metro area, more racial and economic diversity within districts, and more similarity in the demographics of neighboring districts. However, there may be large differences between public schools within these districts, reflecting neighborhood segregation or school choice policies.
Private school segregation is a relatively small contributor to racial school segregation nationwide.
Roughly 10 percent of all K–12 students attend private schools.11 Segregation between private schools and segregation between public and private schools together make up just 12 percent of non-White–White segregation in U.S. metro areas, on average. There are, however, some metro areas where private school segregation is significant and even the largest factor driving racial segregation. In the Sumter, South Carolina metro area, for example, segregation between public and private schools makes up 59 percent of all non-White–White segregation. Private school segregation is highest on average across metro areas in the South more generally, reflecting the history of the rise of private schools as part of White resistance to desegregation.
Charter school segregation is a relatively small contributor to racial and economic school segregation nationwide.
There has been much attention given in the media and in education research to the effect that charter schools, which enroll about 7 percent of all public school students,12 have on school segregation. However, in the context of all factors driving school segregation, their contribution is small. Segregation between charter schools within a district and segregation between public sectors (charter, traditional public, and magnet) within a district together account for only 6 percent of total FRL–non-FRL school segregation and 4 percent of non-White–White segregation, on average, across U.S. metro areas. Looking only at the 100 metro areas with the most charter schools, this rises slightly to an average of 9 percent of total FRL–non-FRLsegregation and 7 percent of non-White–White segregation.
It is worth noting, however, that the data in this analysis is from 2017–18, before the COVID-19 pandemic. A potential uptick in enrollment in private schools and charter schools nationwide resulting from the pandemic may shift some of these patterns in the future.
Metro Areas with the Most Extreme Segregation
Zooming in to look past the national and regional averages, there is considerable variation in segregation patterns among U.S. metro areas, including some that are extreme outliers. Table 3 lists the ten metro areas with the most extreme racial and economic segregation of different types.
Table 3
|
The Ten Metro Areas with the Most Extreme Segregation, by Type of Segregation |
|||||||||||
| Non-White–White Segregation Metro Area, Variance Ratio | Black–White Segregation Metro Area, Variance Ratio |
Hispanic–White Segregation Metro Area, Variance Ratio |
Asian–White Segregation Metro Area, Variance Ratio |
American Indian–White Segregation Metro Area, Variance Ratio |
FRL–Non-FRL Segregation* Metro Area, Variance Ratio |
||||||
| 1. Detroit–Dearborn–Livonia, MI | 0.54 | 1. Milwaukee–Waukesha, WI | 0.73 | 1. Philadelphia, PA | 0.59 | 1. Napa, CA | 0.48 | 1. El Centro, CA | 0.89 | 1.Newark, NJ–PA | 0.49 |
| 2. Monroe, LA | 0.53 | 2. Newark, NJ–PA | 0.71 | 2. Reading, PA | 0.58 | 2. New York–Jersey City–White Plains, NY–NJ | 0.43 | 2. Yakima, WA | 0.70 | 2. Bridgeport–Stamford–Norwalk, CT | 0.47 |
| 3. Milwaukee–Waukesha, WI | 0.50 | 3. Chicago–Naperville–Evanston, IL | 0.70 | 3. Boston, MA | 0.56 | 3. Los Angeles–Long Beach–Glendale, CA | 0.39 | 3. Lewiston, ID–WA | 0.62 | 3. Milwaukee–Waukesha, WI | 0.46 |
| 4. Philadelphia, PA | 0.49 | 4. Detroit–Dearborn–Livonia, MI | 0.70 | 4. New York–Jersey City–White Plains, NY–NJ | 0.55 | 4. New Brunswick–Lakewood, NJ | 0.39 | 4. Charleston–North Charleston, SC | 0.53 | 4. Trenton–Princeton, NJ | 0.44 |
| 5. Cleveland–Elyria, OH | 0.49 | 5.New York–Jersey City–White Plains, NY–NJ | 0.69 | 5. Newark, NJ–PA | 0.54 | 5. Amarillo, TX | 0.38 | 5. Tucson, AZ | 0.49 | 5. Chicago–Naperville–Evanston, IL | 0.44 |
| 6. Reading, PA | 0.48 | 6. Cleveland–Elyria, OH | 0.68 | 6. Memphis, TN–MS–AR | 0.52 | 6. San Francisco–San Mateo–Redwood City, CA | 0.37 | 6. Flagstaff, AZ | 0.46 | 6. Boston, MA | 0.42 |
| 7. Beaumont–Port Arthur, TX | 0.48 | 7. Beaumont–Port Arthur, TX | 0.67 | 7. Springfield, MA | 0.52 | 7. Minneapolis–St. Paul–Bloomington, MN–WI | 0.36 | 7. New York–Jersey City–White Plains, NY–NJ | 0.45 | 7. Denver–Aurora–Lakewood, CO | 0.38 |
| 8. Jackson, MS | 0.48 | 8.Gary, IN | 0.66 | 8. Los Angeles–Long Beach–Glendale, CA | 0.49 | 8. Oakland–Berkeley–Livermore, CA | 0.35 | 8. Lake Havasu City–Kingman, AZ | 0.36 | 8. Cambridge–Newton–Framingham, MA | 0.38 |
| 9. Baton Rouge, LA | 0.48 | 9. Philadelphia, PA | 0.64 | 9. Milwaukee–Waukesha, WI | 0.49 | 9. San Jose–Sunnyvale–Santa Clara, CA | 0.34 | 9. Fort Smith, AR–OK | 0.35 | 9. Reno, NV | 0.38 |
| 10. Pine Bluff, AR | 0.47 | 10. Peoria, IL | 0.64 | 10. Chicago–Naperville–Evanston, IL | 0.49 | 10. Laredo, TX | 0.33 | 10. Albuquerque, NM | 0.34 | 10. Oakland–Berkeley–Livermore, CA | 0.37 |
| Source: Authors’ calculations based on federal data from 2017–18 Private School Universe Survey (PSS) and Common Core of Data (CCD). *Note that the FRL–non-FRL segregation measure is for public schools only, whereas racial segregation measures include all public and private schools in a metro area. |
|||||||||||
The School Segregation Data Dashboard allows users to look up the ranking of any metro area, out of the 403 total metro areas, for each measure of segregation that is included.
The Milwaukee metro area and New York metro area have especially segregated schools across many student groups.
Twelve metro areas appear on at least two of these most-segregated lists, and the Milwaukee metro area and New York metro area stand out as appearing on four out of the six lists. The Chicago metro area (Illinois), Newark metro area (New Jersey–Pennsylvania), and Philadelphia metro area (Pennsylvania) appear on three lists; and the Reading metro area (Pennsylvania), Beaumont metro area (Texas), Boston metro area (Massachusetts), Cleveland metro area (Ohio), Detroit metro area (Michigan), Oakland metro area (California), and Los Angeles metro area (California) appear on two.
The Milwaukee metro area has the highest levels of Black–White segregation, and the Philadelphia metro area has the highest levels of Hispanic–White segregation.
The Milwaukee metro area’s Black–White segregation and the Philadelphia metro area’s Hispanic–White segregation are both particularly high, closer to being completely segregated than they are to being fully integrated. Disappointingly, the metro areas that follow them on the list are pretty close to the same situation.
The Napa, California metro area has the highest levels of Asian–White segregation, and the El Centro, California metro area has the highest levels of American Indian–White segregation.
Asian–White segregation and American Indian–White segregation are less extreme on average across the 403 metro areas than Black–White or Hispanic–White segregation, and segregation across these groups of students is often left out of research and policy conversations. However, these lists demonstrate that there are still multiple metro areas in which White students and Asian students or White students and American Indian students are largely separated from each other.
The Detroit metro area has the highest levels of Non-White–White Segregation.
The overall student population in Detroit is 45 percent White and 55 percent non-White (including 40 percent Black, 8 percent Hispanic, 4 percent Asian, 0.3 percent American Indian, and 2 percent two or more races). Detroit metro area’s high level of non-White–White segregation, however, means that few schools mirror this diversity.
The Newark, New Jersey–Pennsylvania metro area has the highest levels of economic segregation (between FRL-eligible students and non-eligible students).
Notably, New Jersey is currently facing a lawsuit challenging the racial and socioeconomic segregation in the state’s schools.13
Conclusion and Policy Implications
The data and analysis for this project give a clear and alarming picture of racial and economic school segregation across the nation, by region, and within individual metro areas. The findings of this report as well as those of future researchers using the dashboard should serve as a springboard for brainstorming policy solutions and a catalyst for creating political will to act.
One critically important takeaway of this project is the pernicious role that segregation between districts plays as a driver of overall school integration, and solving for it will require conversations at all levels of government. Overall, the differences between school districts across the country are more to blame for segregation in metro areas than the imbalances within school districts. This finding is particularly problematic for policymakers because solutions to the problem of interdistrict segregation face more bureaucratic and geographic challenges than solving for other types of school segregation. When schools within a district are segregated, there are a number of actions that superintendents and school board members can take, if they can muster the political courage or popular support, to increase integration, such as by changing attendance boundaries and enrollment policies. But when school segregation is between different districts, the challenge increases significantly. District leaders cannot solve these problems on their own. Leadership typically must come from the state or federal level, or through collaborative voluntary efforts of multiple districts. Once they are established, however, interdistrict integration programs—such as the METCO program for school transfers in greater Boston, Massachusetts, and interdistrict magnet schools and open choice enrollment in greater Hartford, Connecticut—can be very effective tools for integration.
It is also important in diagnosing the problem of school segregation to pay attention to the experiences of different racial and ethnic groups, and to the separate but intersecting phenomena of economic and racial segregation. Sixty-eight years after Brown v. Board, school segregation is not simply a “Black and White” issue.
By and large, the trends revealed by this data are not new. But in education and in policy, we measure what we treasure. Being able to quantify the levels of school segregation and the contributions of different factors toward this segregation in our communities and across the country provides important context to inform policy discussions and potential fuel for engagement and action.
Notes
- Based on data for the race of 5–14 year-olds in 1950 from Health, United States, 2010, U.S. Department of Health and Human Services, Centers for Disease Control and Prevention, National Center for Health Statistics, 2010, Table 1, p. 97, https://www.cdc.gov/nchs/data/hus/hus10.pdf. Please note that this report uses the identity categories specified in the data sources consulted, such as those compiled by the U.S. Department of Education and the U.S. Census Bureau. Please note also that U.S. Census Bureau data for 1950 does not disaggregate people of Hispanic versus non-Hispanic origin, whereas in the U.S. Department of Education data sources from 2017–18 consulted elsewhere in the report, people of Hispanic origin are counted in a separate racial/ethnic category.
- Richard Rothstein, “Brown v. Board at 60: Why Have We Been So Disappointed? What Have We Learned?” Economic Policy Institute, April 17, 2014, https://www.epi.org/publication/brown-at-60-why-have-we-been-so-disappointed-what-have-we-learned/.
- Private School Universe Survey (PSS), Institute of Education Sciences, National Center for Education Statistics, 2017–18, https://nces.ed.gov/surveys/pss/; Common Core of Data, Institute of Education Sciences, National Center for Education Statistics, 2017–18, https://nces.ed.gov/ccd/.
- Author’s calculations, U.S. Department of Education, Common Core of Data, 2018–19, https://nces.ed.gov/ccd/.
- Richard Kahlenberg, “Tearing Down the Walls: How the Biden Administration and Congress Can Reduce Exclusionary Zoning,” The Century Foundation, April 18, 2021, https://tcf.org/content/report/tearing-walls-biden-administration-congress-can-reduce-exclusionary-zoning/.
- For more on the Segregation Index and its ongoing work, visit https://socialinnovation.usc.edu/segregation/.
- Private School Universe Survey (PSS), Institute of Education Sciences, National Center for Education Statistics, https://nces.ed.gov/surveys/pss/; Common Core of Data, Institute of Education Sciences, National Center for Education Statistics, https://nces.ed.gov/ccd/.
- See About the Data and Glossary sections on TCF’s interactive data dashboard, “School Segregation in Cities Across America Mapped,” for more information, available at https://tcf.org/content/data/school-segregation-in-cities-across-america-mapped/.
- “8 Key Facts about Long Island School Districts,” ERASE Racism, 2010, http://eraseracismny.org/storage/documents/education/ERASE_Racism-long-island-district-facts.pdf.
- The thirteen states that primarily have countywide school districts are Alabama, Florida, Georgia, Kentucky, Louisiana, Maryland, Mississippi, Nevada, North Carolina, South Carolina, Tennessee, Virginia, and West Virginia. The rest of the states have multiple districts per county, with the exception of Hawaii and the District of Columbia, which each have just one school district. Thoma A. DeLuca, “Do Countywide LEAs Allocate Expenditures Differently from Community-centric LEAs? Evidence from National Center for Education Statistics Common Core Data,” Journal of Education Finance 40, no 3 (2015), 222–52, https://www.jstor.org/stable/2445948.1.
- “Private School Enrollment,” Condition of Education, U.S. Department of Education, Institute of Education Sciences, National Center for Education Statistics, 2022, https://nces.ed.gov/programs/coe/indicator/cgc.
- “Public Charter School Enrollment,” Condition of Education, U.S. Department of Education, Institute of Education Sciences, National Center for Education Statistics, 2022, https://nces.ed.gov/programs/coe/indicator/cgb.
- Patrick Wall, “Does New Jersey have to desegregate its schools? A judge will soon decide,” Chalkbeat, March 3, 2022, https://newark.chalkbeat.org/2022/3/3/22960632/new-jersey-segregation-lawsuit-hearing.