
Executive Summary
Much has been written about the rise of robots and the potential impacts of automation on the economy. Yet most analysis tends to be prospective in nature, and estimates of future impacts on employment vary widely, with some studies predicting that as many as 50 percent of all workers are at risk of losing their jobs to automation. Even less is understood about the actual impacts of robots on jobs, wages, and workers today. While more recent studies have begun to measure these effects, the results here, too, are mixed.
This report analyzes the impact of robots in the years following the Great Recession, from 2009 to 2017—a period of significant, steady job growth and economic recovery, as well as one in which the use of robots in the U.S. workplace more than doubled. The report’s findings, summarized below, offer new insights that can help inform ongoing debates about the future of work and the impact of automation.
The first takeaway is that robots are, indeed, coming—but there is little evidence (yet) that robotic growth is leading to widespread job displacement, as some have predicted. That said, there are winners and losers with automation. While robots may have negligible effects on national employment as a whole, certain industries and regions are more impacted by robotic growth, and particular groups of workers disproportionately suffer the negative effects of this growth. It is also the case that job losses from robotization may have little impact on total employment, as displaced workers find other jobs (especially in a strong economy with low unemployment), even if at lower pay. Lastly, we find that the economic boom of the past decade has effectively “masked” some of the impacts that robots have had on workers. It’s not that robots weren’t displacing jobs—it’s that the overall economic expansion was large enough to offset some of these job losses.
Key Findings
1. Trends in Robot Growth
We constructed a measure of the use of robots—commonly referred to as “robot intensity”—to estimate trends in robot exposure across more than 250 metropolitan areas and over time, finding that:
- During the Great Recession, robot intensity plummeted. But since 2009, robot intensity has sharply increased nationwide.
- States in the Midwest (the East North Central, or ENC, census division)—Michigan, Ohio, Indiana, Illinois, and Wisconsin—consistently have the highest robot intensities, typically at least twice the intensity of all other regions.
- Midwest (ENC) states also experienced the sharpest growth in robots since 2009.
- Robot intensity in manufacturing industries greatly exceeds the national average:
- Since 2009, the number of manufacturing robots has more than doubled—from 0.813 per thousand workers to 1.974 per thousand workers.
- Highly unionized states have much lower robot intensities than states with low rates of unionization.
2. Impact of Robots Varies across Workers
We assess the impact of robot intensity on the employment and earnings outcomes of non-college educated men and women, finding that:
- The adoption of robots since the Great Recession has been accompanied by employment gains for some groups of workers, and appears not to have affected other groups.
- Positive impact on: young, less-educated men and less-educated adult women.
- No impact on: young, less-educated women and less-educated adult men.
- The adoption of robots since the Great Recession has been accompanied by wage increases for some groups of workers, and appears not to have adversely affected other groups.
- Positive impact on: young, less-educated women and less-educated minority men and women.
- No significant impact on: less-educated adult men and women.
- Yet, robotization has adversely affected other types of workers at the national level—for example, in manufacturing industries.
Our findings suggest that, at the current stage and pace of robot growth, and with the right economic conditions in place, some workers without a college degree may benefit from robotization. This is perhaps due to robots stimulating demand for goods, creating new markets, and spurring wage growth.
3. Impacts of Robots in the Rust Belt
Given that the Midwest has the greatest concentration of robots and the fastest robot growth (and thus is most likely to show the effects of robots), we focus in on the ENC region and examine the effects of robots on employment and wages by race/ethnicity, gender, age, and industry, finding that:
- In Midwest manufacturing industries, robots have sizably decreased employment for some groups of workers (young, less-educated men and women).
- Estimated impact: for an increase of one robot per thousand workers, the employment-to-population ratio falls by an estimated 3.5 percentage points.
- In Midwest manufacturing industries, robots have sizably decreased wages for some groups of workers (young, less-educated men and women).
- Estimated impact: an increase of one robot per thousand workers is associated with a 4.0 percent to 5.0 percent decline in wages.
- The biggest negative impact of robots was on young, less-educated black men and women—groups that already have lower wages and employment rates, on average.
Lastly, we isolate the impact of robotic growth to predict what would have happened in the region absent the economic boom that began in 2009, finding that:
- What happened (with robots and recovery): employment-to-population ratio for young, less-educated workers increases from roughly 34 percent to around 45.5 percent.
- What would have happened (with robots, no recovery): employment-to-population ratio for young, less-educated workers decreases from 34 percent to around 30 percent.
These findings demonstrate that in the Midwest: (1) the economic recovery of the last decade has effectively “masked” the impact of robots on employment—that, absent such a strong recovery, robots would have displaced many more jobs than they did; and (2) if manufacturing growth during the recovery had not relied so heavily on robots, there would be many more jobs available to workers, and minority young workers in particular.
Introduction
Although it took several years for the U.S. economy to rebound from the Great Recession, the economic expansion currently under way is by most accounts viewed as stellar.1 Since February 2010—eight months after the National Bureau of Economic Research’s Dating Committee declared the recession’s end—private sector job growth has occurred for 112 consecutive months, growing at a monthly average of 192,000, and creating over 21.3 million jobs through May 2019. The nation’s unemployment rate has fallen far below the 6 to 7 percent level that many economists and policymakers once believed was the “NAIRU”—the nonaccelerating inflation rate of unemployment, below which inflation supposedly would take off. (It hasn’t.)
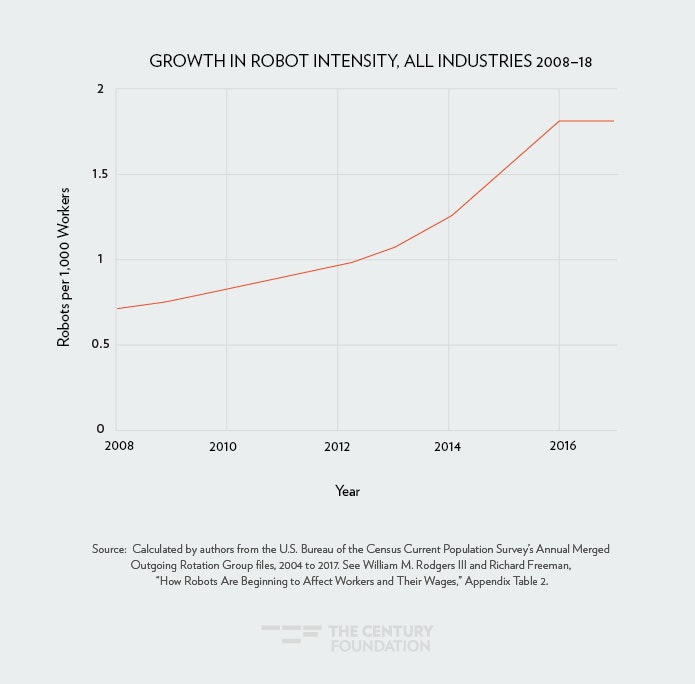
As the current expansion unfolded, technological change continued to reshape how Americans work, where they work, when they work, and with whom they work. One example of this growing impact of technology in the workplace is the use of industrial robots in the workplace. According to the International Federation of Robotics (IFR), from 2009 to 2017, the use of robots in the U.S. workplace—often called “robot exposure”—more than doubled, from 0.75 robots per thousand workers to 1.81 robots per thousand workers. (See Figure 1.) 2 Has this led to continued worker displacement effects, or are we seeing increases in employment due to robots’ productivity effect?3
Figure 1
A previous study, by Daron Acemoglu of MIT and Pascual Restrepo of Boston University, looking at thirteen manufacturing industries and six nonmanufacturing industries from 1990 to 2007, found that an increased use of industrial robots—that is, what is referred to as increased “robot intensity,” typically measured as the increase in the number of robots per thousand workers—lowered employment rates and wages overall.4 Specifically, the study estimates that one more robot per thousand workers reduces the nation’s employment-to-population ratio by about 0.18 to 0.34 percentage points, and lowers wages by 0.25 to 0.50 percent.5
Based on this and other research, we were interested in knowing how much the use of industrial robots cut into labor market improvements that occurred after the Great Recession. What would the employment picture look like today, for example, if the adoption and use of industrial robots had only occurred, without an economic boom to mask its impact? That is, how much did the recovery’s “tight” labor market offset robot’s displacement effects, or how much did robots add to employment growth? Further, were the impacts of increased robot intensity widespread, or were they targeted to particular demographic groups and regions of the country?
To explore these questions, we constructed a measure of robot intensity and used its variation across metropolitan areas (known in government data as metropolitan statistical areas, MSAs)6; and over time to identify whether robot exposure has negative impacts on the economic positions of young men and women, especially non-college-educated minority youth.
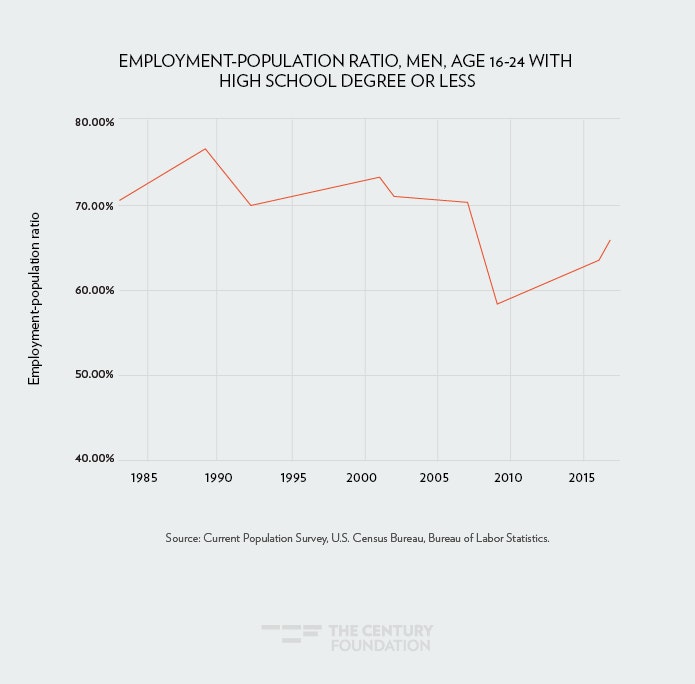
Our research presented us with several major takeaways. First, while labor market statistics such as the Bureau of Labor Statistics’ “official” unemployment rate currently look quite good, the positive trends of a persistently low jobless rate and strong job growth have not had the same beneficial effects on the employment and wages of youth and minorities as they did during the previous boom of the 1990s.7 (See Figure 2.)
Figure 2
Second, since the end of the Great Recession, we do find evidence of a small, national-level productivity effect for young less-educated men and less-educated adult women. That is, specifically, the adoption of robots increases their employment because increased robot usage (1) stimulates demand for the goods that robots produce, (2) create new markets, and (3) spurs wage growth.
However, our strongest evidence is for the existence of industrial-robot-led job displacement primarily in the nation’s East North Central (ENC) census division (Illinois, Indiana, Wisconsin, Michigan, and Ohio), with young, less-educated men and women bearing the brunt of the job losses. For an increase of one robot per thousand workers, the employment-to-population ratio of all young less-educated ENC workers falls by a precisely estimated 3.5 percentage points. This is nontrivial, given that the 2009 employment-to-population ratio for these groups is 35.0 percent. With respect to wages, an area’s one–robot-per-thousand-worker increase is associated with a 4.0 to 5.0 percent decline in the individual wages of young, less-educated men and women who live in the ENC census division and work in the manufacturing sector.
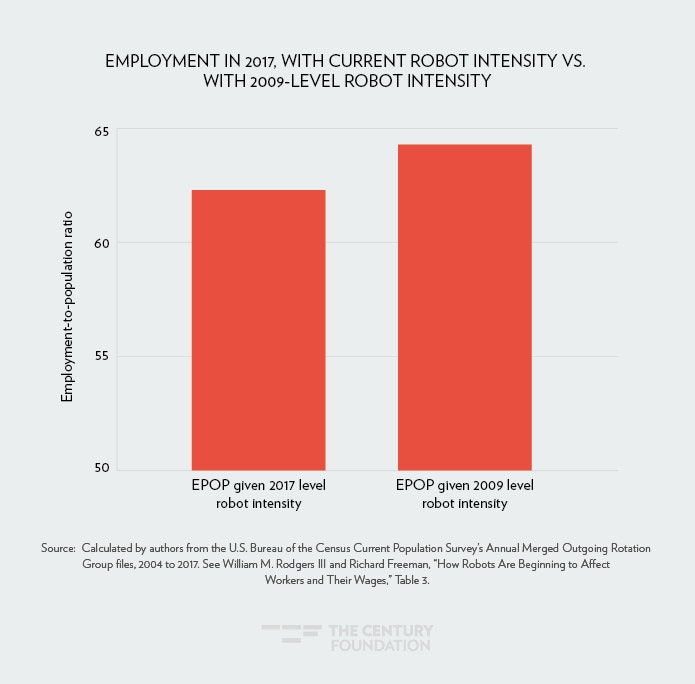
Third, even though job growth has not been as strong during this boom as it was during the 1990s, current economic growth has helped to offset the adverse impact that increased robot intensity has had on employment. For these same young, less-educated minority men and women in the ENC, if robot intensity was the only source of change from 2009 to 2017, their employment-population ratios would have fallen to approximately 30.0 percent instead of rising from 34.0 to 45.5 percent. Thus, our findings indicate that robotic growth has had its biggest negative impact on young, less-educated ENC black men and women. These men and women started at lower employment rates and they would have experienced the largest increases in employment if robotic growth was not as strong. Employment rates for young, less-educated black men and women in these heartland states are still well below the experience of other demographic groups, and the data indicates that they would have had more opportunity if not for use of industrial robots.
These findings reflect the insights of The Century Foundation’s High Wage America project8—that there needs to be concerted efforts to expand access to good-paying job opportunities in manufacturing communities, especially where there are large African-American and Latinx populations. The findings support The Century Foundation’s framework and recommended actions that will help employers find skilled workers and provide opportunities for the region’s minority residents.9
The Robots Are Coming
We are not the first to examine the impact of robots on labor market outcomes. The first generation of studies estimate the “risk” or chance that automation displaces workers. Several studies predict that, over the next two decades, 45 percent to 57 percent of U.S. and OECD workers will be at risk of losing their jobs to automation.10 More recent studies shift to estimating actual displacement effects. One widely cited study by Daron Acemoglu and Pascual Restrepo uses industry-country variation in robot usage from the International Federation of Robotics (IFR) data and finds that increasing a U.S. commuting area’s robot intensity reduces its labor market outcomes.11 Another widely cited study—by Georg Graetz at Uppsala University and Guy Michaels of the London School of Economics—also uses the IFR data but a different methodology, and shows that industrial robots increase productivity and wages, but reduce the number of jobs available to low-skilled workers.12 Specifically, the measure of industrial robot usage employed by Graetz and Michaels indicates that, for the overall economy, one more robot per thousand workers reduces the aggregate employment-to-population ratio by about 0.20 percentage points, which is equivalent to one new robot lowering employment by approximately 3.3 workers. With respect to wages, one more robot per thousand workers reduces wages by 0.37 percent.13
Although not a major focus of their study, but relevant to our work, the estimated effects by industry, occupation, gender, and skill are reported. The study reports that the effects on the employment-to-population ratios of men and women are –0.53 and –0.30. The negative job effects for men tend to be in manufacturing, while women’s losses are larger in nonmanufacturing industries. Job loss is concentrated in manual occupations, such as machinists, assemblers, material handlers, and welders. Declines in employment and wages occur at all levels of educational attainment, but tend to be larger among less-educated workers.
These studies answer many questions, but raise others. What has happened since 2007? What are the racial and ethnic effects? How are young workers impacted by the adoption and spread of industrial robots? But before we proceed to answering these questions, it is important to understand the type of robots we are talking about.
First, what is an industrial robot? The IFR, whose data we use, defines an industrial robot as “an automatically controlled, reprogrammable, multipurpose manipulator programmable in three or more axes, which can be either fixed in place or mobile for use in industrial automation applications.”14
The IFR identifies five types of industrial robots. Their mechanical structure determines the type. The types are linear (including Cartesian and gantry robots), Selective Compliance Assembly Robot Arm (SCARA), articulated robots, parallel robots (delta), and cylindrical. Articulated robots typically perform handling for metal casting, palletizing, welding, and painting. Linear robots are typically used for handling for plastic molding, sealing, laser-welding, pressing, packaging, or handling for forging. SCARA-type robots perform assembly and packaging tasks. Parallel robots carry out picking and placing tasks, assembly, and handling routines. Cylindrical robots perform spot welding.
The common thread for all of these robot types is that they are performing specific and repetitive tasks, with high volume. This is very different from artificial intelligence, which is the gathering of large quantities of data to make complex decisions. This distinction between robots and AI can help formulate predictions as to which types of workers will be disadvantaged. The general consensus is that robots are having a greater impact on less-educated workers, who can replace repetitive, often skilled tasks, of these workers.15
Where—and for Whom—Is Robot Intensity the Highest?
The robot intensity measure that we constructed16 to discover trends in metropolitan statistical areas from 2004 to 2017 indicated the following key results:
- Prior to the Great Recession, robot intensity trended upward. During the recession, robot intensity plummeted. Since 2009, robot intensity has sharply increased.
- States in East North Central (ENC) census division—Michigan, Ohio, Indiana, Illinois and Wisconsin—have the highest robot intensities.
- Minorities and youth with no more than a high school diploma live in metropolitan areas that have similar industrial robot intensities as whites and adults.
- Workers in Right-to-Work states experienced a gradual increase in their robot intensities.
- Highly unionized states have the lowest robot intensities. However, they began to trend upward after 2015.
- The top ten metropolitan statistical areas with respect to robot intensity are:
-
-
- Los Angeles-Long Beach-Santa Ana, CA
- Chicago-Naperville-Joliet, IL
- Houston-Baytown-Sugar Land, TX
- Phoenix-Mesa-Scottsdale, AZ
- Detroit-Warren-Dearborn, MI
- Milwaukee-Waukesha-West Allis, WI
- Philadelphia-Camden-Wilmington, PA-NJ-DE-MD
- San Jose-Sunnyvale-Santa Clara, CA
- Indianapolis, IN
- Cleveland-Elyria, OH
-
We estimate MSA robot intensities from 2004 to 2017, and in a given year, link an area’s robot intensity to its respondents in the Current Population Survey Outgoing Rotation Group (CPS-ORG) micro-data files.17 To be included in our CPS-ORG samples, respondents must not be enrolled in school. Further, respondents are only included if their entries can be matched with valid information for the following variables: the metropolitan area’s unemployment rate; the metropolitan area’s percentage of employment that is in manufacturing; the respondent’s race, age, educational attainment, marital status, veteran status, state of residence; whether they are foreign born, and a U.S. citizen; whether they live in a central city, suburb, or rural area; and whether the respondent lives in a Right-to-Work state.
Our youth samples are for respondents 16 to 24 years of age. They are African American, Latinx, and white men and women who have completed no more than twelve years of schooling or received no more than a high school diploma or GED. Adult respondents are 25-to-64-year-old African American, Latinx, and white men and women. They, too, have completed not more than a high school degree.
Due to the uniqueness of the IFR robot stock and intensity measure that we construct, we first provide summary statistics on robot intensity. Table 1 reports annual averages of MSA-level estimates of robot intensity for respondents by race, ethnicity and gender. There are a few racial, ethnic, age and gender differences. For example, in 2017, adult Latinx men and women have intensities of 2.34 per thousand workers, well above the overall averages. (See Figure 3.) However, these differences will not be large enough to explain much if any of the racial and ethnic differences that exist in employment and wages.
Figure 3
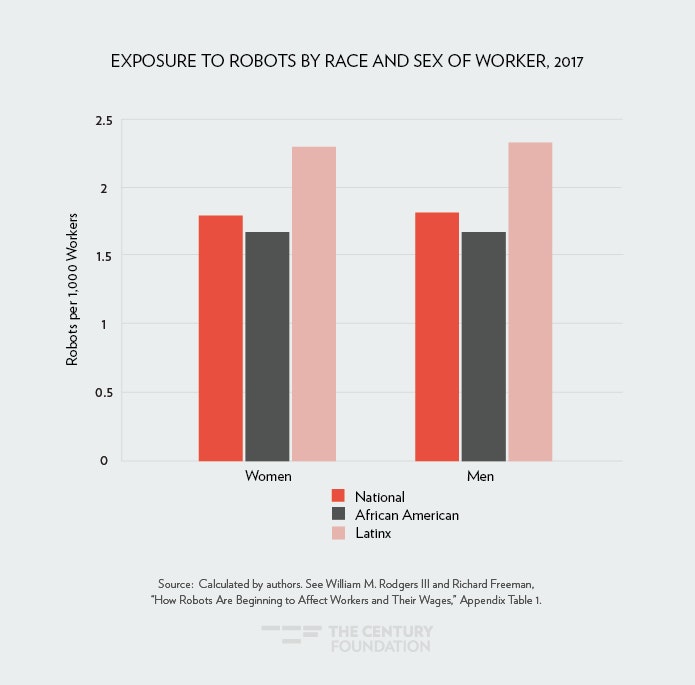
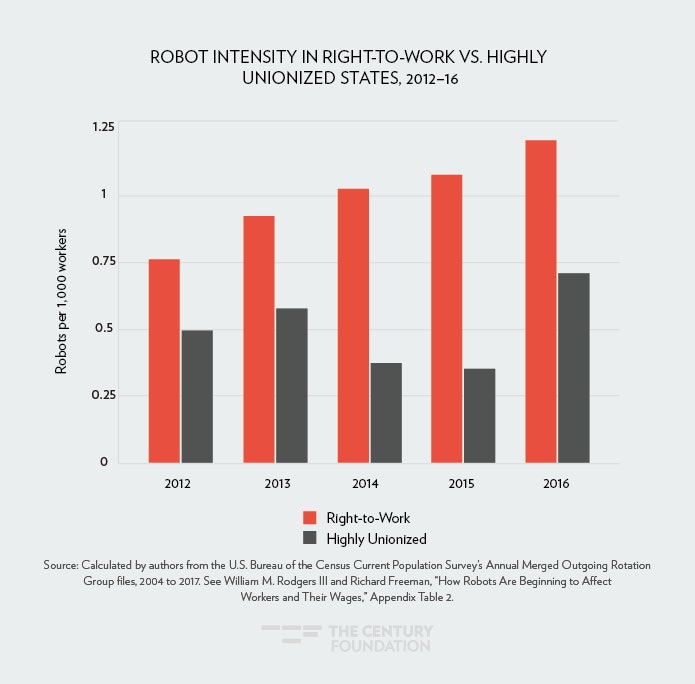
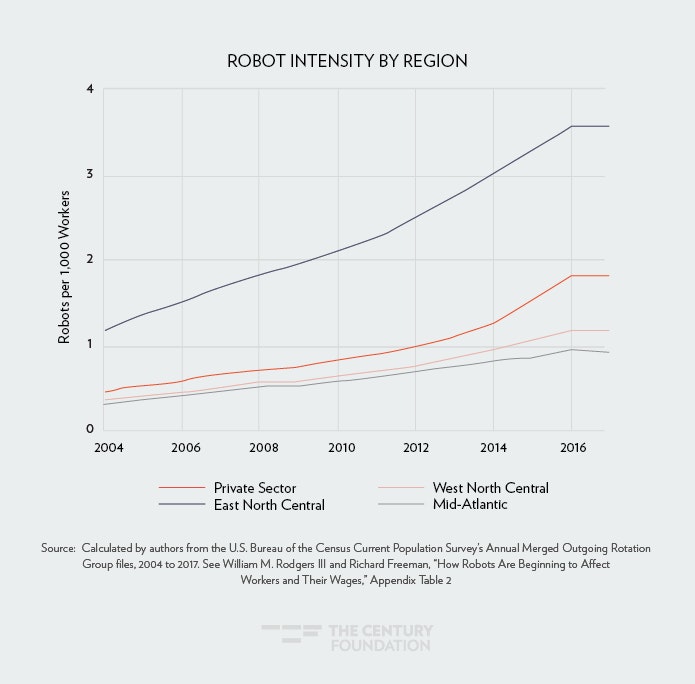
Table 2 provides the annual averages from 2004 to 2017 for selected characteristics: private sector workers, respondents that live in Right-to-Work states, respondents with no more than a high school degree, respondents that live in “highly” unionized states, and respondents that live in the East North Central or Middle-Atlantic census divisions. (See Figure 4.) The East North Central is comprised of Illinois, Indiana, Michigan, Ohio, and Wisconsin. Iowa, Kansas, Minnesota, Missouri, Nebraska, North Dakota and South Dakota make up the West North Central division. The “highly unionized” category corresponds to states with a unionization rate that exceeds 17.0 percent.18
Figure 4
The most notable finding is that the respondents that live in East North Central MSAs consistently have robot intensities that are at least twice the intensity of all other regions. (See Figure 5.) These include Chicago, Detroit, Milwaukee, Cleveland, Indianapolis, Minneapolis, Columbus, Toledo, Fort Wayne, Rockford, Elkhart-Goshen, Canton, Akron, and South Bend, all in the top fifty metropolitan areas with the greatest robot intensities (Appendix Table 1).19
Figure 5
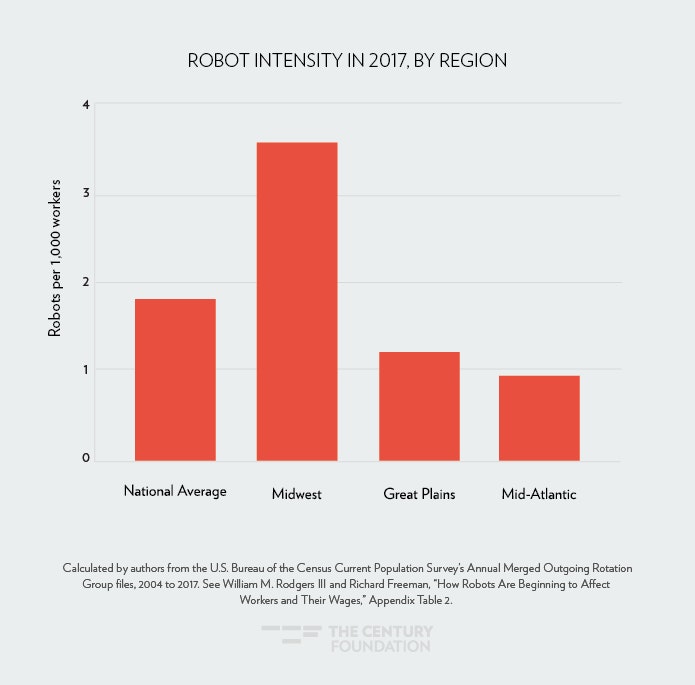
Table 2 shows that respondents in manufacturing industries have intensities that exceed the national average, and since the recession’s end, the number of robots has jumped from 0.813 per thousand workers to 1.974 per thousand workers. At the other end of the spectrum, respondents that live in highly unionized states have much lower robot intensities, with a sizeable trending up since 2016. Surprisingly, respondents that live in Right-to-Work states have intensities that are below the national average; however, the intensity has more than doubled since 2009, the end of the recession. (See Figure 6.) Panel B of Table 2 reports robot intensity for Midwestern manufacturing. As a point of comparison, the table reports robot intensities for the West North Central division (Iowa, Kansas, Minnesota, Missouri, Nebraska, North Dakota and South Dakota), plus the Middle-Atlantic states (New York, Pennsylvania, and New Jersey, Delaware, Maryland, Washington, D.C., Virginia, and West Virginia). The table clearly shows that the variation is most pronounced in the East North Central states, as demonstrated as well by Figure 6. Manufacturing robot intensity almost doubled from 2009 to the present.
Figure 6
The Impacts of Robot Intensity on Employment and Wages
How much do the employment and earnings of non-college-educated men and women vary with an area’s robot intensity? To answer this question, we compared the economic outcomes of men and women across metropolitan areas with different exposure to robots, using the merged CPS-ORG files. We applied a linear probability model for our employment analysis.20 For our wage effects, we estimate a regression that captures the relationship between an area’s robot intensity and the inflation-adjusted wages of workers in that area. To account for other factors that impact employment and wages, both models include controls for whether the respondent lives in a Right-to-Work state; marital and veteran status; whether the respondent lives in an urban or suburban area; whether the respondent is foreign born and a U.S. citizen; the metropolitan statistical area’s percent of employment that is in manufacturing; and year and metropolitan area dummy variables.21
Table 3 displays metro area fixed effect and instrumental variable estimates of the link between the employment of non-college-educated men and women to area robot intensity. The tables allow for a comparative analysis for all men and women (males and females 25 to 64 years old). The estimated coefficients indicate how an increase in one robot per thousand workers impacts a particular group’s employment-to-population ratio and wages.
The estimated coefficients on the African-American and Latinx dummy variables indicate that controlling for racial and ethnic differences in robot intensity still leaves a large employment gap between African Americans and whites. The black–white employment gaps for less-educated young men and for less-educated adult men are 14.9 and 11.9 percent, respectively. Among women, the racial employment gap ranges from 4.7 to 11.4 percent. Unlike factors such as education, training, and discrimination, racial and ethnic differences in robot intensity or exposure explain none of the employment gaps between minorities and whites.22
While robots can’t explain the black–white employment gap, two different statistical methods (the fixed-effect and instrumental variable estimates) both show statistically significant impacts of the increasing use of robots on national productivity and displacement of certain workers. The estimates for all less-educated young men, less-educated African American and Latinx young men, and less-educated adult women suggest that metro area increases in robot intensity are associated with a slight increase in employment (productivity effect). An increase in one robot per thousand workers leads to a 1.2 to 2.0 percentage point increase in their employment-to-population ratios. We can only speculate, but it seems reasonable to think that robot adoption stimulates demand for the goods that robots produce, creates new markets, and spurs wage growth, all creating an increased demand for these workers.
The actual change in robot intensities for these groups from 2004 to 2017 expands by just over one robot per thousand people. Over this same period, the employment-to-population ratio of young, less-educated men falls from 70.3 percent to 66.1 percent. Thus, the productivity effect worked to offset the actual decline in the employment-to-population ratio of young, less-educated men. Young, less-educated women and less-educated adult men are not impacted by an area’s robot intensity. This could be attributed to these groups not working directly in those industries where robot adoption is occurring.
With respect to wages, we only see an impact on the wages of young, less-educated women, and less-educated minority men and women. Higher robot intensity increases wages for these groups. Less educated adult men and women are not adversely impacted by increased robot intensity. These results are quite different than what the study by Acemoglu and Restrepo finds.23 That study’s national level results for the general population suggest an adverse impact on employment and wages: an additional robot per thousand workers reduces the employment-to-population ratio by about 0.18 to 0.34 percentage points and wages by 0.25 to 0.50 percent.
Why do our estimates differ from those of Acemoglu and Restrepo? There are several potential explanations. We create robot intensity measures for 262 MSAs, while they construct their robot intensity measures for 722 commuting zones.24 Our samples also differ. We focus on youth and adults who have no more than a high school degree, while they focus on the overall population. A priori, we thought that the employment and wages of these workers would be quite sensitive to an area’s robot exposure. The productivity effects that we find for young, less-educated men and less-educated adult women suggest that even workers with the least education may benefit from the increased use of robots. Maybe some workers with no more than a high school degree are in jobs that are not as easily taken over by robots, or they benefit from a multiplier effect. New higher productivity/high wage jobs generate demand for jobs that workers with no more than a high school degree fill. We may need to focus on respondents with slightly higher levels of educational attainment (for example, high school and AA degrees).
We do agree with Acemoglu and Restrepo that the robot intensity effects are concentrated in Rust Belt manufacturing sectors of the East North Central (ENC) census division. Appendix Table 1 shows that most metropolitan areas have intensity measures that are basically zero, while the ENC has not only the highest intensities, but also had the sharpest growth from 2004 to 2017. Thus, displacement effects, if they exist in the data, are more likely to have a regional and industry component to them. Focusing on sectors and regions that are directly impacted by robots may be a better identification strategy.
To implement this identification strategy, we limit the samples to men and women that live in the East North Central census division. Table 3 also reports the employment and wage effects for the ENC division by race/ethnicity and age. These are based on respondents that live in Ohio, Illinois, Indiana, Michigan, and Wisconsin. It is important to note that to maintain sample sizes that yield reliable results, we pool men and women.25 We also pool African-American and Latinx respondents. Entries in the column labeled “ENC Men and Women” suggest that the use of industrial robots does not have displacement or productivity effects on ENC employment. Maybe they offset each other. The estimated coefficients for young ENC less-educated men and women and adults are basically zero. A negative effect of -0.010 may exist for young, less-educated black and Latinx men, but the standard errors indicate the estimate has little precision. The wage results show no evidence that an area’s growth in robot intensity is associated with a decline in the area’s wages.
The last column of Panel A of Table 3 reports estimates for only manufacturing workers in the ENC census division. These estimates indicate that robot intensity has a displacement effect. For an increase of one robot per thousand workers, the employment-to-population ratio of all young, less-educated men and women falls by a precisely estimated 3.5 percentage points. (See Figure 7.) This is nontrivial given that the 2009 employment-population ratio for these groups is 35.0 percent. All less-educated ENC adult men and women experience neither a displacement nor a productivity effect. Panel B of Table 3 shows that an area increase of one robot per thousand workers is associated with a 4.0 to 5.0 percent decline in the wages of young, less-educated men and women who live in the ENC census division and work in the manufacturing sector. The wages of less-educated adults are not adversely impacted.
Figure 7
There appear to be limited spillover impacts on the general population of less-educated workers, but although not measured with precision, there are negative impacts on the employment of manufacturing workers, especially if they work in manufacturing and reside in the East North Central census division.
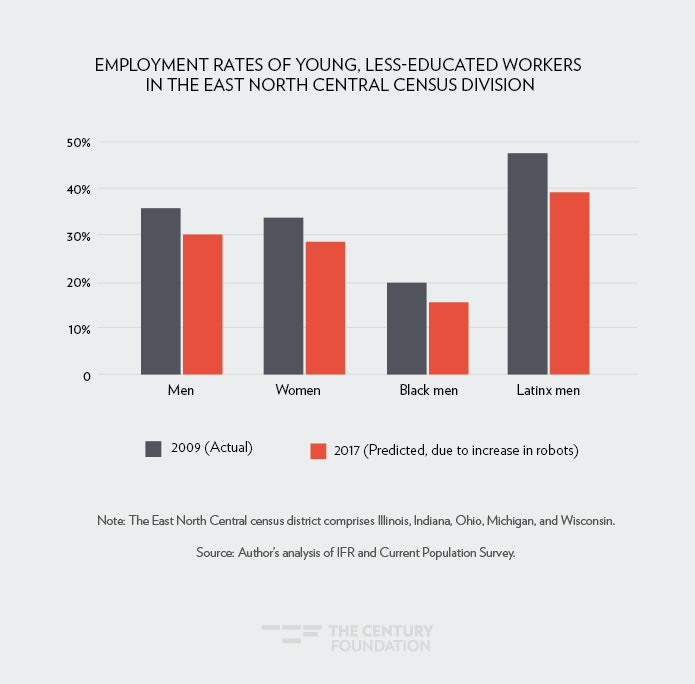
To conclude this section, we generated the predicted ENC employment rates by race and age based on the actual change in robot intensities from 2009 to 2017. For example, we created an estimate of the youth employment-to-population ratio assuming that robot intensity was the only source of change from 2009 to 2017. We then compared it to what actually happened to the youth employment-to-population ratio. Table 4 presents the predictions. For less-educated ENC youth, their employment-to-population ratio actually increases from approximately 34.0 percent to around 45.5 percent. If robot intensity was the only source of change between 2009 and 2017, the employment-to-population ratio of ENC youth would have fallen to approximately 30.0 percent. (See Figure 8.) Robotic growth has its biggest negative impact on young, less-educated ENC black men and women. These men and women started at lower employment rates and they would have experienced the largest increases in employment if robotic growth was not as strong. While the employment prospects of less-educated ENC youth were still quite low relative to prime-age workers in 2017, the economic expansion was strong enough such that they experienced a net improvement in employment prospects during that time period.
Figure 8

The implication of these findings is that, if manufacturing growth during the expansion had not relied so heavily on robots, there would be more jobs in particular for minorities, as described in Table 4 and Figure 9, which shows that employment rates of young, less-educated minority workers in the East North Central division have been depressed by automation. Robots have a particular impact on repetitive production jobs, such as machine operators, that have provided a source of good pay for young adult minorities in the industrial heartland. Our model indicates that this impact was large enough to decrease employment among these workers who have limited alternative opportunities, as evident by their already low employment-population ratios. Fortunately, the overall economic expansion was large enough to offset the job losses associated with robot adoption. Still, the employment levels of young, less-educated workers in the Rust Belt are far lower than other groups and robots appear to be having an impact.
Figure 9
It is worth noting that the use of robots contributes to the productivity and competitiveness of the economy and manufacturing sector, and the sector’s ability to increase output even as factory employment has not increased as much as it had in past cycles.26 For those workers that remain, industrial robots may actually be saving jobs—as robots make it possible for firms to competitively produce in the United States and compete with low-wage nations such as Mexico. This effect is not captured in our model and is an important caveat to the results.27
Conclusions
With respect to the employment displacement effects of industrial robots, it is unclear as to whether adoption will accelerate in the East North Central division’s manufacturing sector and spread to other census divisions and industries; however, past experience and current research suggests the transformation that has been going on for decades will continue.28 During periods of previous adoption and diffusion of technology, numerous prominent policymakers, leaders, and economists predicted that the new technology was going to create widespread and crushing job displacement.29 Yet, there is little evidence to support this claim.
However, if the impact of robots is similar to the introduction of previous technologies, as shown in this report, there are “winners” and “losers.” Depending on the size of the individual and societal impacts, policymakers and employers may need to proactively work to ensure that they can find the skilled workers needed to operate and maintain these robots. Communities may need to provide education and training opportunities for new jobs and occupations that are created as a result of the robot technology. More importantly, policymakers, unions, employers, and nonprofit social service organizations will need to assist workers, especially young minority and women workers that get displaced. This is important because, even though there is no recession on the horizon, economic growth has begun to slow, meaning the ability of a “rising tide” to offset the negative aspects of robots will diminish.
Finally, the experiences of young Midwestern minority and women workers, employers, and their communities can help other parts of the country prepare for and minimize the economic, social, and cultural adjustment costs associated with the introduction and diffusion of robots. For example, The Century Foundation’s recent work on reinvigorating Chicago’s manufacturing sector and expanding economic opportunities of the city’s African-American and Latinx residents provides an excellent framework and outlines a series of actions that help employers find skilled workers and provide opportunity for the region’s minority residence.30 First, they propose the creation of public–private partnerships that support technological innovation in new products and increased efficiency of existing firms. Second, they propose the development of proactive initiatives that have the goal of retaining, reshoring, and revitalizing sustainable manufacturing jobs. Third, they promote capital strategies that rejuvenate manufacturing communities. Finally, they propose stimulating demand for manufacturing products via public procurement and infrastructure projects.
Table 1
| Summary Statistics on by Age, Race, Gender, and Ethnicity of Metropolitan Area Robot Intensity, 2004 to 2017 (Robots per Thousand Workers) |
||||||||||||
| U.S. | African American | Latinx | ||||||||||
| Women | Men | Women | Men | Women | Men | |||||||
| Year | Youth | Adult | Youth | Adult | Youth | Adult | Youth | Adult | Youth | Adult | Youth | Adult |
| 2004 | 0.451 | 0.448 | 0.453 | 0.453 | 0.484 | 0.530 | 0.529 | 0.509 | 0.507 | 0.495 | 0.508 | 0.533 |
| 2005 | 0.527 | 0.523 | 0.537 | 0.526 | 0.575 | 0.619 | 0.588 | 0.588 | 0.582 | 0.565 | 0.575 | 0.595 |
| 2006 | 0.599 | 0.583 | 0.594 | 0.586 | 0.672 | 0.668 | 0.659 | 0.646 | 0.653 | 0.637 | 0.655 | 0.660 |
| 2007 | 0.666 | 0.650 | 0.674 | 0.658 | 0.773 | 0.747 | 0.744 | 0.737 | 0.716 | 0.733 | 0.743 | 0.749 |
| 2008 | 0.725 | 0.710 | 0.728 | 0.711 | 0.829 | 0.814 | 0.797 | 0.798 | 0.814 | 0.808 | 0.852 | 0.816 |
| 2009 | 0.759 | 0.747 | 0.764 | 0.757 | 0.825 | 0.822 | 0.850 | 0.817 | 0.851 | 0.845 | 0.841 | 0.862 |
| 2010 | 0.838 | 0.811 | 0.836 | 0.822 | 1.002 | 0.917 | 0.930 | 0.897 | 0.908 | 0.896 | 0.882 | 0.931 |
| 2011 | 0.899 | 0.883 | 0.896 | 0.896 | 1.089 | 0.992 | 1.065 | 0.959 | 0.989 | 0.977 | 0.966 | 1.013 |
| 2012 | 0.965 | 0.966 | 0.960 | 0.960 | 1.091 | 1.084 | 1.059 | 1.049 | 1.087 | 1.065 | 1.021 | 1.100 |
| 2013 | 1.077 | 1.067 | 1.075 | 1.075 | 1.240 | 1.198 | 1.190 | 1.197 | 1.302 | 1.181 | 1.174 | 1.199 |
| 2014 | 1.267 | 1.244 | 1.299 | 1.299 | 1.345 | .3441 | 1.354 | 1.349 | 1.524 | 1.443 | 1.508 | 1.482 |
| 2015 | 1.564 | 1.530 | 1.557 | 1.557 | 1.567 | 1.517 | 1.509 | 1.511 | 1.988 | 1.936 | 1.946 | 2.005 |
| 2016 | 1.803 | 1.804 | 1.838 | 1.838 | 1.537 | 1.731 | 1.749 | 1.673 | 2.346 | 2.331 | 2.372 | 2.333 |
| 2017 | 1.810 | 1.792 | 1.824 | 1.824 | 1.619 | 1.686 | 1.667 | 1.675 | 2.364 | 2.313 | 2.375 | 2.339 |
|
Notes: Notes: The entries are annual averages of MSA-level estimates of robot intensity for respondents with a particular characteristic. Similar to the metropolitan area unemployment rate, the area Robot intensity measure is linked to an individual’s micro data. We construct the intensity estimate as follows. MSA-level robot intensity for MSA i in year t is adapted from the commuter-based measure in Acemoglu and Restrepo (2017). MSA i’s exposure in year t is written as follows: MSA’s exposure to robots in year t=Σ lsi 2000 (RU Si,t⁄LU Si,t) i∈I Where lsi 2000 corresponds to the 2000 share of MSA s employment in industry i, which we construct from the 2000 MORG files of the CPS. The term RU Si,t is the ith industry’s robot intensity in year t at the U.S. level. This data comes from the IFR stock data base. The LU Si,t denotes at the national level, the ith industry’s total employment in year t. |
||||||||||||
Table 2
|
Summary Statistics on U.S. Metropolitan Area Robot Intensity, 2004 to 2017 (Robots per Thousand Workers) |
|||||||||
|
Panel A: Selected Characteristics |
|||||||||
| Year | All Industries | Private Sector | Right-to-Work | Less Educated and Not Enrolled | ENC | WNC | Middle-Atlantic | Highly Unionized | Manufacturing Only |
| 2004 | 0.451 | 0.461 | 0.328 | 0.451 | 1.188 | 0.369 | 0.325 | 0.407 | 0.495 |
| 2005 | 0.526 | 0.534 | 0.388 | 0.514 | 1.368 | 0.415 | 0.385 | 0.457 | 0.570 |
| 2006 | 0.587 | 0.595 | 0.437 | 0.577 | 1.515 | 0.460 | 0.427 | 0.503 | 0.633 |
| 2007 | 0.657 | 0.670 | 0.491 | 0.652 | 1.702 | 0.517 | 0.478 | 0.559 | 0.728 |
| 2008 | 0.713 | 0.727 | 0.534 | 0.711 | 1.852 | 0.565 | 0.520 | 0.549 | 0.777 |
| 2009 | 0.754 | 0.766 | 0.565 | 0.741 | 1.970 | 0.596 | 0.544 | 1.792 | 0.813 |
| 2010 | 0.820 | 0.835 | 0.625 | 0.810 | 2.125 | 0.651 | 0.593 | 0.523 | 0.893 |
| 2011 | 0.891 | 0.909 | 0.693 | 0.871 | 2.295 | 0.697 | 0.647 | 0.730 | 0.989 |
| 2012 | 0.969 | 0.991 | 0.763 | 0.939 | 2.507 | 0.770 | 0.706 | 0.502 | 1.066 |
| 2013 | 1.073 | 1.100 | 0.931 | 1.047 | 2.756 | 0.867 | 0.777 | 0.583 | 1.186 |
| 2014 | 1.253 | 1.280 | 1.031 | 1.235 | 3.032 | 0.955 | 0.838 | 0.376 | 1.420 |
| 2015 | 1.545 | 1.573 | 1.083 | 1.534 | 3.290 | 1.076 | 0.866 | 0.357 | 1.733 |
| 2016 | 1.811 | 1.836 | 1.213 | 1.789 | 3.579 | 1.194 | 0.948 | 0.717 | 1.984 |
| 2017 | 1.805 | 1.825 | 1.779 | 3.583 | 1.208 | 0.941 | 1.805 | 1.974 | |
|
Notes: The entries are annual averages of MSA-level estimates of robot intensity for respondents with a particular characteristic. The categories correspond to the following: private sector workers, whether the respondent lives in a Right-to-Work state, whether they have no more than a high school degree, whether the live in one of the three census divisions, whether the respondent lives in a highly unionized state. The ENC is comprised of Michigan, Ohio, Indiana, Wisconsin, and Minnesota. The WNC states are Iowa, Kansas, Minnesota, Missouri, Nebraska, North Dakota and South Dakota. Highly unionized corresponds to states with unionization rate that exceeds 17.0 percent which is the unionization rate at the 75th percentile of the state-level union membership distribution for the period from 2004 to 2016. Similar to the metropolitan area unemployment rate, the area Robot intensity measure is linked to an individual’s micro data. The robot intensity for MSA i in year t is adapted from the commuter-based measure in Acemoglu and Restrepo (2018). MSA i’s exposure in year t is written as follows: MSA’s exposure to robots in year t=Σ lsi 2000 (RU Si,t⁄LU Si,t) i∈I Where lsi 2000 corresponds to the 2000 share of MSA s employment in industry i, which we construct from the 2000 MORG files of the CPS. The term RU Si,t is the ith industry’s robot intensity in year t at the U.S. level. This data comes from the IFR stock data base. The LU Si,t denotes at the national level, the ith industry’s total employment in year t. |
|||||||||
Table 2 cont.
|
Summary Statistics on Regional Manufacturing Metropolitan Area Robot Intensity, 2004 to 2017 (Robots per Thousand Workers) |
||||
| Panel B: Manufacturing Only | ||||
| Manufacturing Only | ||||
| Year | U.S. Manufacturing Only | ENC | WNC | Middle-Atlantic |
| 2004 | 0.495 | 1.050 | 0.385 | 0.302 |
| 2005 | 0.570 | 1.166 | 0.425 | 0.373 |
| 2006 | 0.633 | 1.276 | 0.472 | 0.397 |
| 2007 | 0.728 | 1.454 | 0.525 | 0.439 |
| 2008 | 0.777 | 1.559 | 0.564 | 0.484 |
| 2009 | 0.813 | 1.730 | 0.601 | 0.501 |
| 2010 | 0.893 | 1.934 | 0.665 | 0.543 |
| 2011 | 0.989 | 2.061 | 0.729 | 0.577 |
| 2012 | 1.066 | 2.190 | 0.795 | 0.639 |
| 2013 | 1.186 | 2.410 | 0.898 | 0.705 |
| 2014 | 1.420 | 2.658 | 0.966 | 0.797 |
| 2015 | 1.733 | 2.786 | 1.113 | 0.818 |
| 2016 | 1.984 | 3.055 | 1.290 | 0.849 |
| 2017 | 1.974 | 3.169 | 1.209 | 0.883 |
| Notes: The entries are annual averages of MSA-level estimates of robot intensity for respondents with a particular characteristic. Similar to the metropolitan area unemployment rate, the area Robot intensity measure is linked to an individual’s micro data. We construct the intensity estimate as follows. The robot intensity for MSA i in year t is adapted from the commuter-based measure in Acemoglu and Restrepo (2017). MSA i’s exposure in year t is written as follows:
MSA’s exposure to robots in year t=Σ lsi 2000 (RU Si,t⁄LU Si,t) i∈I Where lsi 2000 corresponds to the 2000 share of MSA s employment in industry i, which we construct from the 2000 MORG files of the CPS. The term RU Si,t is the ith industry’s robot intensity in year t at the U.S. level. This data comes from the IFR stock data base. The LU Si,t denotes at the national level, the ith industry’s total employment in year t. |
||||
Table 3
|
Instrumental Variable and Fixed Effect Employment and Wage Models |
||||||
| Panel A: Employment | ||||||
| All | Manufacturing Only | |||||
| Men | Women | ENC Men and Women | Men | Women | ENC Men and Women | |
| Young Less Educated | ||||||
| Robot intensity | 0.012a | 0.003 | -0.002 | -0.013 | -0.074 | -0.035a |
| (0.003) | (0.003) | (0.004) | (0.013) | (0.048) | (0.013) | |
| Area unemployment rate | -0.014a | -0.007a | -0.013a | -0.030a | -0.007 | -0.006 |
| (0.002) | (0.002) | (0.004) | (0.008) | (0.015) | (0.018) | |
| African American | -0.149a | -0.114a | -0.151a | -0.071a | -0.145a | -0.109c |
| (0.007) | (0.007) | (0.010) | (0.027) | (0.050) | (0.066) | |
| Latinx | -0.005 | -0.045a | -0.007 | 0.005 | -0.011 | 0.054 |
| (0.007) | (0.005) | (0.011) | (0.019) | (0.037) | (0.056) | |
| Young, Less-Educated Black and Latinx | ||||||
| Robot intensity | 0.020a | 0.002 | -0.010 | -0.009 | -0.051 | -0.037 |
| (0.004) | (0.004) | (0.007) | (0.024) | (0.072) | (0.025) | |
| Area unemployment rate | -0.017a | -0.005c | -0.002 | -0.031a | 0.007 | 0.014 |
| (0.003) | (0.003) | (0.007) | (0.012) | (0.025) | (0.044) | |
| African American | -0.136a | -0.064a | -0.135a | -0.103a | -0.176a | -0.133 |
| (0.010) | (0.009) | (0.012) | (0.036) | (0.057) | (0.090) | |
| All Less Educated Adult | ||||||
| Robot intensity | 0.001 | 0.010a | 0.001 | -0.002 | -0.010a | 0.001 |
| (0.002) | (0.002) | (0.002) | (0.004) | (0.004) | (0.005) | |
| Area unemployment rate | -0.013a | -0.002 | -0.007b | -0.018a | -0.010a | -0.032a |
| (0.001) | (0.001) | (0.004) | (0.002) | (0.004) | (0.005) | |
| African American | -0.119a | -0.042a | -0.093a | -0.069a | -0.038a | -0.077a |
| (0.006) | (0.010) | (0.008) | (0.008) | (0.011) | (0.009) | |
| Latinx | 0.012b | 0.007 | 0.039a | -0.006 | 0.003 | 0.000 |
| (0.006) | (0.008) | (0.012) | (0.006) | (0.011) | (0.007) | |
| Adult, Less-Educated Black and Latinx | ||||||
| Robot intensity | 0.003 | 0.014a | 0.001 | 0.002 | -0.016a | 0.006 |
| (0.003) | (0.004) | (0.004) | (0.004) | (0.005) | (0.010) | |
| Area unemployment rate | -0.011a | -0.006a | -0.003 | -0.014a | -0.013c | -0.027a |
| (0.002) | (0.002) | (0.006) | (0.004) | (0.008) | (0.008) | |
| African American | -0.111a | -0.047a | -0.107a | -0.045a | -0.040a | -0.055a |
| (0.009) | (0.017) | (0.010) | (0.013) | (0.014) | (0.017) | |
|
Notes: Calculated from the U.S. Bureau of the Census Current Population Survey’s Annual Merged Outgoing Rotation Group files, 2004 to 2017. The entries are coefficients from linear probability models which include year and MSA dummy variables, dummy variables for race and ethnicity, whether the respondent lives in a Right-to-Work state, their age, marital and veteran status and educational attainment, whether the live in an urban, suburban or rural area, whether the respondent is foreign born and a U.S. citizen, and the Metropolitan area’s percent of employment that is in manufacturing.31 Robust standard errors are in parentheses. a 1 percent level of significance. b 5 percent level of significance. c 10 percent level of significance. |
||||||
Table 3 cont.
|
Instrumental Variable and Fixed Effect Employment and Wage Models |
||||||
|
Panel B: Wages |
||||||
| All | Manufacturing Only | |||||
| Men | Women | ENC Men and Women | Men | Women | ENC Men and Women | |
| Young, Less-Educated | ||||||
| Robot intensity | 0.006 | 0.020a | -0.001 | 0.001 | 0.018 | -0.041a |
| (0.005) | (0.005) | (0.005) | (0.036) | (0.035) | (0.013) | |
| Area unemployment rate | -0.008a | -0.009a | -0.002 | -0.011 | -0.018 | 0.016 |
| (0.003) | (0.003) | (0.008) | (0.008) | (0.012) | (0.019) | |
| African American | -0.084a | -0.009c | -0.053a | -0.057a | -0.109a | -0.093a |
| (0.005) | (0.005) | (0.010) | (0.021) | (0.040) | (0.033) | |
| Latinx | -0.023a | 0.006 | -0.002 | -0.039a | 0.019 | -0.015 |
| (0.006) | (0.006) | (0.006) | (0.019) | (0.026) | (0.032) | |
| Young, Less-Educated Black and Latinx | ||||||
| Robot intensity | 0.017a | 0.025a | 0.010 | 0.001 | 0.038 | -0.050b |
| (0.007) | (0.006) | (0.008) | (0.040) | (0.040) | (0.020) | |
| Area unemployment rate | -0.005 | -0.009a | 0.007 | -0.004 | -0.007 | 0.051c |
| (0.004) | (0.003) | (0.009) | (0.012) | (0.017) | (0.029) | |
| African American | -0.057a | -0.021b | -0.067a | -0.012 | -0.119c | -0.112a |
| (0.008) | (0.009) | (0.014) | (0.029) | (0.062) | (0.052) | |
| All Less-Educated Adult | ||||||
| Robot intensity | -0.005 | -0.006 | -0.009a | 0.007 | -0.005 | -0.002 |
| (0.007) | (0.006) | (0.002) | (0.007) | (0.012) | (0.005) | |
| Area unemployment rate | -0.002 | 0.000 | 0.002 | 0.001 | 0.003 | 0.002 |
| (0.002) | (0.002) | (0.004) | (0.003) | (0.005) | (0.007) | |
| African American | -0.211a | -0.068a | -0.148a | -0.182a | -0.106a | -0.160a |
| (0.006) | (0.005) | (0.019) | (0.013) | (0.017) | (0.028) | |
| Latinx | -0.097a | -0.050a | -0.050a | -0.104a | -0.105a | -0.064a |
| (0.007) | (0.006) | (0.014) | (0.011) | (0.014) | (0.018) | |
| Adult, Less-Educated Black and Latinx | ||||||
| Robot intensity | 0.004 | 0.006 | -0.006 | 0.015b | -0.015 | -0.011 |
| (0.013) | (0.011) | (0.006) | (0.007) | (0.012) | (0.011) | |
| Area unemployment rate | -0.007b | -0.005b | -0.002 | -0.005 | 0.007 | -0.003 |
| (0.003) | (0.003) | (0.006) | (0.005) | (0.006) | (0.013) | |
| African American | -0.113a | -0.016c | -0.110a | -0.093a | 0.000 | -0.122a |
| (0.007) | (0.009) | (0.018) | (0.016) | (0.027) | (0.031) | |
|
Notes: Calculated from the U.S. Bureau of the Census Current Population Survey’s Annual Merged Outgoing Rotation Group files, 2004 to 2016. The entries are coefficients from linear probability models which include year and MSA dummy variables, dummy variables for race and ethnicity, whether the respondent lives in a Right-to-Work state, their age, marital and veteran status and educational attainment, whether the live in an urban, suburban or rural area, whether the respondent is foreign born and a U.S. citizen, and the Metropolitan area’s percent of employment that is in manufacturing. Robust standard errors are in parentheses. a 1 percent level of significance. b 5 percent level of significance. c 10 percent level of significance. |
||||||
Table 4
|
Actual and Predicted Employment-Population Ratios |
|||
| Actual 2009 | Predicted 2017 due to change in robot intensity | Actual 2017 | |
| Young, Less-Educated Men | |||
| All | 0.388 | 0.400 | 0.430 |
| Black | 0.239 | 0.254 | 0.357 |
| Latinx | 0.457 | 0.486 | 0.451 |
| Adult, Less-Educated Women | |||
| All | 0.568 | 0.578 | 0.564 |
| Black | 0.550 | 0.561 | 0.572 |
| Latinx | 0.500 | 0.521 | 0.531 |
| Young, Less-Educated Women | |||
| All | 0.347 | 0.271 | 0.385 |
| Black | 0.268 | 0.226 | 0.379 |
| Latinx | 0.333 | 0.262 | 0.360 |
| Adult Women | |||
| All | 0.568 | 0.557 | 0.564 |
| Black | 0.550 | 0.537 | 0.572 |
| Latinx | 0.500 | 0.476 | 0.531 |
| ENC Young, Less-Educated | |||
| Men | 0.356 | 0.302 | 0.463 |
| Women | 0.338 | 0.289 | 0.450 |
| Black men | 0.200 | 0.156 | 0.299 |
| Latinx men | 0.478 | 0.393 | 0.552 |
| Black women | 0.219 | 0.168 | 0.378 |
| Latinx women | 0.321 | 0.230 | 0.443 |
|
Notes: The first column corresponds to the actual 2009 employment-population ratio for a particular demographic group. The second column corresponds to the predicted 2017 employment-population ratio. It is constructed by creating the predicted change in employment associated with the actual change in robot intensity. This is done by taking the coefficients from the linear probability models and multiplying them by the actual change in robot intensity from 2009 to 2017. This product and the actual 2009 level are summed to create the 2016 predicted employment due to the associated increase in robot intensity. The third column is the actual 2017 employment-population ratio. For ease of interpretation the last three columns can be multiplied by 100. |
|||
Click Here for Appendix
Notes
- The NBER designated the end of the “Great Recession” as June 2009; however, private sector growth would not turn positive until February 2010. During the 2016 presidential campaign, candidate Trump criticized the quality of the data that was indicating a strong economy. However, since becoming President he has been the “numbers” biggest cheerleaders, even to a point where in a tweet he previewed the positive news one hour in advance of the report.
- Authors’ analysis of International Federation of Robotics data.
- There is renewed anxiety that robotics and artificial intelligence will lead to large scale displacement. See, for example, Erik Brynjolfsson and Andrew McAfee, The Second Machine Age: Work, Progress, and Prosperity in a Time of Brilliant Technologies (New York: W. W. Norton and Company, 2014) and Martin Ford, The Rise of the Robots (New York: Basic Books, 2015). There is a large and growing volume of complementary evidence that automation of low- and medium-skill occupations explains the observed employment polarization and wage inequality. See, for example, David H. Autor, Frank Levy, and Richard J. Murnane, “The Skill Content of Recent Technological Change: An Empirical Exploration,” Quarterly Journal of Economics 118, no. 4 (2003): 1279–1333; Maarten Goos and Alan Manning, “Lousy and Lovely Jobs: The Rising Polarization of Work in Britain,” Review of Economics and Statistics 89, no. 1 (2007): 118–33; Guy Michaels, Ashwini Natraj, and John Van Reenen, “Has ICT Polarized Skill Demand? Evidence from Eleven Countries over Twenty-Five Years,” Review of Economics and Statistics 96, no. 1 (2014): 60–77.
- Daron Acemoglu and Pascual Restrepo, “Robots and Jobs: Evidence from U.S. Labor Markets,” 2018, https://economics.mit.edu/files/15254.
- Daron Acemoglu and Pascual Restrepo, “Robots and Jobs: Evidence from U.S. Labor Markets,” (2018), https://economics.mit.edu/files/15254.
- The U.S. Office of Management and Budget) defines an MSA a geographic region centered around an urban core. For detailed description see, https://www.census.gov/programs-surveys/metro-micro/about.html.
- See, for example, the president’s quotes about the economy in John W. Schoen, “President Trump says job growth is booming under his watch, but it has slowed down–so far,” CNBC, April 16, 2018, https://www.cnbc.com/2018/04/16/job-growth-slows-under-trump.html.
- Andrew Stettner and Joel S. Yudken, “A Federal Agenda for Revitalizing America’s Manufacturing Communities,” The Century Foundation, September 12, 2018, https://tcf.org/content/report/federal-agenda-revitalizing-americas-manufacturing-communities/.
- Teresa Córdova, Matthew Wilson, and Andrew Stettner, “Revitalizing Manufacturing and Expanding Opportunities for Chicago’s Black and Latino Communities,” The Century Foundation, June 6, 2018, https://tcf.org/content/report/revitalizing-manufacturing-expanding-opportunities-chicagos-black-latino-communities/.
- See, for example, Carl Benedikt Frey and Michael A. Osborne, “The Future of Employment: How Susceptible Are Jobs to Computerization?” Oxford Martin School, September 17, 2013, https://www.fhi.ox.ac.uk/wp-content/uploads/The-Future-of-Employment-How-Susceptible-Are-Jobs-to-Computerization.pdf; World Development Report 2016: Digital Dividends (Washington, D.C.: World Bank, 2016), http://www.worldbank.org/en/publication/wdr2016; James Manyika, Michael Chui, Mehdi Miremadi, Jacques Bughin, Katy George, Paul Willmott, and Martin Dewhurst, “A Future that Works: Automation, Employment and Productivity,” McKinsey Global Institute, January 2017, https://www.mckinsey.com/featured-insights/digital-disruption/harnessing-automation-for-a-future-that-works; Erik Brynjolfsson and Andrew McAfee, The Second Machine Age: Work, Progress, and Prosperity in a Time of Brilliant Technologies (New York: W. W. Norton & Company, 2014); and Martin Ford, The Rise of the Robots (New York: Basic Books, 2015).
- Daron Acemoglu and Pascual Restrepo, “Robots and Jobs: Evidence from U.S. Labor Markets,” 2018, https://economics.mit.edu/files/15254.
- Georg Graetz and Guy Michaels, “Robots at Work,” Review of Economics and Statistics 100, no. 5 (December 2018): 753–68.
- Graetz and Michaels (2018) also an important study, uses industry-country variation in robot usage and find that industrial robots increase productivity and wages, but reduce the number of jobs available to low-skilled workers. Georg Graetz and Guy Michaels, “Robots at Work,” <em?>Review of Economics and Statist/ics 100, no. 5 (December 2018): 753–68.
- Industrial Robots 2016 (Frankfurt: International Federation of Robotics, 2016), 25, https://ifr.org/img/office/Industrial_Robots_2016_Chapter_1_2.pdf. Reprogrammable means that the robot’s programmed motions or auxiliary functions can be changed without physical alteration. The term multipurpose means that the robot is capable of being adapted to a different application with physical alteration. A robot’s physical alteration indicates that the mechanical system does not include storage media (for example, ROMs). Finally, the robot’s axis determines the direction used to specify the robot motion in a linear or rotary mode.
- The following studies find that automation in a number of low- and medium-skill occupations explains the growth in wage inequality and employment loss: David H. Autor, Frank Levy, and Richard J. Murnane, “The Skill Content of Recent Technological Change: An Empirical Exploration,” Quarterly Journal of Economics 118, no. 4 (2003): 1279–1333; Maarten Goos and Alan Manning, “Lousy and Lovely Jobs: The Rising Polarization of Work in Britain,” Review of Economics and Statistics 89, no. 1 (2007): 118–33; and Guy Michaels, Ashwini Natraj, and John Van Reenen, “Has ICT Polarized Skill Demand? Evidence from Eleven Countries over Twenty-Five Years,” Review of Economics and Statistics 96, no. 1 (2014): 60–77.
- To construct our measure of an area’s robot intensity or exposure, we use Acemoglu and Restrepo’s measure, but construct it for U.S. Metropolitan Statistical Areas (MSAs) for the years 2004 to 2017. Our robot stock measure is based on the series developed in Richard B. Freeman and George J. Borjas. 2019. “From Immigrants to Robots: The Changing Locus of Substitutes for Workers” in Improving Employment and Earnings in 21st Century Labor Markets, (Russell Sage Foundation, 2019) that uses the flows to create the stocks. This is done because in the early years of the IFR panel, the unspecified category contains 30 percent of the robots. To address this issue, Acemglu and Restropo “allocate these unclassified robots to the industries in the same proportions as in the classified data”; Daron Acemoglu and Pascual Restrepo, “Robots and Jobs: Evidence from U.S. Labor Markets,” (2018), https://economics.mit.edu/files/15254.
Endogeneity of the robot exposure measure is of concern. It may be that particular sectors adopt robots as a response to other macroeconomic changes which impact labor demand. Shocks to a MSA’s labor demand may affect the decisions of businesses and industries located in the state. This could include decisions with respect to the usage of robots. To create our instrumental variables, we construct the intensity measure as described in the next section but use the IFR data for Japan and Germany to assign values to different sub-sectors.
- The robot intensity for an MSA in year t is adapted from the commuter-based measure in Acemoglu and Restrepo, “Robots and Jobs,” which is a Bartik-type measure. We choose the metropolitan area as our geographic unit such that it maintains consistency with our previous work on the impact that local area unemployment rates have on the employment and wages of residents (Richard B. Freeman and William M. Rodgers III, “Area economic conditions and the labor market outcomes of young men in the 1990s expansion,” in Prosperity for All? The Economic Boom and African Americans (New York: Russell Sage Foundation, 2000).
Formally, an MSA’s exposure in year t is written as follows:
MSA’s exposure to robots in year t=i∈Ilsi2000(Ri,tUSLi,tUS),
where lsi2000 corresponds to the 2000 share of MSA s employment in industry i, which we construct from the 2000 decennial census STF-4 file (Source: U.S. Census Bureau, Census 2000 Summary File 4, Matrix PCT85.) The term Ri,tUS is the ith industry’s robot intensity in year t at the U.S. level. This data comes from the IFR stock data base. The Li,tUS denotes at the national level, the ith industry’s total employment in year t. - This is the unionization rate at the seventy-fifth percentile of the state-level union membership distribution for the period from 2004 to 2016.
- Upon first inspection Phoenix looks like an outlier. However, although primary metal products comprises 2.0 percent of the area’s manufacturing industry, the sub-sector contains the largest number of robots coming into the U.S. on a yearly basis.
- The dependent variable is a 0–1 dummy variable for whether the respondent is employed in a given year; the independent variables are the area unemployment rate, metropolitan area robot intensity or exposure, and measures of demographic characteristics: age, educational attainment, race and ethnicity. The variable for race is a dummy variable equaling 1 if the respondent is African American and 0 if the respondent is white. Dummy variables for whether the respondent is Native American or Asian are also included. The variable for Latinx ethnicity is a dummy variable equaling 1 if the respondent is Latinx and 0 if they are non-Latinx. The models are estimated separately for men and women.
- Although Acemglo and Restropo control for changes in imports from China and the decline of routine occupations between 1990 and 2007 and the decline of routine occupations, we do not. First, their results for robots do not change when these measures are added. Second, if these measures don’t influence the effect of robots from 1990 to 2007, we find it hard to believe that they will impact robots in our later sample from 2004 to 2017.
- See William M. Rodgers III, “Race in the Labor Market: The Role of Equal Employment Opportunity and Other Policies ” in Improving Employment and Earnings in 21st Century Labor Markets (New York: Russell Sage Foundation, 2019), for a detailed review of the literature on the causes and consequences of racial earnings inequality.
- Daron Acemoglu and Pascual Restrepo, “Robots and Jobs: Evidence from U.S. Labor Markets,” 2018, https://economics.mit.edu/files/15254.
- As defined in Charles M. Tolbert and Molly Sizer, “U.S. Commuting Zones and Labor Market Areas: A 1990 Update,” U.S. Department of Agriculture, Economic Research Service, Staff Paper no. AGES-9614, September 1996, https://usa.ipums.org/usa/resources/volii/cmz90.pdf. The commuting zones are based on 1990 data. Given that Acemoglu and Restrepo use 1990 as their benchmark year, using Tolbert and Sizer’s commuting zones makes sense. However, Andrew Foote and colleagues show that the commuting zones developed in Tolbert and Sizer are sensitive to two methodological assumptions; see Andrew Foote, Mark J. Kutzbach, and Lars Vilhuber, “Recalculating…: How Uncertainty in Local LaborMarket Definitions Affects Empirical Findings,” CES Working Paper 17-49, 2017, https://www2.census.gov/ces/wp/2017/CES-WP-17-49.pdf. Acemoglu and Restrepo and others might want to perform the sensitivity analysis that Foote and colleagues suggest. Another type of sensitivity analysis would use the commuting zones that the U.S. Department of Agriculture ERS created for 1980, 1990 and 2000. “Commuting Zones and Labor Market Areas,” U.S. Department of Agriculture, Economic Research Service, https://www.ers.usda.gov/data-products/commuting-zones-and-labor-market-areas.aspx.
- Because of this we add a gender dummy variable to the model.
- Michael Hicks and Srikant Devaraj, “The Myth and Reality of Manufacturing in America,” Ball State University, June 2015, http://projects.cberdata.org/reports/MfgReality.pdf.
- Karren Harris, Austin Kimson, and Andrew Schwedel, “Labor 2030: The Collision of Demographics, Automation and Inequality,” Bain and Company, 2018, http://www.bain.com/publications/articles/labor-2030-the-collision-of-demographics-automation-and-inequality.aspx?mc_cid=cea0b760ba&mc_eid=ceb0b04944.
- See, for example, Information Technology and the U.S. Workforce: Where Are We and Where Do We Go from Here? (Washington, D.C.: The National Academies Press, 2017), https://doi.org/10.17226/24649.
- “Effects of Information Technology on Productivity, Employment, and Incomes,” in Information Technology and the U.S. Workforce: Where Are We and Where Do We Go from Here? (Washington, D.C.: The National Academies Press, 2017), https://www.nap.edu/read/24649/chapter/5#61.
- Teresa Córdova, Matthew Wilson, and Andrew Stettner, “Revitalizing Manufacturing and Expanding Opportunities for Chicago’s Black and Latino Communities,” The Century Foundation, June 6, 2018, https://tcf.org/content/report/revitalizing-manufacturing-expanding-opportunities-chicagos-black-latino-communities/.
- The sample sizes for the male employment models are as follows: All Less-Educated Youth—103,883; Minority Youth—40,144; All Less-Educated Adults—283,270; Minority Adults—104,071. The female employment model samples sizes are: All Less-Educated Youth—91,627; Minority Youth—36,552; All Less-Educated Adults—276,162; Minority Adults—101,965. Each model contains between 240 and 270 metropolitan areas. The wage samples are one-third to one-half of the employment model’s samples.