
“School enrollment patterns are closely tied to residential patterns. In short, housing policy is school policy.”
—David Rusk1
Introduction: Montgomery County as an Exemplary Case of Economic Integration
Montgomery County, Maryland, operates one of the most acclaimed large public school systems in the United States. Although an increasing share of the population of this suburban school district just outside Washington, D.C., is low income, and the majority of its students belongs to racial minority groups, the county graduates nine in ten of its students. Two-thirds of its high school students take at least one Advanced Placement course, and the average SAT score in the district greatly exceeds the national average. A recent book has lauded its educational reforms intended to close racial and economic achievement gaps.2 A large education publisher, Pearson, has acquired rights to sell the district’s elementary school curriculum.3 Reflecting these accomplishments, the district is a finalist for the 2010 Broad Prize, a prestigious award to honor excellence among urban school districts.
Montgomery County also ranks among the top twenty wealthiest counties in the nation, and has done so since its inception in the 1950s. Less than 5 percent of its residents live in poverty, compared to a national rate of 15 percent. Despite the increasing share of low-income students within its school system, a little less than one-third of its approximately 142,000 students qualified for a free and reduced-price meals (FARM) in 2010—a ratio that is somewhat lower than the national average (42.9 percent) and far lower than that in most of the largest urban districts such as Los Angeles, Chicago, and New York City, where about three out of every four students qualify.4
Montgomery County’s reputation as both an affluent area with good schools and a district that serves low-income students relatively well is firmly established. Much less known is the fact that it operates the nation’s oldest and by far the largest inclusionary zoning program—a policy that requires real estate developers to set aside a portion of the homes they build to be rented or sold at below-market prices. The zoning stipulation has caused the production of more than 12,000 moderately priced homes in the county since 1976. Similar inclusionary zoning policies have since spread to over one hundred high-cost housing markets in California; Massachusetts; New Jersey; New York City; Santa Fe, New Mexico; Denver and Boulder, Colorado; the greater Washington, D.C., metro area; and Burlington, Vermont, among other places.5
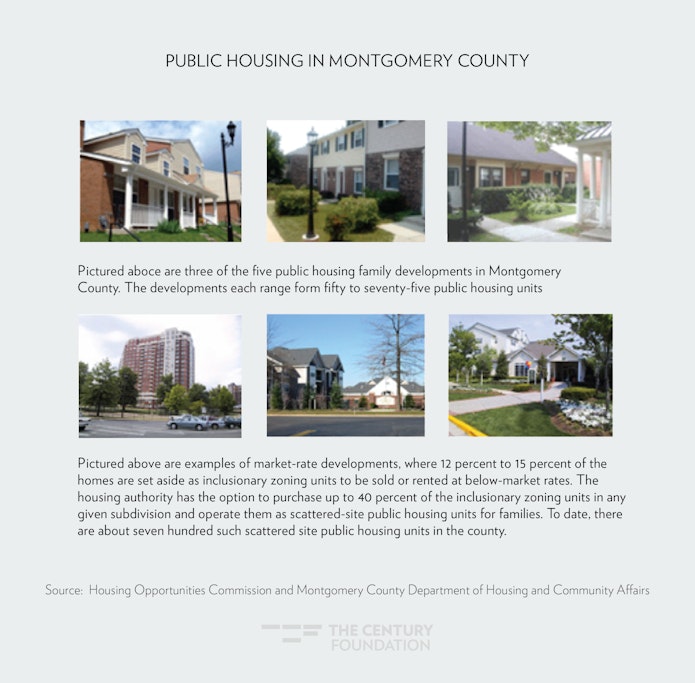
A singular feature of Montgomery County’s zoning policy is that it allows the public housing authority, the Housing Opportunities Commission, to purchase one-third of the inclusionary zoning homes within each subdivision to operate as federally subsidized public housing, thereby allowing households who typically earn incomes below the poverty line to live in affluent neighborhoods and send their children to schools where the vast majority of students come from families that do not live in poverty. To date, the housing authority has purchased about 700 apartments that are located in market-rate apartment complexes that it operates as public housing. All told, it operates 992 public housing family apartments (some clustered in small public housing developments) that are located in hundreds of neighborhoods throughout the county and are zoned into almost every one of the school district’s 131 elementary schools. Families who occupy the public housing apartments in Montgomery County have an average income of $22,460 as of 2007, making them among the poorest households in the county. The apartments are leased at a fraction of the normal market rates: whereas the average monthly rent for a two-bedroom apartment in Montgomery County in 2006 was $1,267, public housing tenants’ average rent contribution was $371 (equal to one-third of their income, per federal regulation) in the same year.
The Housing Opportunities Commission randomly assigns applicants to the public housing apartments. Since almost all of the county’s elementary schools have neighborhood-based attendance zones, children in public housing thus are assigned randomly to their elementary schools via the public housing placement process. This feature prevents families’ self-selection into neighborhoods and elementary schools of their choice, which in turn allows for a fair comparison of children in public housing in low-poverty settings to other children in public housing in higher-poverty settings within the county.
Building on the strength of the random assignment of children to schools, I examine the longitudinal school performance from 2001 to 2007 of approximately 850 students in public housing who attended elementary schools and lived in neighborhoods that fell along a spectrum of very-low-poverty to moderate-poverty rates. In brief, I find that over a period of five to seven years, children in public housing who attended the school district’s most-advantaged schools (as measured by either subsidized lunch status or the district’s own criteria) far outperformed in math and reading those children in public housing who attended the district’s least-advantaged elementary schools.
In this report, I describe the study, the findings, and their ramifications. First, I review why economic integration in neighborhoods and schools might matter in the first place. Then I provide greater context about the Montgomery County school district and the housing policies in question, and briefly describe the methods by which I compare the schooling outcomes of children in public housing. Following that, I set out the results of the study by describing the influence of school poverty (as measured by two different metrics) and neighborhood poverty on children’s math and reading outcomes. Then I clarify what can and cannot be learned from this study. Finally, after reviewing my findings, I consider how Montgomery County’s experience might pertain to that of similar suburbs, as well as to the challenges facing policymakers concerned with the issues of affordable housing and education.
To anticipate the lengthier discussion below, the following list sets out the main educational and housing-related effects of Montgomery County’s economically integrative housing policies.
School-related Findings
- School-based economic integration effects accrued over time. After five to seven years, students in public housing who were randomly assigned to low-poverty elementary schools significantly outperformed their peers in public housing who attended moderate-poverty schools in both math and reading. Further, by the end of elementary school, the initial, large achievement gap between children in public housing who attended the district’s most advantaged schools and their non-poor students in the district was cut by half for math and one-third for reading.
- The academic returns from economic integration diminished as school poverty levels rose. Children who lived in public housing and attended schools where no more than 20 percent of students qualified for a free or reduced price meal did best, whereas those children in public housing who attended schools where as many as 35 percent of students who qualified for a free or reduced price meal performed no better academically over time than public housing children who attended schools where 35 to 85 percent of students qualified for a free or reduced price meal. (Note that fewer than 5 percent of schools had more than 60 percent of students from low-income families, and none had more than 85 percent in any year, making it impossible to compare the effects of low-poverty schools with truly high-poverty schools, where 75 percent to 100 percent of the families are low-income).
- Using subsidized meals as the metric for measuring school need might be insufficient. The two different measures of school disadvantage used in this study—subsidized school meal status and Montgomery County’s own criteria—each indicate that children from very poor families benefited over the course of five to seven years from attending low-poverty schools. A comparison of the district’s own measure of school disadvantage to the most commonly employed measure (subsidized meals) yielded differently sized estimates of the benefits to low-income elementary school children of attending advantaged schools. The differences suggest the shortcoming of the free and reduced-price meal metric as a single indicator of school need.
Housing-related Findings
- In Montgomery County, inclusionary zoning integrated children from highly disadvantaged families into low-poverty neighborhoods and low-poverty schools over the long term. The county’s inclusionary zoning program generally, and its scattered site public housing program in particular, have been a highly successful means of exposing low-income persons to low-poverty settings. As of the years in which this study took place, families with school-age children living in public housing had stayed in place for an average of eight years, which resulted in long term exposure of their children to low-poverty settings.
- Residential stability improved students’ academic outcomes. Even though the families living in public housing in Montgomery County earned very low incomes, they stayed in place for longer periods of time than is typical of public families nationally with similar incomes. Their residential stability was a crucial aspect that allowed their children to reap the long run benefits of attending low-poverty schools.
- Children in public housing benefited academically from living in low-poverty neighborhoods, but less than from attending low-poverty schools. There is suggestive evidence that, above and beyond which schools they attended, low-income children who lived in very low poverty neighborhoods (where 0 percent to 5 percent of families live in poverty) experienced modest academic benefits as compared to those children in public housing who lived in low-poverty neighborhoods (where 5 percent to 10 percent live in poverty). School-based economic integration had about twice as large an effect as neighborhood-based economic integration on low-income children’s academic performance. However, the prevailing low poverty rates within Montgomery County only allowed for a limited test of neighborhood poverty effects.
How Economic Integration Matters to Children
With few exceptions, schools in the United States with high concentrations of students from low-income families perform less well than schools with low concentrations of poverty. Last year, more than one-half of fourth and eighth graders who attended high-poverty schools failed the national reading test, compared to fewer than one in five students from the same grade levels who attended low-poverty schools.6 The average achievement gap between high- and low-poverty schools has remained virtually unchanged over the past ten years, and slightly exceeds the black-white student achievement gap.7
Given the large, persistent academic achievement gap between low- and high-poverty schools, many social scientists and policymakers engaged in housing and education argue that children in low-income households derive substantial benefits from living and attending schools in economically integrated neighborhoods. The concept first gained credibility with the extremely positive results stemming from the 1976 Supreme Court case Hills v. Gautreaux, which caused the relocation of some Chicago public housing families to affluent suburban settings.8 Research on those families who moved to suburbs because of Gautreaux suggested that poor children typically required a period of one to six years in which to make academic gains, but that after seven years, there were substantial, positive effects on the children’s school outcomes. However, the Moving to Opportunity experiment, a subsequent and more exacting test of integrating poor families into non-poor neighborhoods that was conducted in several cities across the country, failed to obtain the same positive educational results for low-income children, in part perhaps because students saw only minor changes in school poverty levels. Students in the treatment group attended schools with a mean subsidized lunch population of 67.5 percent, compared to 73.9 percent for the control group.9
The most common hypotheses about the positive impacts that low-poverty neighborhoods have on children include decreasing stress levels through less exposure to crime, gang activity, housing mobility, unemployment, weakened family structure, and through better access to services and resources such as libraries and health clinics; increasing academic expectations and performance through increased access to positive role models and high-performing peers, skilled employment opportunities close to home for their parents, quality day care and out-of-school resources, and prevailing norms of attending and staying in school; and promoting the adoption of pro-social attitudes and behaviors, with less exposure to peers and adults engaged in violent behavior, drug use, or other antisocial activities.10
Prevailing theories about the advantages of low-poverty schools are that they not only benefit from having more material resources, but also reap the stability-conferring benefits from having greater parental stewardship as well as attract and retain a better-prepared corps of teachers, administrators, and students. Put another way, changing the poverty level among the student body could affect school practice through five primary mechanisms: teacher quality, since teachers are sensitive to the student composition of the school and are more likely to transfer or exit when placed in poor schools; school environment, because high-poverty schools experience greater churn in staffing and students as well as higher levels of confrontation; increased parent involvement, where middle-class parents tend to establish a norm of parental oversight by customizing their children’s school experiences; teacher-student interactions, since teachers calibrate their pedagogical practice to the perceived levels of student skills and preparedness; and peer interactions, since peers form the reference group against which children compare themselves, and by which they model behavior and norms.11 By contrast, high-poverty schools and neighborhoods may receive bursts of investment—for example, a stellar school principal, an infrastructure project, a new curricular mandate—but the investments typically form a succession of short-term reforms and churning leadership that fails to achieve sustained improvements.12 While these inequities do not determine a school’s academic performance, they do influence them.
Considering the disparities between low- and high-poverty schools and neighborhoods, it might seem obvious that any child would benefit from living in a low-poverty neighborhood and attending a low-poverty school. Yet, it has proved quite difficult to quantify the degree to which economic integration benefits children.13 Further, it is quite possible that economic integration of children from low-income families could isolate or otherwise alienate children, detracting from their performance. Policy-induced economic integration in schools is a small but growing intervention,14 while residential sorting along economic and racial lines is quite common, yielding a relatively small proportion of poor children who live in low-poverty settings and attend low-poverty schools. However, it is difficult to generalize from the experiences of these children, since their families may particularly value—and thus be more likely to benefit from—access to low-poverty places.15
In view of this research challenge, Montgomery County’s unusual and successful economically integrative housing program offers a rare look into a subject that has been hard to research well: how poor children fare in affluent settings.
Setting and Methods of the Study
Montgomery County is a large, affluent suburb of Washington, D.C., that is home to almost one million people. The median household income in 2008 was $93,895, which is 80 percent higher than the national figure. While aggregate statistics establish the area’s affluence and privilege, they gloss over its substantial heterogeneity. Although the county is primarily suburban, it is best understood as a large region (almost five hundred square miles) that contains urban, suburban, and rural communities. Approximately two-thirds of its residents are white, with the rest comprised of equal shares of African-Americans, Hispanics, and Asians. Almost one-third of its residents are foreign-born, which is more than double the national rate. Montgomery County was one of the first suburbs nationally to host more jobs than residences; as early as 1970, a majority of its residents both lived and worked there.16 There are roughly 550 neighborhoods,17 and, in the vast majority of them, less than 10 percent of residents live in poverty.
Portrait of the School District
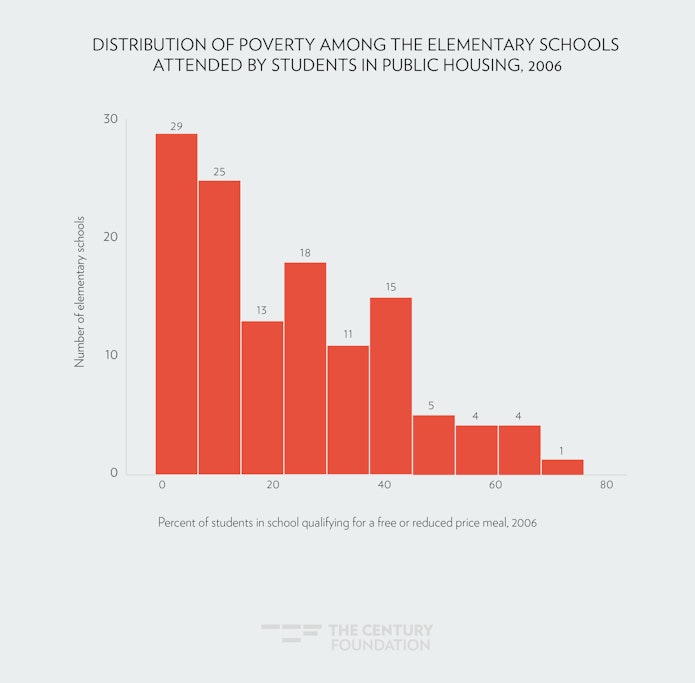
The rate of poverty in Montgomery County schools is higher and more varied than that of its neighborhoods. Of the school district’s 114 elementary schools that students in public housing attended during the study period of 2001–07, the percentage of students who qualified for FARM ranged from as low as 1 percent of the student body to as high as 72 percent in 2006.18 Figure 1 reveals that, in this study, about one half of the elementary schools that children in public housing attended had less than 20 percent poverty, as measured by the percentage of students who were eligible for a subsidized meal.
Figure 1
Subsidized meal status is the first measure of school need considered in this study. The second is the district’s own metric for schools that it considered most “impacted”—presumably by poverty. This designation arose out of the district’s decision to invest more heavily in its most disadvantaged elementary schools after a county commission in the late 1990s found that students’ demographic characteristics and academic performance in third grade could perfectly predict their subsequent level of participation in Advanced Placement and honors courses in high school.19 In response, the school district created in 2000 its own measure of school disadvantage for the purposes of directing additional investments to its neediest schools. The neediest half of the elementary schools in the system—sixty schools—were designated as “red zone” schools, while the balance were designated as “green zone” schools. Red zone schools typically had the largest number of students living in poverty, and the schools clustered along a main north-south interstate bisecting the county. By 2006, though, there was no single criterion that cleanly delineated green zone schools from red zone schools; for example, the red zone schools had subsidized meal rates ranging from 17 percent to 72 percent, while white and African-American students accounted for 0 percent to 50 percent and 10 percent to 74 percent, respectively, of any given red zone school’s population.
After designating the least-advantaged half of its schools as belonging to a red zone, the district proceeded to make a series of extra investments in them. Red zone schools were the first in the district to phase in full-day kindergarten, they reduced class sizes in kindergarten through third grade, invested in more than one hundred hours of professional development for teachers, and adopted specialized instruction for high-needs students, including ninety-minute blocks for a balanced literacy curriculum and sixty-minute blocks for mathematics in first and second grade.20 Reflecting these investments, the average class size as of 2006 was 19 in red zone schools, compared to 23 in green zone schools.
Portrait of Public Housing in Montgomery County
Compared to other housing authorities nationally, Montgomery County’s Housing Opportunities Commission placed an unusual focus on deconcentrating poverty over the past thirty years by eschewing large-scale public housing projects in favor of placing scattered-site public housing units and two- or three-story family developments throughout the county’s many neighborhoods. The housing authority’s success in so doing is largely attributable to Montgomery County’s adoption in the early 1970s of a mechanism known as inclusionary zoning.21 As stated previously, this zoning policy mandates that real estate developers of all housing subdivisions with thirty-five or more homes set aside between 12 percent to 15 percent of the homes to be sold or rented at below-market prices. The housing authority has the right to purchase up to one-third of inclusionary zoning homes in any given subdivision. To date, the housing authority has acquired about seven hundred scattered-site public housing homes.
Figure 2
To qualify for public housing during the years examined in this study, a household first had to sign up on a waiting list and, if selected, pass a criminal background check and provide proof of income eligibility. Income eligible households only could get onto the waiting list by submitting an application to the housing authority during a fourteen-day window that occurred every other year. Several thousand households did so each time (applicants must resubmit each time the waiting list is reopened), so any given applicant had approximately a 2 percent chance of being selected via rolling computerized lotteries. The lottery selection of applicants is without respect to seniority. As public housing apartments became available, the housing authority offered to each randomly selected household up to two size-appropriate public housing apartments of the housing authority’s own choosing. Approximately 93 percent of public housing households selected the first offer, and they typically did not know the location of the second unit at the time the first offer was made.22 Households who rejected both offers were removed from the waiting list. The initial random assignment of families to apartments persisted, due to tight restrictions by the housing authority on internal transfers and to low turnover among public housing families with children; 96 percent of children in public housing remained enrolled in Montgomery County public schools during the study period, and 90 percent of the children in public housing in the sample remained in the original elementary school to which they were assigned. (See Appendix 1 and Appendix 2 for more details about attrition from the sample and for descriptive characteristics of students enrolled in the lowest, medium-, and highest-poverty elementary schools in the district.)
The large discrepancy between prevailing rent levels and the amount of rent that public housing families paid (the average market rate rent for a two-bedroom apartment in 2006 was $1,267, whereas public housing tenants’ average rent contribution in the same year was $371) created a large incentive for poor families to apply to enter and, if selected from the waiting list, remain in the subsidized housing. Once admitted to public housing, tenants had to pay rent to the housing authority that was equal to one-third of their adjusted gross monthly income.
Children in the Study
To test whether affluent schools or neighborhoods improve low-income students’ academic achievement, this study examined all elementary-age children of families who lived in public housing during 2001–07 in Montgomery County.23 Approximately 850 children in public housing attended district elementary schools for at least two years during this period of time. These families comprised some of the very poorest households living in the county; their average income was $21,000, 72 percent were African American, and 87 percent of these families were headed by females. (See Table 1.)
Table 1
| Characteristics of Children and Families in the Study | |
| Criteria for selection | Children living in public housing enrolled in elementary grades K–6 for at least two consecutive years within the 2001–07 school-year period who (a) have at least one test score, and (b) do not qualify for special education services of more than fourteen hours per week.a |
| Number | 858 students, with 2,226 reading scores and 2,302 math scores |
| Race | |
| African-American | 72 percent |
| Hispanic | 16 percent |
| White | 6 percent |
| Asian | 6 percent |
| Average family incomeb | $21,047 |
| Average family assetsb | $775 |
| Female headed household | 87 percent |
| Average length of tenancy | 8.4 years |
|
Sources: Housing Opportunity Commission and Montgomery County Public Schools. aChildren receiving more than fourteen hours of services per week are frequently enrolled in Learning and Academic Disabilities classrooms that are often smaller in size and are designed to provide more intensive services to children that are deemed to have a disability that “significantly impacts” academic achievement. Children receiving more than thirty hours per week of special education services generally are removed from their home school and enrolled in one of the district’s special education schools. These special education schools are excluded from this analysis. Those students receiving one to fourteen hours of special education services were retained in the sample. Over half of public housing students receiving such services are classified with a speech or language disability.bSince the housing authority collects annual recertification data for every household, income and assets figures were first converted into 2006 real dollars, then averaged within each household across up to seven years of data (2001–07), and then that figure was averaged across the sample. |
|
School Economic Integration Effects
Figure 3 graphically depicts the average math performance of children in public housing who respectively attended Montgomery County’s lowest poverty and moderate poverty schools over the period of 2001 to 2007. The technical appendix (see Appendix 4, page XX) describes how these estimates were derived; it also describes the Maryland standardized tests and the test score scales.
As Figure 3 demonstrates, after two years in the district, children in public housing performed equally on standardized math tests regardless of the poverty level of the school they attended.24 This helps to confirm the random assignment of children in public housing to schools, establishing the comparability of the two groups of students. By the fifth year in the district, statistically significant differences (p < 0.05) emerged between the average performance of children in public housing in low-poverty schools compared to those in moderate-poverty schools. By the seventh year in the district, children in public housing in low-poverty schools performed an average of eight normal curve equivalent (NCE) points higher than children in public housing in higher-poverty schools. This difference is equal to 0.4 of a standard deviation in math scores—a large effect size in education research, where a typical effect size is one-tenth of a standard deviation for educational investments such as increased years of teacher experience or increased teacher cognitive ability as measured on state teacher tests. 25
Figure 3

The positive slope for the average math performance of children in public housing in low-poverty schools indicates that public housing students in the least-poor schools were catching up to their average non-poor district-mates over the course of elementary school. (Note that the test score scale is constructed such that 50 was the average math score in Montgomery County, regardless of elementary grade level or year.) This means that the average child in public housing started out performing about 17 points (NCE score of 33) below the typical Montgomery County student (NCE score of 50) in math—0.8 of a standard deviation, which comports with the national income achievement gap. Over time, however, children in public housing in the district’s low-poverty schools began to catch up to their non-poor district-mates in math; by the end of elementary school, the math achievement gap halved from an initial disparity of 17 points to 8 points. In contrast, the achievement gap between the children’s average (non-poor) district-mate and the average child in public housing in the district’s poorest elementary schools held constant.
Notably, the children in public housing benefited from attending the lowest-poverty schools even though they were more likely to cluster within non-accelerated math courses in their given schools, where greater proportions of their classmates were poor, nonwhite, and did not qualify as academically gifted or talented. This grouping occurred because each elementary school in the district provided differentiated math offerings starting in the second grade, by which point a student could have tested into either accelerated or standard math. By third grade, a child could place into one of three levels of math, and by sixth grade the offerings split into a total of four levels. Since the children living in public housing typically performed substantially lower than other children in the district, it is not surprising that they often placed into the non-accelerated math courses. Consequently, within low-poverty schools, the math classmates of children in public housing scored an average of nine points lower than their grade-mates as a whole. Likewise, the proportion of their math classmates who were gifted and talented was fourteen percentage points lower than the rate among their grademates. By contrast, the math classmates of children in public housing who attended moderate-poverty schools were more similar to that of their grademates and schoolmates as a whole.
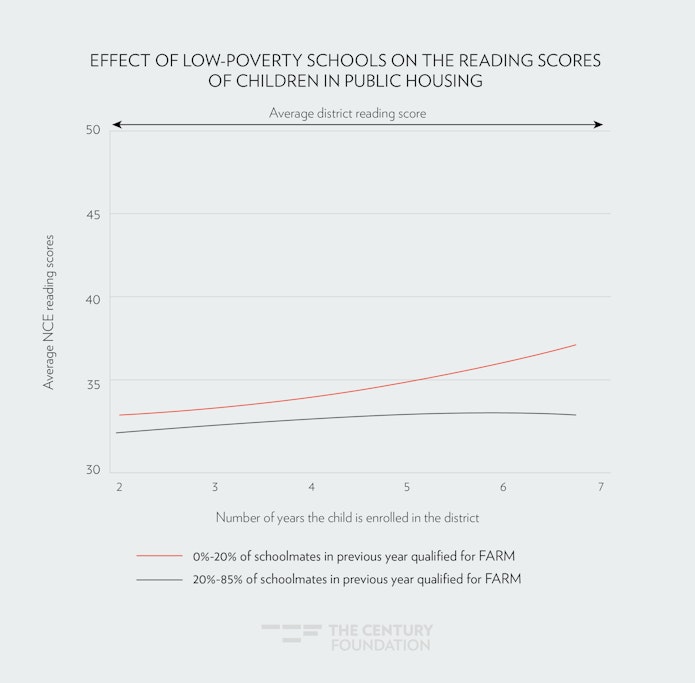
Unlike the differentiation in math, the district offered only one reading course per grade. The heterogeneous grouping of students for literacy instruction did not, however, yield larger reading than math effects for the children in public housing attending low-poverty schools. As shown in Figure 4, a more modest but similar improvement trend held for reading as for math. Unlike in math, however, the difference between reading scores for children in public housing across low- and moderate-poverty schools was never statistically significant at high levels of certainty; by the end of elementary school, the children in public housing in the lowest-poverty elementary schools performed an average of five points higher in reading (0.2 of a standard deviation, p < 0.20) than children in public housing attending moderate-poverty schools. As in math, they started out far behind their district-mates in their reading achievement. Those enrolled in low-poverty schools made modest gains relative to their district-mates, such that the achievement gap narrowed from 17 to 13 normal curve equivalent points (from 50 to 37). Also as in math, however, children in public housing attending moderate-poverty schools never caught up to their district-mates over the course of elementary school.
Figure 4
To determine whether there were diminishing academic returns to low-income students as school poverty levels rose, the graphs in Appendix 3 show the same analyses as above, but with successively higher school poverty cutoff rates. As expected, the positive effect on the math scores of students in public housing dissipated as school poverty rates rose: the average student in public housing in a school with a poverty rate as high as 35 percent performed no better in math than the typical student in public housing in an elementary school with 35 percent to 85 percent poverty. Note here that the comparison largely excludes high-poverty schools—less than 5 percent of schools in the district had poverty rates in excess of 60 percent, and only one school had a poverty rate in excess of 80 percent in any single year. The effective comparison, then, is between children in public housing in schools where 0 percent to 35 percent of schoolmates qualified for subsidized meals, who performed no better than children in public housing in schools with 35 percent to 60 percent subsidized meal students. Given the lack of truly high poverty schools in this sample, this study does not suggest that 35 percent school poverty is a tipping point, after which low-income students no longer benefit from socioeconomic integration. We cannot know from this study, for example, how students in 35 percent to 60 percent low- income schools perform compared with students in 60 percent to 100 percent low-income schools.
Regarding reading scores, by contrast, it was only at the low poverty rate of 20 percent or less that children in public housing outperformed their peers in public housing attending higher-poverty schools. Note again that the comparison here primarily was between children living in public housing who attended schools with 0 percent to 20 percent subsidized meal students to peers in public housing who attended schools with 20 percent to 60 percent subsidized meal students. Absent higher levels of school poverty in Montgomery County, it is impossible to contrast reading results for students in public housing who attended high poverty schools, although national trends suggest that it is in high-poverty schools that students perform least well.26
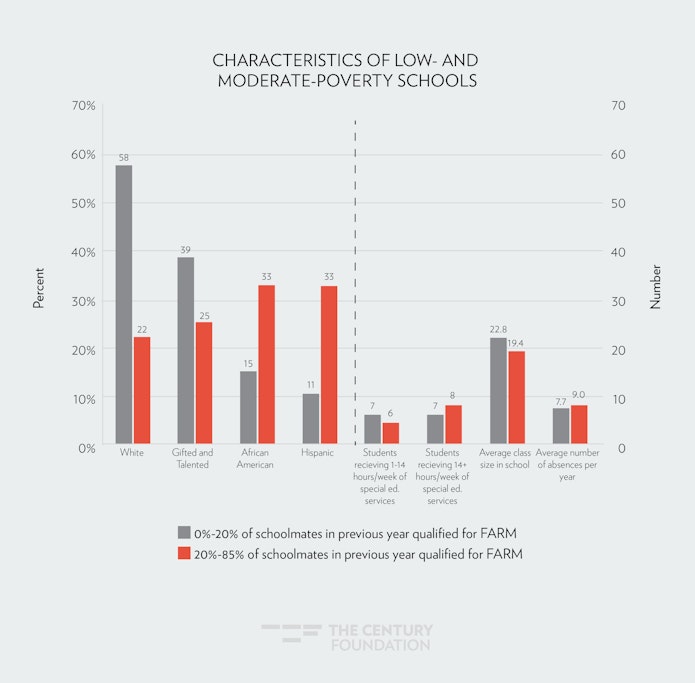
The lowest poverty elementary schools in the county had characteristics correlated with better student performance. Figure 5 shows the demographics of Montgomery County’s low- and moderate-poverty elementary schools. For example, a majority of students were white, a demographic characteristic that is positively associated with teacher quality, since the lowest rates of teacher mobility typically occur in such schools.27 (Note that teacher and administrator characteristics, an important potential source of advantage, were not available for this study.) More than one-third of students qualified as gifted and talented.28 Based on statistical tests, no single characteristic shown in Figure 5 fully accounted for the low-poverty school effect, suggesting that the benefit of low-poverty schools derived from multiple sources (or possibly from an aspect of school that is not measured here).
Figure 5
Measuring School Disadvantage a Different Way
As described above, beginning in 2000, the Montgomery County school district created its own measure of school need, designating 60 of 131 elementary schools as being in a “red zone.” Today, about one half of the district’s elementary age students attend red zone schools, while the other half attend “green zone” schools. During the years examined in this study (2001 to 2007) the district directed substantial resources to red zone schools so that they could extend kindergarten from half- to full-day, reduce class sizes from 25 to 17 in kindergarten and first grade, provide one hundred hours of additional professional development to red zone teachers, and introduce a literacy curriculum intended to bring disadvantaged students up to level by third grade.
The red/green zone designation provides an alternate way to categorize negatively impacted schools, against which to compare the commonly used but limited metric of subsidized meal status. Red- and green-zone comparisons reveal similar but even more marked impacts of school advantage on the performance of children in public housing over time. Figures 6 and 7 depict the average performance of students in public housing in both math and reading in the county’s green zone and red zone schools. After seven years, children who lived in public housing and attended green zone schools performed about nine points higher in math and eight points higher in reading (0.4 of a standard deviation, respectively, significant at the p < 0.12 level) than their peers in red zone schools, despite having started out with statistically similar achievement levels.29
Figure 6
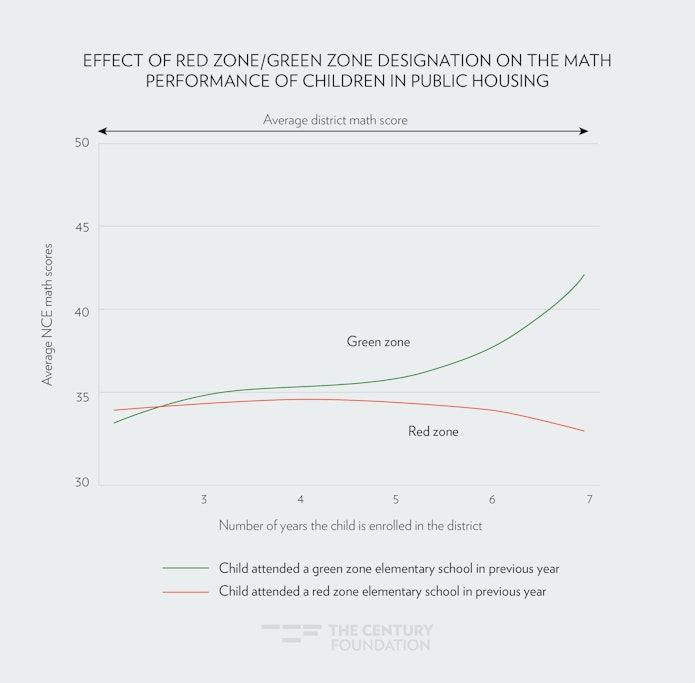
Figure 7
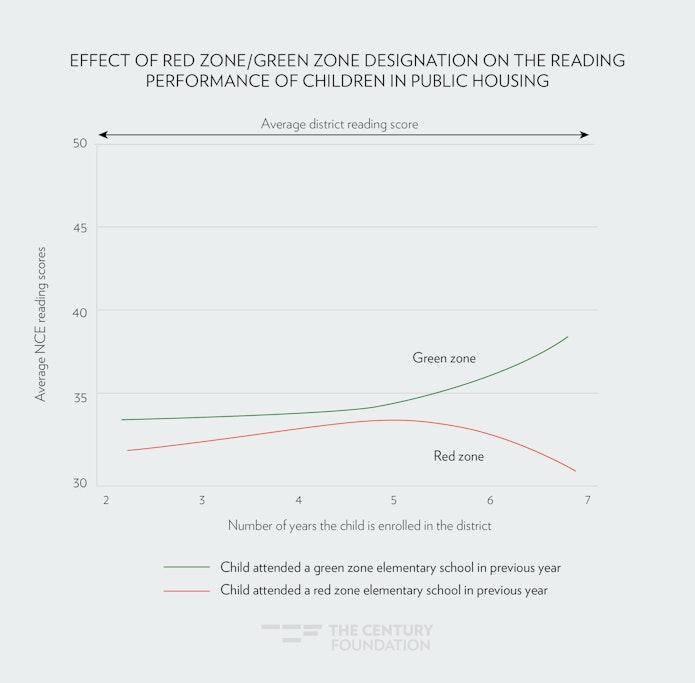
In math, the cumulative positive effect of attending a green zone school by the end of elementary school (nine points, p < 0.12) was about the same as that of attending the lowest-poverty elementary schools (eight points, p < 0.05). However, in reading, the cumulative effect of attending a green zone school (eight points, p < 0.12 level) was larger than attending the lowest-poverty schools (five points, p < 0.20 level). In the case of the green and red zone reading comparison, the larger effect was attributable to the erosion in average reading test scores toward the end of elementary school among children in public housing who attended red zone schools. One possible explanation for the negative turn was that the fourth and fifth grades did not receive the same level of intensive investments within red zone schools, which focus resources on getting children on level by grade three. In other words, the extra attention paid to grades K–3 could have caused the scores of children in public housing attending red zone schools to improve, as shown in years two through five in Figures 6 and 7. But the positive effect faded and even reversed after the extra investments stopped, as shown in the scores of children in public housing from fifth and sixth grade (that is, years six and seven in Figures 6 and 7).30 If true, this trend would not necessarily have emerged in the comparison of school poverty levels shown in Figures 3 and 4, since both green and red zone schools comprised the set of schools with 20 percent to 85 percent of school children qualifying for a free or reduced-price meal. Disturbingly, children in public housing enrolled in red zone schools not only did not keep pace with their green zone peers in public housing, but by the end of elementary school they fell even further behind their average district-mate (who earned a score of 50 in any given year) than when they first enrolled in the district.
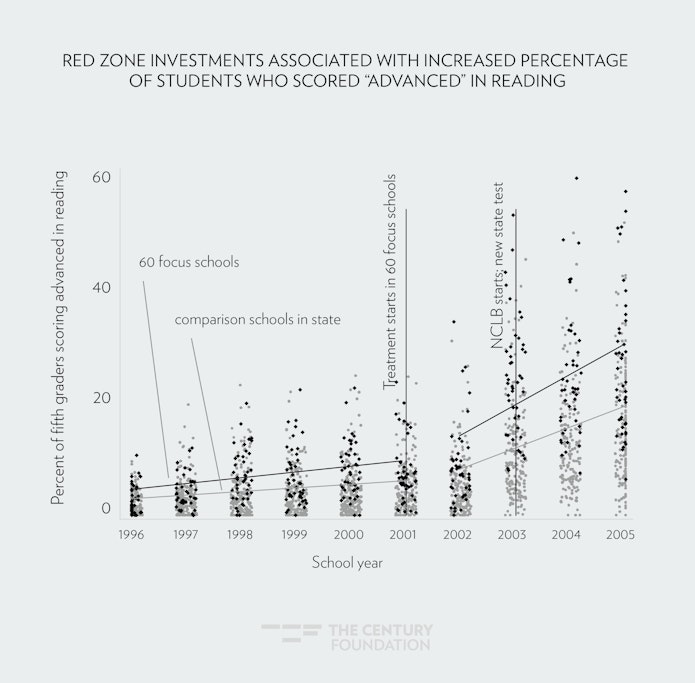
This loss of ground is especially striking when one considers the positive impact the school district’s red zone investments had on students’ campus-wide performance. To test whether red zone investments improved students’ performance relative to the absence of those investments, I conducted an analysis comparing school-wide achievement on Maryland state tests in the red zone schools to school-wide achievement in other demographically similar elementary schools throughout the state (see Figure 8). (Note that this analysis considers the aggregate achievement of all fifth grade students in each school, not just that of fifth graders who lived in public housing.) Each dot on the graph represents the percentage of students in a given elementary school that scored “advanced” on the Maryland reading assessment in fifth grade. Black dots and the black line show the trend for the red zone schools, and grey dots and the grey line show the trend for demographically similar elementary schools throughout Maryland. In 2003, the state migrated from the Maryland School Performance Assessment Program (MSPAP) to the Maryland State Assessment (MSA), which had the effect of increasing the percentage of students scoring “advanced” within almost all schools. In 2001, the red zone elementary schools first received investments (as described above).
The school district’s investments in the red zone schools was associated with a statistically significant 4.9-point increase and a 3.3-point increase in the percentage of fifth grade students in the school who scored “advanced” on the MSA in reading and math, respectively. The red zone investments were not associated with gains in the percentage of students scoring “proficient” relative to demographically similar elementary schools in Maryland. This may be because red zone schools were more likely than their demographically similar school counterparts to raise student performance from the “proficient” to the “advanced” level on the state standardized test. If so, the pattern would be consistent with the school district’s explicit goal that students achieve at the advanced level on the reading state standardized test by grade three, one of the district’s often cited “seven keys to college readiness.”31
Figure 8
To reconcile the seemingly contradictory results shown in Figures 6 and 7 with those shown in Figure 8, recall that public housing students were a small proportion of the total student body in any given school. It is possible, then, that there were distributional effects of red zone investments within red zone schools, such that students not in public housing benefited from investments in ways that the students who lived in public housing did not. Absent detailed data about students who did not live in public housing but attended red zone schools, it is difficult to identify the sources of within-school differences. An insufficient number of students in public housing, for example, attended any single red zone school to conduct subgroup analyses.
Given the boost to scores shown in Figure 8, it is possible that, in the absence of the district’s red zone intervention, the achievement gaps between red zone public housing students and their green zone public housing peers as well as their district-mates would have been even larger. The persistence of the gap in achievement between students in public housing in green and their peers in red zone schools points to the formidable challenge of raising student achievement in disadvantaged schools. It also implies that economic integration could be a more effective tool to improve the achievement of low-income students over the long run than even well-designed and sustained interventions (such as the red zone policy) in needy schools.
Effects of Very Low- to Low-poverty Neighborhoods on Academic Performance
Given the random assignment of families entering public housing to neighborhoods throughout Montgomery County, data from this study also provides information about the effects of poverty in neighborhoods—over and above the effects of schools—on low-income children’s academic achievement. However, the more restricted variation in neighborhood poverty in Montgomery County, as compared to school poverty, narrows the window for the detection of possible neighborhood effects. In a county with approximately 550 neighborhoods (defined here as census block groups), only ten had poverty rates in excess of 20 percent. The prevalence of household poverty in any given neighborhood ranged from 0 percent to 32 percent, but 90 percent of neighborhoods possessed less than 10 percent of households in poverty. Not surprisingly, public housing was overrepresented in the higher-poverty neighborhoods, but only to a limited degree; 20 percent of the 854 children in public housing examined in this study lived in a neighborhood with a poverty rate higher than 10 percent.
Despite limited variability in poverty, living in a neighborhood with 0 percent to 5 percent poverty was suggestive of a modest increase (approximately four points) in math scores for children in public housing and a small (two point) increase in reading scores for children in public housing, relative to children in public housing living in neighborhoods with 5 percent to 28 percent poverty (and after controlling for school poverty levels). These differences in average math scores were statistically significant only at low statistical significance rates of 80 percent or less. It is possible that larger and presumably largely negative neighborhood effects accrue at higher rates of poverty than is possible to study in Montgomery County.
Figure 9
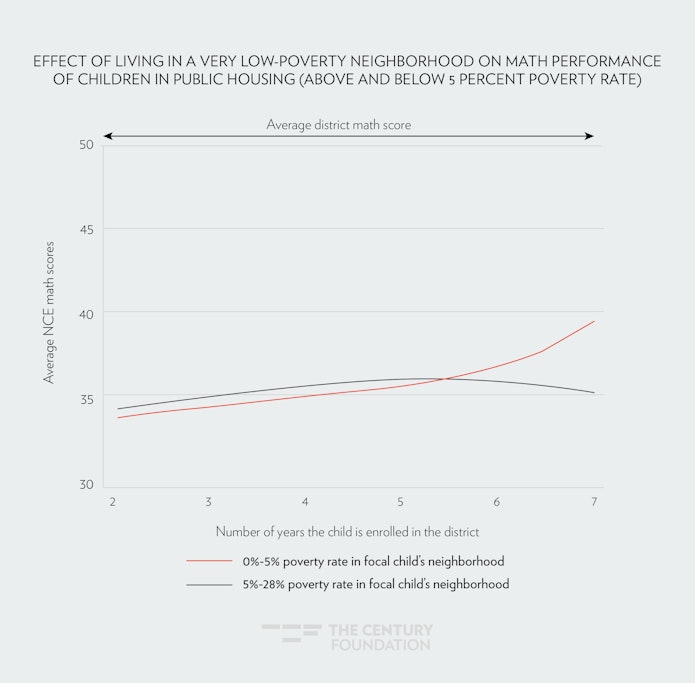
Figure 10
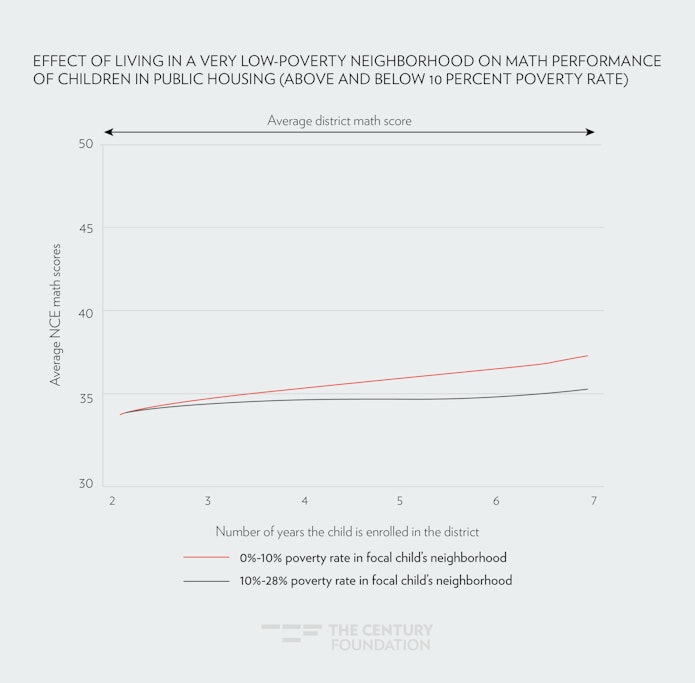
Put side by side, the effect size of living in a very low-poverty versus a low-poverty neighborhood (over and above school poverty rates) is half that of the school poverty effect. This finding is consistent with that of other studies, which have also found smaller neighborhood than school effects on students’ achievement.32 Although the comparison to other studies is limited, because most other neighborhood effects studies typically examine higher poverty rates among neighborhoods than is it possible to do here, this study nevertheless adds to a growing literature that can help policymakers weigh the relative benefits of neighborhood- and school-based interventions on student academic outcomes.
Limitations of the Study
Montgomery County’s random assignment of families to public housing apartments helps to answer with some certainty that, for children in public housing, attending low-poverty schools improved reading and math performance on standardized tests relative to attending moderate-poverty schools. The effect of economic integration in schools on children’s academic achievement also was larger than that of neighborhood economic integration alone.
These results suggest that children from highly disadvantaged circumstances benefit from long-term exposure to advantaged school settings. The integrative housing policy was the means by which children living in public housing gained access to advantaged school settings.
Although households living in Montgomery County’s public housing are quite disadvantaged, there is some indication that they are more advantaged than their counterparts in public housing nationwide. As of 2008, Montgomery County public housing households earned less than one-third of the national average household income, and the vast majority earned incomes that fell below the poverty line. Yet, they earned almost 25 percent more per household member than public housing households nationally (although less than public housing households in the neighboring suburban, but less-advantaged Prince Georges County). Put another way, families living in Montgomery County public housing are among the more advantaged of an extremely disadvantaged public housing population nationally.
Although it is not possible in this study to identify the degree to which public housing families chose Montgomery County based on schooling preferences,33 it is quite likely that the county’s economically integrative housing program promoted academic success for the kind of families in public housing that choose such a setting in the first place. In other words, the results from this study might generalize to other low-income families with a tolerance or a preference for living in suburban, low-poverty locations. In this sense, the most directly correlative populations might be low-income families who have opted in to low-poverty places through private, unsubsidized choices; through federally subsidized housing vouchers or other affordable housing vehicles, such as low-income housing tax credit projects; or through the more than one hundred other inclusionary zoning programs that operate in the United States.34
It also is worth noting that this study tracked the performance of students in public housing up through sixth grade. The study did not follow children through middle or high school, where there conceivably might be different effects from economic integration in neighborhoods or schools. On the one hand, elementary school might be a time when the effects of socioeconomic integration on low-income children are greater, since elementary schools are less likely to sort students internally into academically tracked classes than middle or high schools, where course differentiation is greater, and where exposure to advantaged peers and teachers is potentially more limited. Alternately, if low-income students benefit most from positive peer models in economically integrated schools, research indicates that those effects might be greater at secondary rather than at primary grade levels.35
Review of Findings
Children in public housing who initially were academic equals but attended either a low- or moderate-poverty school were set on two different academic trajectories over the course of elementary school. Comporting with previous studies, I find that length of exposure was the crucial factor mediating the effects of economic integration on children’s performance. After seven years (the end of elementary school), children in public housing in Montgomery County’s most affluent half of elementary schools performed eight points higher in math (0.4 of a standard deviation, p < 0.05) and five points higher in reading (0.2 of a standard deviation, p < 0.20) than otherwise similar children in public housing who attended schools with greater than 20 percent poverty. Within education research, these are large effects since relatively few educational reforms demonstrate positive effects of this magnitude.
Perhaps most important, the children in public housing who attended low-poverty schools began to catch up to their non-poor district-mates over the course of elementary school; by the end, they had cut their initial achievement gap in half. The benefit of attending low-poverty schools held, even though the students in public housing attended math classes and, to a lesser degree, reading classes in which other disadvantaged students within their given school were clustered.
As expected, the academic returns from economic integration diminished as school poverty levels rose. For the low-income children examined in this study, the benefits from economic integration were greatest when they attended schools where less than 20 percent of the students qualified for a free or reduced-price meal. Students also benefited (though to a lesser extent) from attending schools with less than 30 percent of students eligible for subsidized lunch. Students in public housing in schools where 0 percent to 35 percent of students qualified for subsidized meals performed no better over time than those in schools where 35 percent to 85 percent of students qualified for subsidized meals. Without the presence of schools with poverty in excess of 85 percent in any year, it is difficult to identify whether public housing students in the schools with poverty as high as 35 percent would have performed better than students in schools with 85 percent to 100 percent low-income students. Further, since 90 percent of elementary schools in any given year served student populations where less than 60 percent of students qualified for a free or reduced-price meal, the effective comparison described above is between the performance of public housing students in schools where 0 percent to 35 percent of students qualified for subsidized meals to public housing students in schools where 35 percent to 60 percent of students qualified for subsidized meals.
As measured by the district’s own indicator of school need, an indicator that is more nuanced than subsidized meal status, the benefits to students in public housing from attending a low-need school were even greater. After seven years, students in public housing who attended green zone schools, the more-advantaged half of the district’s elementary schools, performed about nine points better in math and eight points better in reading (0.4 of a standard deviation, respectively) than students in public housing who attended red zone schools, the less-advantaged half of the district’s elementary schools. This academic benefit held, even though the school district made large investments in red zone schools, such as extending kindergarten from half-day to full-day, and reducing class sizes, which improved campus test scores relative to other demographically similar elementary schools throughout Maryland during this period of time. This implies that economic integration could be a more effective tool to improve the achievement of low-income students over the long run than even well-designed and sustained interventions such as the one Montgomery County has made in its most impacted schools.
Regardless of the measure of school disadvantage used, this study provides a lower-limit estimate of the effects of economic integration, since there were very few highly disadvantaged schools in Montgomery County against which to compare the low-poverty/low-need schools. For example, less than 1 percent of elementary schools in the district classified as high poverty, compared to 40 percent of urban elementary schools nationally.36 Since student achievement typically is depressed in high-poverty schools, the gaps between the academic performance of children in public housing in low-poverty schools versus those in high-poverty schools might well be larger than the gaps reported here.
In another sense, however, the results of this study provide an upper-limit estimate of the effect of economic integration in neighborhoods and schools on disadvantaged children. The housing-based approach that Montgomery County adopted offered low-income families up to three benefits that each could have contributed to their children’s improved school performance: a supply of affordable housing, which could promote stability; residence in a low-poverty neighborhood; and enrollment of their children in a low-poverty school. The remarkable residential stability of families living in the county’s public housing supplied their children with a strong dose of economic integration in the form of extended exposure to low and moderate poverty levels in their neighborhoods and schools.
Relevance to Other Settings
In many ways, the environment examined here represents a best-case scenario for housing-based economic integration. A group of very low-income students lived in federally subsidized housing that was not only affordable (promoting residential stability), but also was unusually well-dispersed into hundreds of neighborhoods within an especially affluent county. Montgomery County is exceptional in a number of respects, but its circumstances and policy choices forty years ago forecast the current direction of national affordable housing policy and the economic conditions a growing proportion of high-cost, high-tech suburbs have come to experience. To that end, the county’s experience and the results obtained in this study speak to the concerns of at least four audiences: high-cost suburbs that need to attract lower-income workers into their jurisdiction, localities with low but increasing rates of poverty, housing mobility counselors for tenant-based assistance programs, and school districts seeking to mitigate school segregation.
The integration of public housing into non-poor neighborhoods benefited not only the children who lived in public housing over the long run, but it also served several of Montgomery County’s own ends. A review of the politics surrounding the county’s voluntary adoption in the 1970s of integrative housing policies suggests that a combination of altruistic and self-interested motives were at work. As the county’s population rapidly grew in the 1960s and 1970s, a growth in the highly paid, highly skilled workforce spilled over to an attendant demand for lower-skill and lower-wage workers who were steadily priced out of the jurisdiction. Thus, the economically integrative housing policy provided a supply of workers for the county’s lower-wage jobs, an approach to stem the concentration of poverty in any one area of the county, and a solution to public outcry over a heated housing market that was pricing out moderate-income residents. Indeed, the particular mechanism that the county adopted, inclusionary zoning, has become an increasingly popular tool that has spread to high-cost housing markets in other parts of the Washington, D.C., metro area, as well as in California, Massachusetts, New Jersey, New York City, Santa Fe, and Colorado, among other places.37
Over the same period that suburban economies have grown and diversified, the federal government’s affordable housing policies steadily have shifted in emphasis from building and maintaining a supply of low-cost housing via programs such as public housing (supply-side) to subsidizing housing mobility (demand-side). The federal housing voucher program, which provides low-income households with a voucher that they can utilize in the private market anywhere within the United States, began in 1974 and has since grown to become the U.S. Department of Housing and Urban Development’s largest rental assistance program. Today, the housing voucher program serves about 1.5 million households, whereas only 1.2 million households live in public housing. As the housing voucher program has matured, housing authorities increasingly have appreciated the need for housing mobility counseling that goes beyond statutory requirements (which overlooks the role schools play in voucher families’ selection of neighborhoods) to educate voucher recipients more meaningfully about their mobility options. Better information about how low-income children have fared in suburban districts and in schools of varying poverty levels could provide useful guidance for low-income households as they weigh their residential options.
Housing and education have traditionally been considered the primary instruments of social mobility in the United States.38 Since education is an investment with both individual and societal benefits, improving low-income students’ school achievement via integrative housing is a tool that not only can reduce the income achievement gap but also help stem future poverty. Furthermore, the experience of Montgomery County shows that it can be in the self interest of both localities and low-income families to create economically integrated neighborhoods and schools.
Although most education research attempts to quantify the effects of various promising school-based reforms for low-income children, many of which Montgomery County has embraced—for example, full-day kindergarten, smaller class sizes in early grades, a balanced literacy curriculum, increased professional development—the results from this study suggest that the efforts to enroll low-income children in low-poverty schools has proven even more powerful. Although the county’s inclusionary zoning policy occurs outside the school walls, it has had a powerful educational impact, even as measured by the most demanding but perhaps most meaningful test. Namely, that over the course of elementary school, highly disadvantaged children with access to the district’s lowest-poverty neighborhoods and schools began to catch up to their non-poor, high-performing peers, while similar disadvantaged children without such access did not.
Download Appendices Here
Notes
- D. Rusk, “Trends in School Segregation,” in Divided We Fail: Coming Together through School Choice: The Report of The Century Foundation Task Force on The Common School (New York: The Century Foundation Press, 2002).
- S. Childress, D. Doyle, and D. Thomas, Leading for Equity: The Pursuit of Excellence in Montgomery County Public Schools (Cambridge, Mass.: Harvard Education Press, 2009).
- M. Birnbaum, “Montgomery Schools Add to their A+ Reputation; System Will Be Paid to Create Curriculum, which Firm Will Sell,” Washington Post, June 9, 2010, A1.
- Digest of Education Statistics, Table 42, Institute of Education Statistics, U.S. Department of Education, 2009, http://nces.ed.gov/programs/digest/d09/tables/dt09_042.asp.
- H. Schwartz and M. Wachs, “Inclusionary Zoning and Schools,” Report for the MacArthur Foundation (ongoing).
- High-poverty schools are here defined as those with 75 percent or higher concentrations of students who qualify for a free or reduced-price meal (those who come from families making less than 185 percent of the poverty line). Fifty-five percent of fourth graders and 47 percent of eighth graders scored “below basic” on the National Assessment of Educational Progress in 2009 in high-poverty schools, whereas 17 percent of fourth graders and 13 percent of eighth graders scored “below basic” from schools were less than 20 percent of students qualified for a free or reduced-price meal. S. Aud, W. Hussar, M. Planty, T. Snyder, K. Bianco, M. Fox, L. Frohlich, J. Kemp, and L. Drake, The Condition of Education 2010, NCES 2010-028 (Washington, D.C.: National Center for Education Statistics, 2010).
- Ibid.
- See L. Rubinowitz and J. Rosenbaum, Crossing the Class and Color Lines (Chicago: University of Chicago Press, 2000) for details of the Gautreaux case. In a 1989 survey that compared families in public housing who had moved eight to thirteen years earlier to white Chicago neighborhoods, versus families in public housing who had moved around the same time to white neighborhoods in Chicago’s suburbs, children of African-American suburban movers were more likely to have not dropped out of school (20 percent versus 5 percent), were more likely to be in college-track classes (24 percent versus 40 percent), were more likely to attend college (21 percent versus 54 percent), and more likely to attend a four-year college (4 percent versus 27 percent).
- Lisa Sanbonmatsu, Jeffrey R. Kling, Greg J. Duncan, Jeanne Brooks-Gunn, “Neighborhoods and Academic Achievement: Results from the Moving to Opportunity Experiment,” Working Paper 11909, National Bureau of Economic Research, Cambridge, Mass., January 2006, 18 and 45, Table 2. For the full evaluation of Moving to Opportunity, see L. Orr, J. Feins, R. Jacob, E. Beecroft, L. Sanbonmatsu, L. Katz, J. Liebman, and J. Kling, Moving to Opportunity Interim Impacts Evaluation (Washington, D.C.: U.S. Department of Housing and Urban Development, 2003), http://www.huduser.org/Publications/pdf/MTOFullReport.pdf. For further research regarding schools and Moving to Opportunity, see Lisa Sanbonmatsu, Jeffrey R. Kling, Greg J. Duncan, Jeanne Brooks-Gunn, “Neighborhoods and Academic Achievement: Results from the Moving to Opportunity Experiment,” NBER Working Paper 11909, National Bureau of Economic Research, Cambridge, Mass., January 2006, 18 and 45, Table 2.
- D. L. Harding, L. Gennetian, C. Winship, L. Sanbonmatsu, and J. R. Kling, “Unpacking Neighborhood Influences on Education Outcomes: Setting the Stage for Future Research,” Working Paper 16055, National Bureau of Economic Research, Cambridge, Mass., June 2010; G. J. Duncan and K. A. Magnuson, “Can Family Socioeconomic Resources Account for Racial and Ethnic Test Score Gaps? The Future of Children 15, no. 1 (2005): 35–54; G. J. Duncan and J. Brooks-Gunn, “The Effects of Poverty on Children,” The Future of Children 7, no. 2 (1997): 55–71; C. Jencks and S. Mayer, “The Social Consequences of Growing Up in a Poor Neighborhood, in Inner-City Poverty in the United States, ed. Laurence E. Lynn, Jr., and Michael G. H. McGeary (Washington, D.C.: National Academy Press, 1990), 111–86.
- For studies on teacher sorting, see B. A. Jacob, “The Challenges of Staffing Urban Schools with Effective Teachers,” The Future of Children 17, no. 1 (2007): 129–53; E. A. Hanushek, J. F. Kain, and S. G. Rivkin, “Why Public Schools Lose Teachers,” The Journal of Human Resources 39, no. 2 (2004): 326–54; E. A. Hanushek, J. F. Kain, and S. G. Rivkin, “Teachers, Schools, and Academic Achievement,” Econometrica 73, no. 2 (2005): 417–58; D. Boyd, H. Lankford, S. Loeb, and J. Wyckoff, “The Draw of Home: How Teachers’ Preferences for Proximity Disadvantage Urban Schools,” Journal of Policy Analysis and Management 24, no. 1 (2005): 113–32; D. Boyd, H. Lankford, S. Loeb, and J. Wyckoff, “Explaining the Short Careers of High-achieving Teachers in Schools with Low-performing Students,” American Economic Review 95, no. 2 (2005): 166–71; B. Scafidi, D. L. Sjoquist, and T. R. Stinebrickner, “Race, Poverty, and Teacher Mobility,” Economics of Education Review 26 (2007): 145–59; and R. P. Strauss, L. R. Bowes, M. S. Marks, and M. R. Plesko, “Improving Teacher Preparation and Selection: Lessons from the Pennsylvania Experience,” Economics of Education Review 19, no. 4 (2000): 387–415. For studies on student absenteeism and mobility, see Committee on the Impact of Mobility and Change on the Lives of Young Children, Schools, and Neighborhoods, “Student Mobility: Exploring the Impact of Frequent Moves on Achievement: Summary of a Workshop,” National Academies Press, 2010, http://www.nap.edu/catalog/12853.html (accessed on July 12, 2010); Hanushek, Kain, and Rivkin, “Why Public Schools Lose Teachers”; R. W. Rumberger and K. A. Larson, “Student Mobility and the Increased Risk of High School Dropout,” American Journal of Education 107, no. 1 (1998): 1–35; C. A. Kearney, “School Absenteeism and School Refusal Behavior in Youth: A Contemporary Review,” Clinical Psychology Review 28, no. 3 (2008.): 451–71. For ethnographic studies about high poverty school environments, see J. M. Parr and M. A. R. Townsend, “Environments, Processes, and Mechanisms in Peer Learning,” International Journal of Educational Research 37 (2002): 403–23; M. Thrupp, “A Decade of Reform in New Zealand Education: Where to Now? Introduction,” New Zealand Journal of Educational Studies 34, no. 1 (1999): 5–7; M. Thrupp, “Education Policy and Social Change,” British Journal of Sociology of Education 23, no. 2 (2002): 321–32. For studies about parental interactions with schools, see A. Lareau and E. M. Horvat, “Moments of Social Inclusion and Exclusion: Race, Class, and Social Capital in Family-School Relationships,” Sociology of Education 72, no. 1 (1999): 37–53; E. M. Horvat, E. B. Weininger, and A. Lareau, “From Social Ties to Social Capital: Class Differences in the Relations between Schools and Parent Networks,” American Educational Research Journal 40, no. 2 (2003): 319–51. For studies about teacher expectations and student-teacher interactions, see A. Lareau, “Social Class Differences in Family-School Relationships: The Importance of Cultural Capital,” Sociology of Education 60, no. 2 (1987): 73–85; S. Lasky, “The Cultural and Emotional Politics of Teacher-Parent Interactions,” Teaching and Teacher Education 16, no. 8 (2000): 843–60; P. Hauser-Cram, S. R. Sirin, and D. Stipek, “When Teachers’ and Parents’ Values Differ: Teachers’ Ratings of Academic Competence in Children from Low-income Families,” Journal of Educational Psychology 95, no. 4 (2003): 813–20; I. A. G. Wilkinson, “Introduction: Peer Influences on Learning: Where Are They?” International Journal of Educational Research 37 (2002): 395–401; M. L. Pittinsky, “Smart by (Perceived) Association: Cognitive Social Networks and Teacher Academic Judgments,” PhD dissertation, Columbia University, 2008; and B. F. Chorzempa and S. Graham, “Primary-grade Teachers’ Use of Within-class Ability Grouping in Reading,” Journal of Educational Psychology 98, no. 3 (2006.): 529–41
- R. Hess, Spinning Wheels: The Politics of Urban School Reform (Washington, D.C.: Brookings Institution Press, 1999).
- A number of studies find a link between achievement levels and school socioeconomic status above and beyond the effect of family socioeconomic status. For a summary, see e.g. Richard D. Kahlenberg, All Together Now: Creating Middle Class Schools through Public School Choice,” (Washington, D.C.: Brookings Institution Press, 2001), 25–42, and Richard D. Kahlenberg, “Turnaround Schools that Work: Moving beyond Separate but Equal,” Agenda Brief, The Century Foundation, 2009, 7–10. Some of these studies attempt to control for self-selection. But studies of specific interventions for socioeconomic (as opposed to racial) integration are rare.
- Approximately sixty school districts that collectively educate four million students have adopted some form of economic integration policy, up from two districts in 2000 (Kahlenberg, “Turnaround Schools that Work”).
- This has proved a challenge to researching the impacts of optional inter-district enrollment programs such as Boston’s Metco program and the Voluntary Interdistrict Choice Corporation in St. Louis, Missouri.
- Jim Mann and Kirk Sharfenberg, “Montgomery Eyes Methods to Solve Housing Crisis,” Washington Post, March 11, 1971, F1.
- Neighborhoods are defined in this study as census block groups, which respectively house about 500 households per block group and are approximately 0.25 square miles each.
- Note that the maximum rate of poverty in any given school that a public housing student attended varied by school year. In 2001, public housing students attended five elementary schools where the percent of students who qualified for a free or reduced price meal exceeded 65 percent. In 2002, 2004, and 2005, four schools met this criterion, while in 2003, students in public housing attended three such schools. In 2006, students in public housing attended one school that met this criterion, and then two schools in 2007. For consistency, and to keep every possible school in the analysis, the graphs below show school poverty ranges up to 85 percent, which is the highest poverty rate in any single elementary school that a public housing child attended in any year from 2001 to 2007. It should be noted, however, that only one school out of 114 attended had a poverty rate in excess of 80 percent, and up to three schools in any given year had a poverty rate of 70 percent to 80 percent
- Our Call to Action (Rockville, Md.: Montgomery County Public Schools, 1999).
- Early Success Performance Plan: Educational Reform in Montgomery County Public Schools (Rockville, Md.: Montgomery County Public Schools, May 2003), http://www.montgomeryschoolsmd.org/info/CTBS2003/PDF/EarlySuccessPerformancePlan.pdf.
- For a history and description of inclusionary zoning, see David Rusk, Inside Game/Outside Game: Winning Strategies for Saving Urban America (Washington D.C.: Brookings Institution Press, 2001), and Robert Burchell, et al., “Inclusionary Zoning: A Viable Solution to the Affordable Housing Crisis?” New Century Housing 1, no. 2 (2000).
- Since the housing authority does not track rejected offers, this statistic was derived from six months of offers made during 2008.
- To validate findings, the study also examined a second set of low-income children: 3,200 children whose families used a federally-subsidized housing voucher to rent an apartment in Montgomery County during 2001–07. Unlike public housing, however, these families were not randomly assigned to neighborhoods or schools, so their results are not discussed here. However, these children’s outcomes were consistent with those described for public housing children.
- Since children were not tested until the second grade in Montgomery County, too few public housing children had test scores prior to two years enrollment in the district (that is, only those who first ported into the district at grade levels higher than kindergarten) to derive estimates.
- For example, having a teacher with less than two full years of experience was associated with a reduction of student test score gains in math and reading of approximately 0.1 of a standard deviation (Hanushek, Rivkin, and Kain, “Teachers, Schools, and Academic Achievement,” for children in Texas; T. J. Kane and D. O. Staiger, “Using Imperfect Information to Identify Effective Teachers,” unpublished paper, School of Public Affairs, University of California–Los Angeles, 2005 for children in Los Angeles; and J. E. Rockoff, “The Impact of Individual Teachers on Student Achievement: Evidence from Panel Data,” American Economic Review 94, no. 2 (2004): 247–52
for children in two New Jersey districts). A teacher’s cognitive ability (as measured by performance on teacher exams or standardized tests like ACT or SAT) positively impacted student performance; having a teacher whose test score on the state’s teacher test was at the top or bottom of the distribution of teachers’ scores had a modest effect (+/- 0.06 of a standard deviation) (see also Jacob, “The Challenges of Staffing Urban Schools with Effective Teachers,”; C. T. Clotfelter, H. F. Ladd, and J. Vigdor. “Teacher Credentials and Student Achievement: Longitudinal Analysis with Student Fixed Effects,” Economics of Education Review 26, no. 6 (2007): 673–82). - Aud et al., The Condition of Education 2010; Kahlenberg, All Together Now, 39–40, citing Jonathan Crane, “The Epidemic Theory of Ghettos and Neighborhood Effects on Dropping Out and Teenage Childbearing,,” American Journal of Sociology 96, no. 5 (1991): 1226–59, and Dennis P. Hogan and Evelyn M. Kitagawa, “The Impact of Social Status, Family Structure, and Neighborhood on the Fertility of Black Adolescents,” American Journal of Sociology 90, no. 4 (1985): 825–855.
- Two studies of Texas and Georgia teachers suggest that the percentage of black students within the school and students’ academic performance are respectively the two most important predictors of teacher mobility, followed by the economic composition of the student body (Hanushek, Kain, and Rivkin, “Why Public Schools Lose Teachers”; Scafidi, Sjoquist, and Stinebrickner, “Race, Poverty, and Teacher Mobility”).
- During the study period, the school district had a global gifted and talented screening process for all second graders as well as for students who ported into the district in third through fifth grades.
- Initial gaps in public housing students’ reading and math scores between green and red zone schools are not statistically significant at the p < 0.20 level.
- As described in the technical appendix, public housing children’s test scores were regressed on their prior school year’s status (in this case, attendance at a red zone or green zone school). Thus, for children who had seven years of data, children’s sixth grade scores (which was the first year of middle school) were regressed on their fifth grade red zone status, which was the last grade level in their elementary school
- Our Call to Action.
- P. Jargowsky, and M. El Komi, “Before or After the Bell? School Context and Neighborhood Effects on Student Achievement,” Working Paper 28, National Center for Analysis of Longitudinal Data in Education Research, Urban Institute, 2009.
- For example, Montgomery County has the highest proportion of three bedroom public housing apartments among the trio of Prince Georges and Washington, D.C., public housing portfolios. This makes Montgomery County a draw for larger sized households, who may or may not have a preference for Montgomery County’s public school system.
- For information about the expansion of inclusionary zoning, see David Rusk, “Nine Lessons for Inclusionary Zoning,” Keynote remarks, National Inclusionary Housing Conference, Washington, D.C., 2005, http://www.gamaliel.org/DavidRusk/keynote%2010-5-05.pdf.
- Kahlenberg, All Together Now, 114, citing Gary Orfield and Susan E. Eaton, Dismantling Desegregation: The Quiet Reversal of Brown v. Board of Education (New York: New Press, 1996), 93; Nina S. Mounts and Laurence Steinberg, “An Ecological Analysis of Peer Influence on Adolescent Grade Point Average and Drug Use,” Developmental Psychology 31, no. 6 (November 1995): 915–22.
- Aud et al., The Condition of Education 2010.
- For information about the expansion of inclusionary zoning, see Rusk, “Nine Lessons for Inclusionary Zoning.”
- J. Bellush and M. Hausknecht, “Public Housing: The Contexts of Failure,” in Housing Urban America, ed. J. Pynoos, R. Schafer, and C. Hartman (Chicago, Ill.: Aldine Publishing Company, 1967), 116.