
Recently, House Republican leadership released talking points outlining its plan to “replace” the Affordable Care Act (ACA).1 A key element of this plan is a new program—State Innovation Grants—that could fund high-risk pools to cover people with pre-existing conditions. Historically, high-risk pools served as an alternative to guaranteed access to broad-based private insurance for people with pre-existing conditions. The rationale behind such pools is to insure these individuals separately, thus preventing their high costs from raising premiums for others. Yet, researchers have found that the performance of high-risk pools often suffer from insufficient funding, constraints on eligibility, and gaps in coverage.2
The ACA itself offers additional insight into high-risk pools and, as this report documents, their flaws. The law created a temporary high-risk pool called the Pre-existing Condition Insurance Plan (PCIP) to operate until 2014, the start-date of reforms prohibiting insurers from denying coverage to people with pre-existing conditions. PCIP addressed the major criticisms of high-risk pools: it had no waiting periods, no annual or lifetime limits on coverage, market average premiums, comprehensive benefits, and $5 billion in federal funding. This report assesses PCIP through both a first-hand account of the program’s implementation and new data analysis.
Even though PCIP architects had designed the program to avoid the most commonly anticipated pitfalls of high-risk pools, this most recent program did not efficiently or effectively expand coverage to uninsured people with pre-existing conditions, nor did it lower premiums in the individual market. Specifically, PCIP suffered from:
- Severe management challenges. Challenges in predicting demand for enrollment and costs per enrollee led to frequent operational changes to accelerate or slow high-risk pool spending. Moreover, because of the lack of competition and incentives for providers to negotiate discounts, PCIP had to resort to regulation to lower the prices it paid for services—a tool few state high-risk pools would have at their disposal.
- Limited enrollment—which meant a limited impact on individual market premiums. Despite comprehensive benefits, premiums set without medical underwriting, and aggressive outreach, PCIP enrollment represented, only 0.8 to 1.6 percent of the 8.2 to 17.9 million uninsured people with pre-existing conditions in 2010.3 This meager enrollment could not have had an appreciable effect on premiums in the individual insurance market.
- Unpredictable costs across and within states. Claims costs per enrollee in PCIP differed dramatically both across states and within states over time. In fact, the high-risk pool experienced twice the gap between high and low claims per enrollee as premiums in the individual Health Insurance Marketplace.4 This led to a mismatch between pre-set allotments of the federal funding available to states and actual program spending. Specifically, actual spending was twice as high as the financial allotment in New Hampshire, but it was less than half as much as allotments in seventeen other states. Thirty-seven states had spending that was more than 20 percent higher or lower than their allotments. Had federal funding been allocated through a per-capita cap approach, thirteen states still would have had spending that was more than 20 percent higher or lower than this type of allocation—a major challenge for any program manager, which could lead to reduced coverage or higher premiums for enrollees.
This report offers new analysis of this ACA experience with high-risk pools along these dimensions. It explains why simply securing adequate funding, as some have suggested, may not make high-risk pools work.5 And, given the management challenges prior to the 2014 market reforms, the report suggests an even lower probability of success for high-risk pools now that an estimated 3.6 million previously uninsured people with pre-existing conditions have gained coverage.6 It concludes with a discussion of alternative types of high-risk pools and uses of funding that could better improve coverage and affordability.
The Difficulty of High-Risk Pool Implementation
As part of his effort to embrace Republican health reform ideas, President Obama announced in 2009 his support for temporary high-risk pools as a bridge to 2014, when the full range of his administration’s health care policies were anticipated to take effect.7
In these PCIP high-risk pools, people who were uninsured for the previous six months, had a pre-existing condition or denial by an insurance company, and were U.S. citizens or legal residents, qualified for health care coverage with no waiting period (a common feature of other high-risk pools). Enrollees paid premiums that did not vary based on their health status and were based on the average premium in the market, but also were not subsidized based on income: the legislation provided $5 billion in general revenue to fund claims costs above premium revenue. PCIP plans covered 65 percent of the costs of comprehensive benefits, and included an annual out-of-pocket limit. The $5 billion was to be divided among states in allotments based on the formula used for the Children’s Health Insurance Program (CHIP) that includes nonelderly population, nonelderly uninsured, and geographic cost. Twenty-seven states chose to run their own programs, while twenty-three states and the District of Columbia opted to have the Department of Health and Human Services (HHS) run the program for them. PCIP started covering people in most states on August 1, 2010—just over four months after the ACA was signed into law.8 Given the need of this vulnerable group, the Obama Administration implementation of this component of the law.
The Actuary for the Centers for Medicare & Medicaid Services (CMS) projected in April 2010 that 375,000 people would quickly sign up for PCIP, and its $5 billion would be exhausted by 2011 or 2012 (years short of 2014).9 In light of this concern, some of the initial eligibility rules were drawn tightly; requiring applicants to provide documentation of their pre-existing condition and including “anti-dumping” rules to prevent employers and insurance companies from steering current enrollees to PCIP.10
However, in the first six months of operation, few people signed up for coverage. As such, HHS launched an aggressive outreach campaign in the spring of 2011, which included over 1,600 actions, from conducting webinars to advertising at health fairs to strategic partnership with hospitals, Social Security offices, insurers, community groups, and agents and brokers. HHS also dropped some of the eligibility rules, such as requiring a doctor’s note about a pre-existing condition to facilitate enrollment.
Despite this slow start in enrollment, concerns about rising costs in PCIP resurfaced in 2012. A report on the program found that about 4 percent of enrollees accounted for 50 percent of costs, with those enrollees having average annual claims costs of $225,000.11 Losses were projected to be as high as $2 billion. This led to cost-saving measures in the federally run program, such as ending its payment of referral fees to insurance agents and brokers in May 2012.12 In August, it changed its provider network, tightened access to specialty drugs, and sought additional hospital discounts—changes that reflected the challenge program administrators experienced in securing affordable prices, given the nature of its enrollees and no opportunity for choice and competition. Simply put, with no competition and government backing of claims, providers sought top dollar for payments. These voluntary strategies, despite the backing of a regulation, did not significantly lower costs.
Out of abundance of caution, HHS stopped accepting applications on February 15, 2013, and state-run programs followed suit on March 2. The rationale was to ensure that people already enrolled had sufficient funds to remain covered until 2014, when new coverage options would start. Moreover, HHS issued an interim final rule in May 2013 that limited its payments for most services to Medicare rates or 50 percent of reasonable rates. It prevented cost-shifting excess charges to enrollees.13 These changes were considered extremely aggressive at the time, and were only possible with the backing of a regulation.
Yet, this set of actions also overshot the target. Enrollment dropped off precipitously after this enrollment freeze due to attrition, as individuals either left for another source of coverage or went uninsured. And residual claims costs came in lower than projected. As such, nearly $400 million of the $5 billion was not spent at the conclusion of the program in 2014. This led CMS to seek comments in August 2016 on ways this leftover funding could be spent consistent with the intent of the program.14
The fits and starts of managing PCIP has its basis in the variability in enrollment, spending per enrollee, and overall costs—and this all occurred under a presidential administration committed to making the program work.
The Problems with High-Risk Pool Enrollment
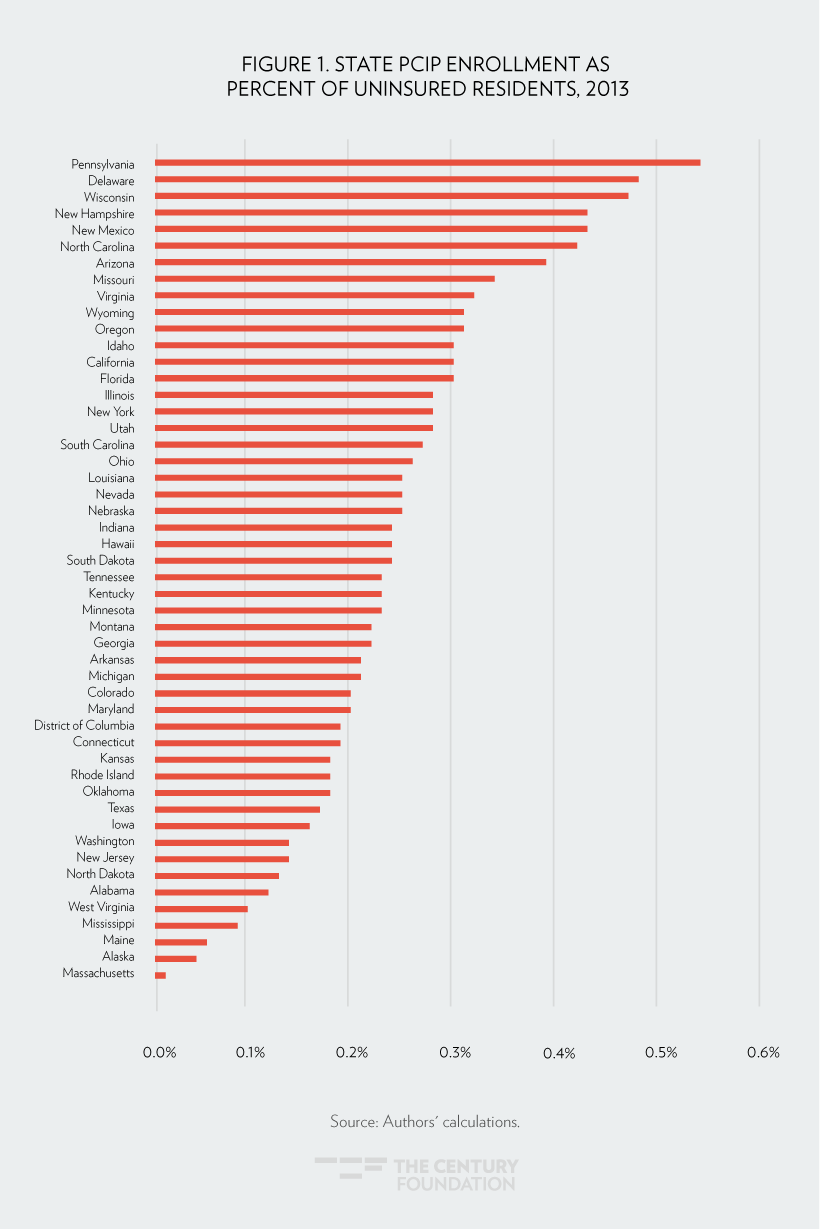
At its peak, enrollment in PCIP was 115,000, about one-third of the CMS Actuary’s estimate.15 Cumulatively, about 135,000 people were served by the program. PCIP enrollment represented, at most, 0.8 to 1.6 percent of the 8.2 to 17.9 million uninsured people with pre-existing conditions in 2010.16 Some of this low participation likely resulted from lack of income-based financial assistance; PCIP, like other high-risk pools, was not designed as low-income subsidy program. (Problematically, this low enrollment would mean the program could have no measurable effect on premiums for those in the individual market.)
Enrollment was not easily predictable based on a state’s need. For example, Arizona’s PCIP enrollment was larger than that of Ohio, which had more uninsured residents in 2013Yet, it was only slightly below that of New York, which despite over 50 percent more uninsured residents, had options that pre-dated PCIP for people with pre-existing conditions. Missouri enrollment exceeded that of Indiana and Tennessee, despite its much lower number of uninsured residents. Figure 1 shows the state PCIP enrollment as a share of each state’s uninsured population in 2013.17

High-Risk Pool Spending Per Enrollee Varied, Making Budgeting Difficult
Total PCIP program costs reflect the cost per enrollee, as well as the number of enrollees. Not surprisingly, the cost and utilization of health care among PCIP enrollees was significantly higher than that of other populations. For example, a 2012 report by HHS found that PCIP enrollees had 1.5 times more office visits, emergency room visits, and procedures as Federal Employees Health Benefit Program (FEHBP) enrollees, and 3.5 times greater likelihood of having claims exceeding $10,000. It also reported that its enrollees had 2.5 times higher claims per person compared to pre-ACA state high-risk pools.18
Compounding management challenges, however, was significant variation in spending, both across and within states. Figure 2 shows a snapshot of the last quarter of claims spending per enrollee in 2011 and 2012. The amount ranged from a low of about $1,600 (North Carolina) to a high of $135,900 (Vermont) for this three-month period of time.19 Even removing the outliers, the highest claims per enrollee (Idaho: $12,800) was eight times higher than the lowest claims per enrollee (North Carolina: $1,600). Note, the costs reported here and throughout this report are claims costs, which are not inclusive of administrative costs.
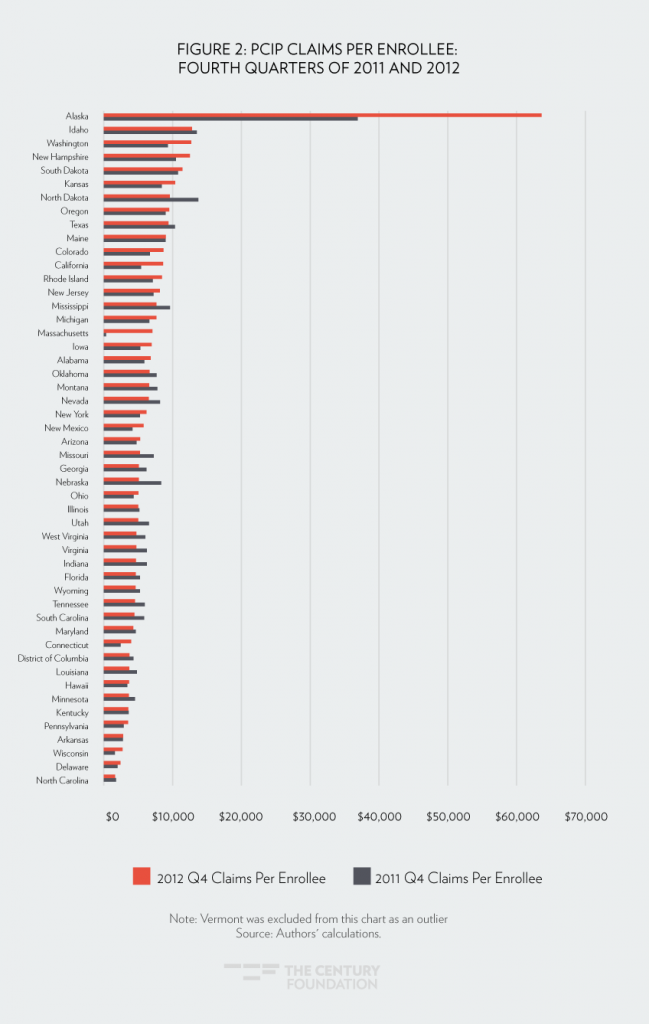
This variation cannot be attributed to different state program designs. Looking just at the states where the federal government ran the program with uniform benefits, eligibility rules, and cost management tools, there was still a 5.3-fold different between the highest and lowest quarterly claims per enrollee. To put this in perspective, the difference between the highest and lowest annual state Health Insurance Marketplace premiums for 2017 was 3.9—PCIP variation was twice as large.20
Strikingly, PCIP’s claims per enrollee also changed dramatically within states over time. Comparing the last quarter of 2011 to that of 2012, thirteen states experienced a 20 percent or greater decrease in claims per enrollee, while eleven states experienced a 20 percent or greater increase. Such fluctuations make it difficult for state and federal officials to budget for program costs.
It is not surprising, given these disparities in enrollment and per-enrollee spending, that overall and state-level spending was dramatically different than predicted (see Figure 3). As described earlier, in 2010, each state was given an allotment from the $5 billion in federal funding for planning purposes. However, actual spending was over twice as high as the pre-set allotment in New Hampshire, and it was half of the pre-set allotments in seventeen other states. Thirty-seven states had spending that was over 20 percent higher or lower than their allotments.
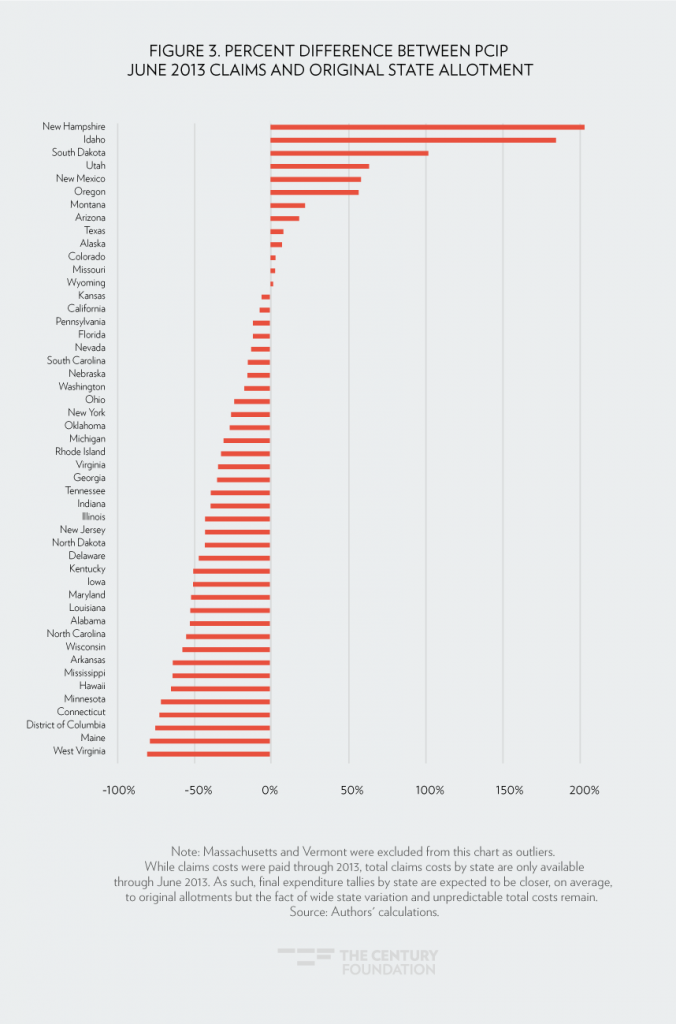
This wide discrepancy existed even looking only at states in the federally run PCIP. Idaho’s spending was 85 percent above its allotment, with nine other states (including Vermont and Massachusetts) having spending that was half or lower than their allotments.
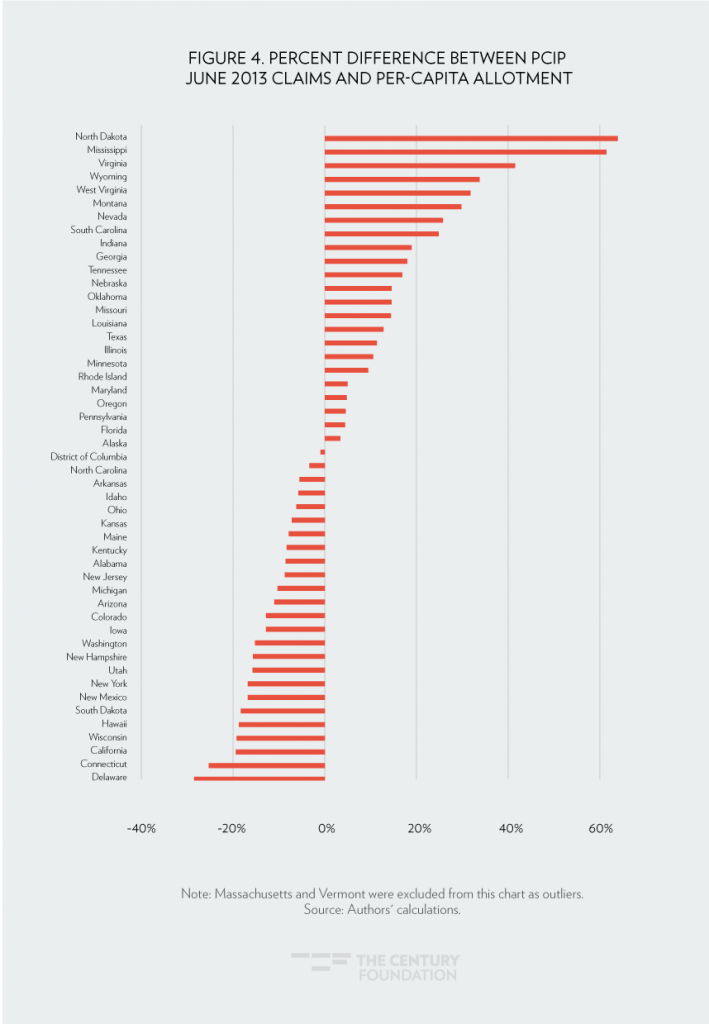
We decided to see if federal funding could have been better allocated to states’ PCIP costs using a per-capita formula. (Per-capita caps for Medicaid were part of Speaker Ryan’s “Better Way” plan, and are described in the most recent briefing document for this year’s repeal and replace debate.) To model this approach, we took actual claims cost per enrollee for the last quarter of 2011 and multiplied these amounts, accounting for yearly general inflation (assuming 3 percent), by actual enrollment. This formula automatically adjusts spending for monthly program participation. In Figure 4, we compare actual spending in June 2013 with this per-capita cap approach to budgeting.
Wide variation still persisted under a per-capita cap approach: nine states would have had claims 20 percent or greater above their caps, while four states would have had claims 20 percent or more below their caps. It is also interesting that different states would have had insufficient funding under the alternative allocation formulas. States such as Arkansas, Ohio, Kentucky, and Wisconsin, for example, would have had spending in 2013 that exceeded their per-capita cap, whereas they had extra funding under the pre-set PCIP allotments. What is clear is that per capita allotments do not solve the problem of financial unpredictability, and still would leave states and individuals at substantial risk.
To summarize, the unpredictability of both per-enrollee costs and participation in PCIP—despite its sufficient funding and comprehensive coverage—suggests that separate high-risk pools are an inefficient as well as an ineffective means of covering people with pre-existing conditions.
Conclusion and Recommendations
PCIP provided much-needed coverage to over 100,000 uninsured people in the run-up to the comprehensive reforms that took hold in 2014, although the extent of its assistance was significantly less than anticipated. In providing this coverage, the program attempted to address previous design flaws with high-risk pools. Yet, this temporary high-risk pool required intense management and oversight, suffered from ebbs and flows in spending and enrollment, and ultimately did little to extend coverage and consequently lower premiums in the individual market. Given this experience, policy makers may be hard pressed to identify program design changes to high-risk pools to improve their probability of success.
The challenge of making high-risk pools effective is compounded by implementation of the ACA, which has resulted in millions of uninsured people with pre-existing conditions entering into the individual market rather than remaining uninsured. As such, if a state now wants to create a separate high-risk pool, it would have to decide whether it would move such individuals out of the individual market—which would potentially lower the premiums for those that remain—and, if so, how. For example, would coverage be ended in the individual market and shifted to a separate pool whenever an enrollee receives a certain diagnosis or has claims that exceed a certain threshold? Would enrollees have a choice to stay in their current plan and, if not, would they receive the same benefits, providers, and continuity of care? If the separate risk pool were only for new applicants who were previously uninsured, how would it be viable or accomplish the policy goals of the program, given that its number of potentially eligible people would be even smaller than that of traditional high-risk pools or PCIP? These are not minor questions.
The House Republicans suggest that State Innovation Grants may not necessarily be “tied to a separate risk pooling mechanism.” The American Academy of Actuaries recently outlined alternative forms of risk pooling consistent with this approach.21 One option would be to create a high-risk pool reimbursement program that keeps the enrollee in the broad individual market while paying for a portion of claims above a specified dollar amount. This is similar to the ACA’s temporary reinsurance program. Another option would be to reimburse claims for enrollees with a given set of conditions. Either approach would alleviate the separate risk pools’ problems of low participation, difficulty in securing price discounts, limited administrative efficiencies, and workable funding allocations. That said, as with any proposals, the details would affect such programs’ ability to efficiently and effectively cover people with pre-existing conditions. For example, while these two approaches would alleviate a number of the problems of a segregated high-risk pool, earlier versions of “replace” policy outlines have not included funding anywhere close to that necessary to achieve the policy goal of comprehensive, affordable individual market coverage.
In closing, ensuring access to health coverage and health care for people with pre-existing conditions is widely supported across the political spectrum and across the nation. This reflects the reality that, at some point, we all need health care—and we do not necessarily know when that time will come. Insurance by definition is supposed to provide such protections, which is why prohibiting the denial of coverage and higher premiums due to pre-existing conditions were included in the ACA’s reforms. Evidence shows that the law’s reforms are working, with access to health care along with health outcomes improving.22 As such, while changes to expand affordability, accessibility, and quality of health care should be debated, changes must be judged from the standpoint of current law, including the ACA’s protections for people with pre-existing conditions.
A summary of this report appeared in Health Affairs on February 28, 2017.
Notes
- U.S. House of Representatives, “Obamacare Repeal and Replace: Policy Brief and Resources,” U.S. Congress, February 16, 2017, http://static.politico.com/0b/25/a498c2ab47b584ef53e8e72149f6/healthcare-policy-brief.pdf.
- Lynn A. Blewett, Donna Spencer, and Courtney E. Burke, “State High-Risk Pools: An Update on the Minnesota Comprehensive Health Association,” American Journal of Public Health, Jean P. Hall, “Realizing Health Reform’s Potential: Why a National High-Risk Insurance Pool Is Not a Workable Alternative to the Marketplace,” The Commonwealth Fund, December 2014, http://www.commonwealthfund.org/publications/issue-briefs/2014/dec/national-high-risk-insurance-pool.
- Authors’ calculation of PCIP enrollment divided into the range of the number of uninsured people with pre-existing conditions in 2010 as estimated in U.S. Department of Health and Human Services, “Health Insurance Coverage for People with Pre-Existing Conditions: Impact of the Affordable Care Act,” Assistant Secretary for Planning and Evaluation Issue Brief, January 5, 2017, https://aspe.hhs.gov/system/files/pdf/255396/Pre-ExistingConditions.pdf.
- Authors’ calculation of PCIP data and State Health Facts, “Monthly Silver Plan Premium for a 40-Year Old Non-Smoker Making $30,000 / Year,” 2017, Kaiser Family Foundation, http://kff.org/other/state-indicator/monthly-silver-premiums-for-a-40-year-old-non-smoker-making-30000year/?currentTimeframe=0.
- Joseph R. Antos, “Health Care Reform After the ACA,” New England Journal of Medicine, 2014; 370:2259-2261, http://www.nejm.org/doi/full/10.1056/NEJMp1404298; James C. Capretta and Tom Miller, “How to Cover Pre-existing Conditions,” National Affairs, 2010, 4: 110–126, http://www.nationalaffairs.com/publications/detail/how-to-cover-pre-existing-conditions.
- U.S. Department of Health and Human Services, “Health Insurance Coverage for People with Pre-Existing Conditions: Impact of the Affordable Care Act,” Assistant Secretary for Planning and Evaluation Issue Brief, January 5, 2017, https://aspe.hhs.gov/system/files/pdf/255396/Pre-ExistingConditions.pdf.
- President Barack Obama, “Remarks by the President to a Joint Session of Congress on Health Care,” The White House, September 9, 2009, https://obamawhitehouse.archives.gov/the-press-office/remarks-president-a-joint-session-congress-health-care.
- Program descriptions, regulations, and fact sheets available at Center for Consumer Information & Insurance Oversight page of the CMS website, https://www.cms.gov/CCIIO/Programs-and-Initiatives/Insurance-Programs/Pre-Existing-Condition-Insurance-Plan.html.
- Richard S. Foster, Chief Actuary, “Estimated Financial Effects of the ‘Patient Protections and Affordable Care Act,’ as Amended,” U.S. Department of Health and Human Services, Centers for Medicare & Medicaid Services, April 22, 2010, https://www.cms.gov/research-statistics-data-and-systems/research/actuarialstudies/downloads/ppaca_2010-04-22.pdf.
- U.S. Department of Health and Human Services, “Pre-existing Condition Insurance Plan Program; Interim Final Rule,” Federal Register 75(146): 45014-33, July 30, 2010, https://www.gpo.gov/fdsys/pkg/FR-2010-07-30/pdf/2010-18691.pdf.
- U.S. Department of Health and Human Services, “Covering People with Pre-existing Conditions: Report on the Implementation and Operation of the ‘Pre-existing Condition Insurance Plan Program,’” February 23, 2012, https://www.cms.gov/CCIIO/Resources/Files/Downloads/pcip-report.pdf.
- Richard Popper, Director, Insurance Programs Group, “Management of the PCIP Program in 2012 (Policy Letter #8),” May 25, 2012, https://www.cms.gov/CCIIO/Resources/Files/Downloads/pcip-pl-05-25-12.pdf.
- U.S. Department of Health and Human Services, “Pre-existing Condition Insurance Plan Program; Interim Final Rule,” Federal Register 78(99): 30218-26, May 22, 2013, https://www.gpo.gov/fdsys/pkg/FR-2013-05-22/pdf/2013-12145.pdf.
- U.S. Department of Health and Human Services, “Patient Protection and Affordable Care Act; HHS Notice of Benefit and Payment Parameters for 2018,” Federal Register 81(172): 61456-536, September 6, 2016, https://www.gpo.gov/fdsys/pkg/FR-2016-09-06/pdf/2016-20896.pdf.
- The analysis in this section is based on publicly available data on PCIP and the two reports published by HHS: U.S. Department of Health and Human Services, “Covering People with Pre-existing Conditions: Report on the Implementation and Operation of the ‘Pre-existing Condition Insurance Plan Program,’” February 23, 2012, https://www.cms.gov/CCIIO/Resources/Files/Downloads/pcip-report.pdf; U.S. Department of Health and Human Services, “Covering People with Pre-existing Conditions: Report on the Implementation and Operation of the ‘Pre-existing Condition Insurance Plan Program,’” January 31, 2013, https://www.cms.gov/CCIIO/Resources/Files/Downloads/pcip_annual_report_01312013.pdf.
- U.S. Department of Health and Human Services, “Health Insurance Coverage for People with Pre-Existing Conditions: Impact of the Affordable Care Act,” Assistant Secretary for Planning and Evaluation Issue Brief, January 5, 2017, https://aspe.hhs.gov/system/files/pdf/255396/Pre-ExistingConditions.pdf.
- Authors’ calculation based on State Health Facts, “Health Insurance Coverage of the Total Population,” 2013, Kaiser Family Foundation, http://kff.org/other/state-indicator/total-population/?currentTimeframe=2.
- U.S. Department of Health and Human Services, “Covering People with Pre-existing Conditions: Report on the Implementation and Operation of the “Pre-existing Condition Insurance Plan Program,” February 23, 2012, https://www.cms.gov/CCIIO/Resources/Files/Downloads/pcip-report.pdf.
- Note that Massachusetts and Vermont had very low enrollment and thus expenditures because of pre-existing programs. These state had already guaranteed access to private individual market insurance for people with pre-existing conditions in their state; as such, very few individuals qualified for PCIP.
- Authors’ calculation based on State Health Facts, “Monthly Silver Plan Premium for a 40-Year Old Non-Smoker Making $30,000 / Year,” 2017, Kaiser Family Foundation, http://kff.org/other/state-indicator/monthly-silver-premiums-for-a-40-year-old-non-smoker-making-30000year/?currentTimeframe=0.s.
- American Academy of Actuaries, “Issue Brief: Using High-Risk Pools to Cover High-Risk Enrollees, Washington, D.C., February 2017, http://www.actuary.org/files/publications/HighRiskPools_021017.pdf.
- Council of Economic Advisers. Economic Report of the President. (Washington, D.C.: The White House, January, 2017), https://www.gpo.gov/fdsys/pkg/ERP-2017/pdf/ERP-2017.pdf.


