
The postsecondary completion agenda1 of the past decade has brought national focus—both praise and scrutiny—to community colleges. Recognized as vital to regional and state talent development, and as the most affordable path into higher education in a landscape of skyrocketing costs, community colleges have been the target of considerable policy and philanthropic attention in an effort to improve historically low completion rates while preserving their critical role as the on-ramp to higher education for millions of students.
The focus on improving community college degree completion rates has led to a wave of state-level reforms, including the overhaul of developmental education and comprehensive “guided pathways” redesign initiatives to create greater structure and coherence in programs of study.2 There have also been policy innovations, from sophisticated funding models tied to research on student progression (such as the Washington State Board for Community and Technical Colleges Student Achievement Initiative, or SAI)3 to “free college” initiatives in Tennessee, Oregon, California, New Jersey, and New York.4
But concerns remain, in the midst of these programmatic and policy reforms, about colleges’ ability to achieve significantly better outcomes in an environment of constrained resources. Nationally, only 29 percent of students who start in community colleges complete an associate’s degree within six years. And while about 32 percent of students who start in community colleges continue on to four-year institutions, only 13 percent ultimately earn a bachelor’s degree within six years. Even more problematic, the community college cohort bachelor’s completion rates varied by the average student socioeconomic status: students from the lowest income quartiles were reported at 9.5 percent, compared to 15.5 percent for those in the highest income quartile.5
Reforms initiated over the past decade are showing promise for improving student persistence, but how much these efforts contribute to overall “productivity” (in terms of cost per credential awarded) for community colleges is unclear. One challenge that reformers face is understanding the real cost of these initiatives and their return-on-investment, given the complexity of overlapping reforms at varying levels of scale and longevity in most institutions. In general, though, the cost of reforms that significantly increase persistence is high: it is very expensive for community colleges to do the types of intensive advising and wraparound support interventions (much less reforms to core business processes) that are demonstrated to help students succeed, such as the City University of New York Accelerated Study in Associate Programs (CUNY’s ASAP).6 Even though there is evidence that ASAP was cost-effective—the relatively high cost of the program is compensated by the substantial increase in timely degree attainment rates—the governance structure and leader capacity needed to implement these types of programs might be out of reach in many states, given current resource constraints.7
This leaves state/system policy designers with a specific challenge: How to adequately incentivize both participation and completion8 through funding mechanisms, while at the same time making the investments required for colleges—especially those that have historically low outcomes as a result of serving disproportionately large numbers of students with significant remedial and other academic and social support needs—to undertake the intensive redesign and student support interventions that are required to yield better outcomes in the long-term?
In sum, this challenge reflects the tension between prioritizing efficiency versus equity in policy design.9 Outcomes-based funding models, now in place for community colleges in around half of all U.S. states, are designed to incentivize institutional improvement in ensuring that more students complete credentials. And yet, historically, institutions with the lowest outcomes are also those serving the greatest numbers of disadvantaged students, and doing so with the lowest per-student revenues.10
The reforms required for institutions serving a larger proportion of disadvantaged students to make significant and sustained gains in student outcomes are expensive, and these schools will require more—not fewer—resources in order to match the outcomes of other participants in states’ postsecondary systems. There is evidence that, in two-thirds of cases where schools saw improvements in graduation rates, these changes were related to an increase in resources.11 Attending to disparities in revenues that these institutions face (often tied to legacies of highly varied levels of local funding), and the varying level of resources needed to address the disadvantages of the populations that some institutions serve, are issues of “horizontal” and “vertical” equity, respectively.
There are increasingly sophisticated funding models in place across the country, the designers of which have carefully considered all of these competing and intersecting challenges and interests. But the convergence in the field around increasingly evidence-based, whole-school models of reform—such as those promoted in Completion by Design, the American Association of Community Colleges AACC Pathways Institutes, the Bill & Melinda Gates Foundation’s Frontier Set, and Complete College America’s Game Changers—require policy designers in states to continually evaluate how effectively funding models balance incentives for completion with the investments required for the most resource-lean institutions to adopt meaningful reform.12
This report offers key considerations and analytic tools to aid policy designers in their efforts to balance equity and efficiency when creating their funding models. The report relies on a simple regression model—based on a study using data from the California Community Colleges system—that demonstrates the impact of weighting these different priorities within funding models on the appropriations that institutions receive.
Finding the Right Balance: Evidence from Models of Funding Outcomes in California
The goal for states or systems of higher education, from a policy perspective, is to incentivize completion (that is, increase productivity), while not putting such weight exclusively on outcomes that the funding model undermines institutional efforts to improve equity—particularly for institutions that serve large proportions of low-income students and communities of color. Indeed, underlying the practice and policy efforts of the past decade, including those aimed at improving the design of funding mechanisms, are questions about the extent to which community colleges are adequately and fairly funded to achieve greater success for students given their complex missions as open access and multi-mission institutions. Per-student funding at community colleges nationally is significantly lower than in other sectors, and their financial position remained far below levels observed at the beginning of the Great Recession.13 And even within the sector, reliance on local funding often results in significant disparities in per-student revenue.14
Disparities across and within the sector will continue to hamstring not only individual colleges’ ability to achieve sustained improvements in student success, but also states’ and systems’ efforts to ensure they are productive, efficient, and equitable postsecondary educational systems. Thoughtful funding formulas have the potential to attenuate these disparities, while also incentivizing comprehensive innovation and reform that increases efficiency. But such funding systems have to be clear about the outcomes desired, and cognizant of the costs required to achieve those outcomes, given the needs of the students that community colleges serve and the critical importance of community colleges as a point of access for students of color and first-generation and low-income students.
This report draws on evidence from a study15 that used institutional data from the California Community Colleges system to model four funding scenarios, with varying focus on different conceptions of equity and efficiency. The goal of that study was to observe the impacts on institutional funding across the heterogeneous California system, given varying weights within the funding models that prioritized either compensation for inputs (extra resources for serving the students most in need of academic catch-up) or incentivizing outputs.
Modeling these different configurations of equity and efficiency factors with existing district-level data in California yields some important lessons. First, the model results make clear that any funding policy targeting equity or efficiency must take into account existing disparities in base allocations that may be strongly correlated with historical rates of student success, because prioritizing outcomes without input adjustments dramatically favors wealthier districts that serve fewer low-income students. The winners and losers across districts (and the geographic and demographic characteristics of those districts) given different funding models reveals much about how current and historical disparities in funding contribute to differences in outcomes, and the potential for those disparities to be deepened by ill-conceived policy. Formulas that incorporate outcome indicators on top of base allocations may not only exacerbate existing disparities in base allocations, but also further deprive any already underfunded districts that serve large numbers of disadvantaged students.
Second, policymakers need to carefully consider both the equity and efficiency implications of funding policy designs because there are considerable trade-offs to be made in emphasizing one to a greater or lesser extent. Underfunding institutions that serve large proportions of disadvantaged students in order to direct resources toward “higher-performing” colleges may not only be inequitable, but also inefficient for the system as a whole in that it would fail to provide adequate funding for community colleges to fulfill the vital workforce development function they serve. On the flip side, incentivizing completion is critical for moving institutions and the system as a whole toward greater effectiveness—and, ultimately, for ensuring that more students achieve the rewards of postsecondary attainment.
To be clear, a number of states have already implemented or are in the process of implementing outcomes-based funding formulas, such as Washington’s SAI described above.16 The SAI’S strength is that the state made efforts to define benchmarks of student success that could be incorporated into the funding formula. Recent evaluations of the formula suggest that, despite the focus on productivity, the formula did not penalize colleges enrolling more at-risk and low-income students, and that in fact it encouraged enrollment of underserved students.17
Around half of states/state systems currently have some form of outcomes-based funding in place for community colleges, the majority of which balance outcome indicators and input indicators in an effort to preserve access while improving productivity.18 This design principle is consistent with best practice recommendations from researchers and national policy organizations.19 Observing the use of these formulas across states, however, may not provide insight into the relationship between equity and efficiency impacts. This report’s objective is to simulate ideal-type funding models—including a model that looks like many outcomes-based formulas currently in use across the country—using the data from a single community college system (California’s) in order to explore differences in results.
It is important that state policy designers understand the interaction of efficiency and equity goals when creating funding policy, for several reasons. First, the relationship between per-student expenditures and student outcomes in community colleges is complex and not yet well understood. Policymakers must thus consider both the overall level of resources necessary to enable community colleges to produce the outcomes desired from them, as well their productive efficiency in using those resources in ways that contribute to student success.
A second and related point is that, although equity and efficiency are typically conceived as being in tension as policy goals, there is evidence that inequity is also inefficient when it comes to public school funding.20 As a Century Foundation task force has already pointed out, “While policymakers see community colleges as a relatively inexpensive way to educate large numbers of students, the under-resourcing of the system in fact has helped create large inefficiencies, with low completion rates.”21 In other words, recent evidence suggests that a substantial increase in graduation rates in the sector would require equity-focused investments of greater resources in relatively underfunded institutions in order to increase their productive efficiency.
This report’s analysis starts with the premise that policymakers are faced with the task of maximizing both equity and efficiency through the design of funding formulas for community colleges, and that equity and efficiency can be conceived of, at least in part, as complementary rather than competing goals.22 Each of this report’s funding formula simulations seeks to answer the following questions:
- What is the result of the funding model on equity? In other words, do districts that serve large numbers of high-need students benefit or lose, compared to other models of allocation?
- What is the result of the funding model on efficiency? In other words, do institutions that currently demonstrate the greatest productive efficiency in terms of student outcomes benefit or lose, compared to other models of allocation?
The theory of change behind outcomes-based funding and other incentive tools is prospective: changing the incentives inherent to a resource-dependent relationship will change institutional behavior, resulting in different outcomes.23 The policy-relevant question with respect to the different potential designs of funding models is thus: What likely effects would such policy tools have on student outcomes, given their emphasis on providing additional investment in students with greater needs (equity) or incentivizing greater productivity (efficiency), or both?
Four Models of Funding for Equity and Efficiency
Both equity and efficiency have numerous meanings in economics and policy literatures depending on to whom and for what the standards are being applied and in what contexts the issues are considered. With respect to school finance, research suggests that the relevant policy and economic considerations include allocative efficiency, productive efficiency, and equity: “Allocative efficiency is getting the amount of education right. Productive efficiency is getting it at the least cost. Equity is applying this standard of optimality to everyone, regardless of family background or income.”24 In higher education, policymakers may be similarly concerned with both the optimal amount of public investment in postsecondary education directly or through financial aid, as well the optimal distribution of resources to ensure equal opportunity regardless of socioeconomic status, race, or other factors.
This report focuses on the question of productive efficiency, defined as community colleges’ “production” of student outcomes at a given level of expenditure. The report models productive efficiency by identifying specific community college student outcomes that are prioritized within outcomes-based funding models currently implemented in various states, and determining which districts produce the greatest level of those outcomes at given levels of funding. To capture the important and sometimes significant variations in intra-institution (program-level) costs, the report adopts weights from the state of Texas funding model and builds these weights into district-level analyses.
The report rests on the concept of equity as Teachers College economics and education professor Henry M. Levin describes it: “[T]he quest for and achievement of fairness in access to educational opportunities, resources, and outcomes by gender, social class, race, language origins, disability, and geographic locations of students.”25 Though there are many different principles underlying varying concepts of equity, the report focuses on two of the most common principles: (1) the distribution of resources should be equal across equal entities, such that available resources are decoupled from local tax revenues (horizontal equity);26 and (2) the distribution of resources should be unequal to account for need, such that more resources are directed to students with the greatest need via the institutions or districts that disproportionately serve them (vertical equity).27
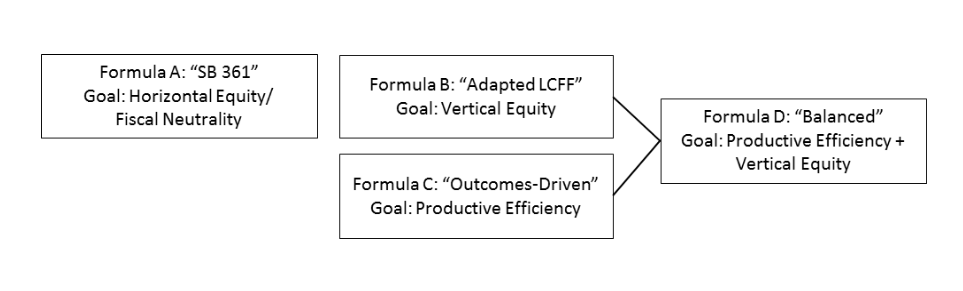
The report models the impact of four funding formulas:
- Formula A: SB361. Horizontal equity is modeled by adapting the funding equalization policy that was designed to equalize funding across districts in the California Community Colleges system (California State Senate Bill 361, approved in 2006).
- Formula B: Adapted LCFF. Vertical equity is modeled by adapting the K–12 Local Control Funding Formula (LCFF) implemented in 2013 in California, which includes adjustments and supplemental grants designed to provide greater resources to districts serving large numbers of disadvantaged students. To adapt the LCFF to the higher education context, the report defines disadvantaged students as those eligible for California’s means-tested Board of Governors fee waivers (BOG-recipient students)28 and designs the formula to target districts serving large concentrations of those students.
- Formula C: Outcomes-Driven. Productive efficiency is modeled by using the most extreme version of performance-based funding, where colleges are mostly rewarded by increases in outcomes.
- Formula D: Balanced. A balanced approach is modeled by combining the adapted K–12 LCFF formula, which provides more funding for colleges serving high-need students, with the outcomes-driven or performance-based funding formulas, to provide economic incentives for colleges who increase degree.
Across these four models, the dynamic relationship between equity (horizontal and vertical) and efficiency in community college funding was examined by illustrating the impact on district appropriation amounts across four possible funding designs that differ based on the extent to which equity and productive efficiency (outcomes) are operationalized as policy priorities (see Figure 1).
Figure 1
In the Weeds: Modeling Equity and Efficiency Outcomes
A simple regression analysis illustrates the overall contributions of equity, efficiency, and enrollment size to total state and local revenues, held constant across each of the four funding formulas. This analysis clearly shows the design of the hypothetical models and provides an empirical template that policy analysts could adapt in order to test the validity of their funding formula designs.
The first step in the analysis was to use a regression model to estimate the equity and efficiency contributions to total state allocations across the four formulas. For the purposes of this analysis, the total state and local funding allocation were held constant, and the contributions of enrollment size (full-time equivalent [FTE] students), program cost differences (cost-weighted FTE students), equity factors, and efficiency factors across the different formulas were examined.29 The basic model is:
Yi=a+β1X+β2V+ β3Z+β4W+ε
Where,
Yi = Total state and local revenues
a = Base allocation
X = FTE students
V = Proportion of BOG-recipient students (equity related input)
Z = Percent outcome improvement (efficiency related output)
W = Vector containing cost-weighted FTE students for nine program areas
ε = Error term
This model allows policy designers to run simple regressions in order to estimate the magnitude of the coefficient of the equity and efficiency vectors, based on total appropriations and district or institutional outcomes and characteristics in their state. To account for significant variations in cost across programs within institutions (for example, nursing versus general education), the analysis condensed the universe of twenty-four instructional areas grouped at the two-digit California Community Colleges Taxonomy of Program level to nine instructional areas, and weighted them using standards developed in the state of Texas for lower-division courses. The Texas weights were grouped into the nine matching categories, and then averaged. Each of the nine program area weights were multiplied by each college’s FTE students in each corresponding area to obtain cost-weighted FTE student measures for each college.30
Table 1 presents the estimates for the four different funding formulas. For this analysis, the equity component reflects the proportion of BOG-recipient students in the state and the efficiency component reflects overall improvement in the student achievement outcomes. Other states/systems could adapt these vectors to reflect indicators they are considering based on available data and specific equity or student achievement priorities.
Table 1
| Association between District Revenue and Equity and Efficiency metrics Across Funding Formulas | ||||
| Formula A SB 361/Horizontal Equity |
Formula B Adapted LCFF/Vertical Equity |
Formula C Outcomes-Driven |
Formula D Balanced |
|
| Base Allocation | 0.11*** | 0.28*** | -0.13 | 0.29*** |
| # FTES | 0.89*** | 0.69*** | 0.60*** | 0.68*** |
| % BOG Students | -0.01 | 0.24*** | -0.41*** | 0.24*** |
| % Outcome Improvement | 0.01 | 0.04 | 0.22** | 0.07** |
| Total Observations (N) | 66 | 66 | 66 | 66 |
| R-squared | 0.99 | 0.94 | 0.58 | 0.94 |
| ***p<.01, **p<.05, *p<.10
Notes: All the data for the simulations come from two sources within the California Community Colleges Chancellor’s Office (CCCCO).
The Annual Fiscal Abstracts and the CCCCO’s management information system (MIS) datamart.
The dataset was assembled to conduct all the simulations using the four different funding formulas.
|
||||
Examining these standardized beta coefficients illustrates the effectiveness of the hypothetical models in sorting institutions based on institutional characteristics and outcomes:
- Under Formula A (SB 361), which modeled an emphasis on horizontal equity—equalizing per-student funding across districts—total state and local revenue allocations are largely driven by enrollment (b = 0.73, p < 0.01), and not at all associated with the proportion of low-income students (BOG) being served (b = –0.02, p > 0.10) or outcomes.
- By contrast, Formula B (Adapted LCFF), which is designed to enact vertical equity—that is, directing resources to greater need based on inputs—not surprisingly shows a large and statistically significant coefficient for the percentage of low-income (BOG) students (b = 0.18, p < 0.01) and no relationship to outcomes.
- Formula C (Productive Efficiency), which is designed to prioritize productive efficiency by weighting outcomes irrespective of inputs, reveals a positive and statistically significant coefficient for the overall performance on student achievement outcomes (b=0.21, p < .05). Not surprisingly, because funding in this formula is driven by institutional performance, Formula C produces a negative association between total allocations and the proportion of low-income (BOG) students being served (b = –0.29, p < 0.01).
- Finally, results of Formula D (Balanced)—which is designed to balance inputs and outcomes—reflect its design. In this case, there are positive and statistically significant coefficients for both the proportion of low-income students (BOG) being served (b = 0.18, p < 0.01) and improvement on student achievement indicators (Outcome Improvement) (b = 0.07, p < 0.05).
This is a simple procedure that researchers and policymakers can use to test whether their designed and negotiated formulas are indeed favoring the preferred equity and efficiency dimensions, and to what extent weights on either efficiency or equity components may negatively influence allocations driven by the other or by total enrollment size.
Estimating Winners and Losers
It is important to remember that even small changes to the current funding formulas would require immense political capital. Politicians would most likely advocate for budgetary changes that guarantee a hold harmless clause; that is, no district would receive less in appropriations (state and local) funding than under the current formula. For this reason, states should start experimenting with these formulas by increasing the total pool of available funding. States could also start to incentivize at the margins, so that once colleges started to respond positively to these incentives, the political appetite and environment for reform toward more drastic changes might be more favorable.
Examining the impact of the four formulas on the funding prospects of actual districts is a useful exercise to illustrate how different types of districts would fare under the proposed formulas. That is, which types of districts would gain funding, which would remain the same, and which would lose funding. Again, it is important to remind the reader that this exercise is simply to provide a more intuitive way of understanding the way the different formulas operate.
Potential Winner
The case exemplifies a large multi-district college located in the South Coast region. This district serves a very large proportion of low-income students and has below-average educational outcomes. This district is a clear beneficiary under vertical equity Formula B as well as balanced Formula D, and would substantially lose funding under the pure efficiency Formula C (see Figure 2). Given that this district happens to be the largest in the state, adopting a formula that sends more resources to this district would be felt across the state without the infusion of additional funding. This suggests that policy designers looking to make changes in the funding formula will need to focus closely on the impact of large multi-college districts to make sure that smaller and rural districts are not harmed.
Figure 2
Potential Neutrality
A medium, multi-college district located in the South Coast region that doesn’t serve a large proportion of low-income students—and that has educational outcomes around the state average—would remain the same under the four different scenarios (see Figure 3). For this specific types of districts, one could anticipate that the incentives implicit in the balanced formula might motivate the college to engage more actively in the recruitment of student in low-income high schools. Another strategy for the college could be to focus on improving the average educational outcomes, so that the college can benefit under the efficiency part of the formula.
Figure 3
Potential Loss, If Hold Harmless Provision Is Not Adopted
A medium, single-college district located in a wealthy area that currently serves low proportions of low-income students and has above-average state outcomes would lose funding under the Formula D, the proposed balanced funding formula (see Figure 4). Under the current formula, the district receives about $6,000 per FTE student without taking into account any categorical funding. This amount would be substantially reduced under Formula B, which currently adapts the Local Control Funding Formula in K–12. However, if the resources were allocated under Formula C, an extreme example of efficiency, the district would win. Finally, under Formula D, the balanced equity and efficiency formula, this district would substantially lose resources.
Figure 4
Takeaways: Moving Toward a Conception of Community College Funding “Adequacy”?
The future of policy innovation in funding community colleges centers on the need to reduce disparities in funding across the sector while increasing productivity. The shift that occurred in K–12 funding nationally toward a view of funding “adequacy” rather than “equity” is instructive in this regard. In essence, balanced-outcomes-based funding formulas that combine indicators to promote the enrollment of disadvantaged students with adjustment for student achievement measures may approximate for higher education what standards of adequacy have achieved in K–12.
Specifically, as with the standards movement in K–12, the student achievement metrics that are used in outcomes-based funding models such as those in Washington State (SAI) and elsewhere provide for community colleges a set of achievement standards against which performance might be measured across institutions, districts, and states. Consensus around such standards in K–12 was critical in order to generate cost estimates of the funding levels necessary to achieve those standards equally across districts.31
Outcomes-based funding models can work to advance equity and efficiency, but only if the indicators and relative weights are finely tuned to ensure the adequacy of funding for institutions that serve large numbers of disadvantaged students and to protect access for those students.32 This is not a new insight, but the results in this report demonstrate the importance of considering historical funding levels and student achievement rates before overlaying a new funding mechanism in a way that may be ineffective at best or, at worst, exacerbate existing disparities. The balanced formula modeled here is also simple and blunt in design; in practice, such a model would have to consider potential unintended consequences in terms of the incentives and disincentives it creates. For example, colleges may want to focus on some outcomes more than others, in order to maximize their allocation, and the fact that colleges receive funding for specific outcomes might lead to a narrowing of focus on outcomes in ways that threaten the quality of students’ education.33
Moreover, implementing broad productivity incentives without consideration of the differential per-student costs across programs may result in institutions choosing to reduce investment in high-cost programs (for example, nursing) despite the strong need for graduates from those programs in local and regional labor markets. Policymakers should work with institutional leaders to determine the appropriate outcome indicators to include in any funding formula. That said, evidence suggests that embedding such achievement standards in funding formulas may help community college leaders build consensus on campus for needed reforms, generate organizational learning around issues of student success, and prioritize among often multiple and competing missions to focus on those programs for which they have a competitive advantage.34
Beyond Balanced Formulas: Considerations for Policy Design
In January 2018, Governor Jerry Brown of California proposed a budget that would (a) apply the thinking behind the K–12 Local Control Funding Formula, and (b) establish an outcomes-based funding supplement (called a student success incentive) to the community college sector.35 The formula is similar to the balanced formula proposed in this report, and is receiving serious attention from policymakers. At the same time community college leaders and advocacy groups have expressed serious concerns related to the performance-based funding component of the formula.36
California will be electing a new governor who would need to address this issue in the coming years. As political leaders and education policymakers work on developing new strategic plans for the coming decade and aligning funding models to those plans, there are at least three important issues that they need to keep in mind if they want to minimize unintended negative consequences associated with upcoming changes.
First, as states work toward revising their funding formulas, they should make sure that the funding design allows institutions flexibility to weight the outcomes prioritized within their particular missions—as long as these missions reflect the competitive advantage of that sector within the system as a whole. The most effective and sophisticated funding models in place currently were designed with considerable engagement from institutional leaders committed both to supporting institutional improvement and improving student success outcomes. In the California context, this means that the strategic plans of the more than seventy community college districts need to be aligned with the strategic plan put forth by the California Community Colleges Chancellor’s Office. This is something that, under the state’s current heavily decentralized system of governance, can prove extremely difficult. District chancellors and single-district college presidents would need some strong backing from Sacramento, so that other important constituencies, such as the academic senates and boards members, will coalesce around the California Community Colleges proposed strategic plan, Vision for Success.37
Second, if the main goal of the higher education system is to increase productivity, with particular attention to increasing student achievement among vulnerable or disadvantaged populations, funding formulas should be designed so that institutions compete “against their own past performance rather than against other institutions or sectors.”38 Of course, when resources are limited, institutions are ultimately competing to gain a greater share of revenue; however, improvement should be counted as much as—or more than—absolute outcomes, to minimize the deleterious effects of competition across sectors with different competitive advantages. Within- and between-sector competition may lead to a “race to the bottom,” in which institutions start to restrict access in order to serve students with higher likelihoods of success, or to water down the program requirements and narrow the curriculum in order to increase graduation rates of inexpensive programs, regardless of the value of those programs to students or the state. Community colleges must always be recognized for their role in providing access and increasing attainment. This is a real issue in the California context, which calls for incentivizing outcomes that are aligned with the goals of the recently passed plan for community colleges, Vision for Success. It might also call for additional temporary funds, to incentivize cross-system collaboration (for example, community colleges and state colleges) to create structured pathways in credentials and degrees in STEM for all students. States need to avoid incentivizing any type of tracking that might end up accentuating inequalities.
Finally, state or system policy designers have to carefully audit the data capacity underlying any accountability system. The appeal of designing funding formulas that reflect nuanced policy goals for higher education may push them ahead of where their data capacity allows them to go while maintaining integrity and fairness to institutions. Not only do metrics have to be clearly defined to create apples-to-apples comparisons (for example, on seemingly simple but definitionally complex indicators such as graduation and transfer-out rates), data systems have to be monitored and continually improved to minimize systemic errors in capture, collection, and reporting.
This report demonstrates that funding mechanisms can be effectively used to pursue the different goals that inform state policy, including vertical equity and productive efficiency. But creating equity and efficiency in funding is a means to an end, not an end in itself. States (and the federal government) must keep in mind that end goal and yet still think carefully about ways to ensure that indicators of student achievement reinforce rather than undermine the kinds of quality education that will benefit all students and our regional and national economies.
Acknowledgements
The authors would like to thank the following people for their help in compiling this report: Richard Kahlenberg and Robert Shireman of The Century Foundation; Christian Osmena, of the California Community College Chancellor’s Office; and Martiza Urquiza, California Department of Finance.This report is based on a recently published paper by Tatiana Melguizo, Keith Witham, Kristen Fong, and Edward Chi, “Understanding the Relationship between Equity and Efficiency: Towards a Concept of Funding Adequacy for Community Colleges,” Journal of Education Finance 43, no. 2 (2017).
Notes
- Over the past decade, the national discourse regarding higher education has shifted from a focus on access to a focus on completion. This was partly the result of the Obama administration goal of attaining a 60 percent graduation rate by 2020, and initiatives such as Completion by Design funded by philanthropic organizations such as the Bill & Melinda Gates Foundation. See, for example, “The College Completion Agenda: State Policy Guide,” National Conference of State Legislatures, 2011, http://www.ncsl.org/research/education/the-college-completion-agenda-state-policy-guide.aspx.
- Advocacy groups such as Complete College America (https://completecollege.org) have been at the forefront of these efforts. See, for example, Thomas R. Bailey, Shanna Smith Jaggars, and Davis Jenkins, Redesigning America’s Community Colleges: A Clearer Path to Student Success (Cambridge, Mass.: Harvard University Press, 2015).
- Davis Jenkins and Nancy Shulock, “Metrics, dollars, and systems change: Learning from Washington State’s Achievement Initiative to Design Effective Postsecondary Performance Funding Policies,” Community College Research Center, Teachers College, Columbia University, March 2013, https://ccrc.tc.columbia.edu/media/k2/attachments/student-achievement-initiative-policy-brief.pdf.
- See, for example, the Tennessee Promise website (http://tnpromise.gov), the Oregon Promise page at the Oregon student aid website (https://oregonstudentaid.gov/oregon-promise.aspx), the Los Angeles College Promise website (http://lacollegepromise.org), the Newark College Promise page at the College Promise Campaign website (http://collegepromise.org/programs/newark-college-promise/), and the College Promise project page for Graduate School of Education, University of Pennsylvania (https://ahead-penn.org/creating-knowledge/college-promise).
- Doug Shapiro, Afet Dundar, Faye Huie, Phoebe Khasiala Wakhungu, Xin Yuan, Angel Nathan, and Youngsik Hwang, Tracking Transfer: Measures of Effectiveness in Helping Community College Students to Complete Bachelor’s Degrees (Herndon, Va.: National Student Clearinghouse Research Center, September 2017), Figure 4, https://nscresearchcenter.org/wp-content/uploads/SignatureReport13.pdf; Doug Shapiro, Afet Dundar, Phoebe Khasiala Wakhungu, Xin Yuan, Angel Nathan, and Youngsik Hwang, Completing College: A National View of Student Attainment Rates by Race and Ethnicity—Fall 2010 Cohort (Herndon, Va.: National Student Clearinghouse Research Center, April 2017), https://nscresearchcenter.org/signaturereport12/.
- A recent Randomized Control Trial (RCT) evaluation of this program showed that it doubled graduation rates for students who were part of the intervention compared to those who only had access to the traditional services. Susan Scrivener, Michael J. Weiss, Alyssa Ratledge, Timothy Rudd, Colleen Sommo, and Hannah Fresques, Doubling Graduation Rates: February 2015 Three-Year Effects of CUNY’s Accelerated Study in Associate Programs (ASAP) for Developmental Education Students (New York: MDRC, February 2015), https://www.mdrc.org/sites/default/files/doubling_graduation_rates_fr.pdf.
- Henry M. Levin and Emma Garcia, “Cost-effectiveness of Accelerated Study in Associate Programs (ASAP) of the City University of New York, (CUNY),” Working paper, Center for Benefit-Cost Studies in Education, Teachers College, Columbia University, September 2012, http://www1.cuny.edu/sites/asap/wp-content/uploads/sites/8/2014/06/Levin-ASAP-Cost-Effectiveness-Report.pdf; Henry M. Levin and Emma Garcia, “Benefit-Cost Analysis of Accelerated Study in Associate Programs (ASAP) of the City University of New York, (CUNY),” Working paper, Center for Benefit-Cost Studies in Education, Teachers College, Columbia, May 2013, http://www1.nyc.gov/assets/opportunity/pdf/Levin_ASAP_Benefit_Cost_Report_FINAL_05212013.pdf.
- The proposed funding formulas focus on increasing the outcomes of enrolled students. Potential adaptation of the formulas might want to include some monetary incentives to address regional participation gaps. See, for example, “Educating Julio: Identifying and addressing community college,” California Competes Council, April 2014, http://californiacompetes.org/assets/general-files/Educating-Julio.pdf.
- As discussed below, unequal funding can also sometimes be inefficient.
- Tatiana Melguizo and Holly Kosiewicz, “The Role of Race, Income, and Funding on Student Success: An Institutional Level Analysis of California Community Colleges,” in Bridging the Higher Education Divide: Strengthening Community Colleges and Restoring the American Dream: The Report of The Century Foundation Task Force on Preventing Community Colleges from Becoming Separate and Unequal (New York: The Century Foundation, 2013).
- John Bound and Sarah Turner, “Cohort crowding: How resources affect collegiate attainment,” Journal of Public Economics 91, no. 5 (2007): 877–99.
- See “Complete by Design,” Bill and Melinda Gates Foundation, https://postsecondary.gatesfoundation.org/areas-of-focus/networks/institutional-partnerships/completion-by-design/; “AACC Pathways Project,” American Association of Community Colleges, https://www.aacc.nche.edu/programs/aacc-pathways-project/: “The Frontier Set,” Bill and Melinda Gates Foundation, https://postsecondary.gatesfoundation.org/frontier-set-frequently-asked-questions/; and “Complete College America: The Game Changers,” Bill and Melinda Gates Foundation, https://postsecondary.gatesfoundation.org/report/complete-college-america-the-game-changers/.
- Donna Desrochers and Steven Hulburt, “Trends in College Spending 2003–2013. Where Does the Money Come from? Where Does It Go? What Does It Buy?” Delta Cost Project at the American Institutes for Research, January 2016, https://www.air.org/system/files/downloads/report/Delta-Cost-Trends-in-College%20Spending-January-2016.pdf.
- A recent study supported by The Century Foundation (Melguizo and Kosiewicz, “The Role of Race, Income, and Funding on Student Success”), for example, found a strong relationship between the economic wealth of the area of a particular college and its local funding. Colleges located in areas where the local median average salaries were over $80,000 received 1.4 times more local funding per student than those in communities with average median salaries below $50,000. Granted, the current funding formula is designed to equalize between districts, but districts still benefit fully from local funding to fund and maintain buildings.
- Tatiana Melguizo, Keith Witham, Kristen Fong, and W. Edward Chi, “Understanding the relationship between equity and efficiency: Towards a concept of funding adequacy for community colleges,” Journal of Education Finance 43, no. 2 (Fall 2017): 195–216, https://muse.jhu.edu/article/688012/summary.
- Dennis P. Jones, “Outcomes-based funding: The wave of implementation,” Complete College America, October 2013, https://www.insidehighered.com/sites/default/server_files/files/Outcomes-Based%20Funding%20Report%20(Final).pdf;
“Performance-based funding for higher education,” National Conference of State Legislators, July 31, 2015, http://www.ncsl.org/research/education/performance-funding.aspx. - Davis Jenkins and Nancy Shulock argue that the strongest evidence that baseline funding incentives work is how well colleges have organized and conducted themselves to maximize enrollment or meet enrollment targets. See Davis Jenkins and Nancy Shulock, “Metrics, dollars, and systems change: Learning from Washington State’s Achievement Initiative to Design Effective Postsecondary Performance Funding Policies,” Community College Research Center, Teachers College, Columbia University, March 2013, https://ccrc.tc.columbia.edu/media/k2/attachments/student-achievement-initiative-policy-brief.pdf.
- “Performance-based funding for higher education,” National Conference of State Legislators, July 31, 2015, http://www.ncsl.org/research/education/performance-funding.aspx.
- Lauren Davies, “State ‘shared responsibility’ policies for improved outcomes: Lessons learned,” HCM Strategists, March 2014, http://hcmstrategists.com/wp-content/uploads/2014/04/HCM-State-Shared-Responsibility-RADD-2.0.pdf; Kevin Dougherty and Vikash Reddy, “The Impacts of State Performance Funding Systems on Higher Education Institutions: Research Literature Review and Policy Recommendations,” CCRC Working Paper no. 37, Columbia University, Teachers College, Community College Research Center, December 2011, http://ccrc.tc.columbia.edu/publications/impacts-state-performance-funding.html; Dennis P. Jones, “Outcomes-based Funding: The Wave of Implementation,” Complete College America, 2013, http://completecollege.org/pdfs/Outcomes-Based-Funding-Report-Final.pdf; “Performance-based funding for higher education,” National Conference of State Legislators, July 31, 2015, http://www.ncsl.org/research/education/performance-funding.aspx.
- D. W. Breneman and S. C. Nelson, Financing Community Colleges: An Economic Perspective (Washington, D.C.: Brookings Institution, 1981); A. C. Dowd and L. Grant, “Equity and efficiency of community college appropriations: The role of local financing,” Review of Higher Education 29, no. 2 (2006): 167–94; C. M. Hoxby, “Are efficiency and equity in school finance substitutes or complements?” Journal of Economic Perspectives 10, no. 4 (1996): 51–72; Bridging the Higher Education Divide: Strengthening Community Colleges and Restoring the American Dream: The Report of The Century Foundation Task Force on Preventing Community Colleges from Becoming Separate and Unequal (New York: The Century Foundation Press, 2013).
- Bridging the Higher Education Divide: Strengthening Community Colleges and Restoring the American Dream: The Report of The Century Foundation Task Force on Preventing Community Colleges from Becoming Separate and Unequal (New York: The Century Foundation, 2013), 14.
- Breneman and Nelson, Financing Community Colleges; Hoxby, “Are efficiency and equity in school finance substitutes or complements?”
- J. C. Burke, “Performance funding indicators: Concerns, values, and models for state colleges and universities,” New Directions for Institutional Research 97 (1998): 49–60; K. J. Dougherty and E. Hong, “Performance Accountability as Imperfect Panacea: The Community College Experience,” in Defending the Community College Equity Agenda, ed. T. Bailey, V. S. Morest (Baltimore, Md.: The Johns Hopkins University Press, 2006), 51–86); A. Schneider and H. Ingram, “Behavioral assumptions of policy tools,” Journal of Politics 52, no. 2 (1990): 510–29.
- Hoxby, “Are efficiency and equity in school finance substitutes or complements?” p. 54.
- Henry M. Levin, “Educational Vouchers,” in Encyclopedia of Education Economics and Finance, vol. 1, ed. D. J. Brewer and L. O. Picus (Thousand Oaks, Calif.: Sage, 2014), 292–97.
- M. P. Steinberg and R. Quinn, “An urban myth? New evidence on equity, adequacy and the efficiency of educational resources,” working paper, Consortium for Policy Research in Education, University of Pennsylvania Graduate School of Education, 2014. This principle might be better characterized in the school finance context as “fiscal neutrality,” which “requires that there be no systematic association between where a child lives in a state and the amount of money spent on that child’s public schooling.” Alexander notes that the simple principle of horizontal equity cannot be easily applied to differently situated entities, such as schools or students in vastly different settings, in order to determine which among those entities should be considered “equal” for the purposes of equalizing resources. N. A. Alexander, “Education Equity,” in Encyclopedia of Education Economics and Finance, vol. 1, ed. D. J. Brewer and L. O. Picus (Thousand Oaks, Calif.: Sage, 2014), 286.
- S. L. DesJardins, “Understanding and using efficiency and equity criteria in the study of higher education policy,” in Higher Education: Handbook of Theory and Research, vol. 17, ed. J. C. Smart and W. G. Tierney (Norwell, Mass.: Kluwer Academic, 2002), 173–220.
- Unlike in K–12 research and policy, in which eligibility for free or reduced-price lunch commonly serves as a proxy for students’ socioeconomic status, there is not an analogous measure for community college students. Eligibility for federal means-tested Pell grants is a poor measure for community colleges because of their relatively low cost (particularly in California)—many students who would be eligible for Pell grants never apply for them. In this paper we use the proportion of students in the district who qualify for a BOG fee waiver, but we recognize that this is an imperfect measure given that the criteria is broad—a single mom earning over $90,000 might qualify for a grant under the current criteria. In 2007–08, the year we use for our analyses, approximately 25 percent of students enrolled in California community colleges received a BOG fee waiver. The percentage has grown to around 45 percent in 2013–14.
- An advantage of this empirical strategy is that state officials could use the coefficients of the formula and multiply them by the actual costs to construct cost-effectiveness measures. This is not illustrated empirically as it goes beyond the scope of this paper.
- We want to thank a reviewer for encouraging us to incorporate cost-weighted FTE students in nine program categories and providing the respective weights developed in the state of Texas. These weights are key as they take into account the differential costs implicit in the different programs. For example, students in nursing programs are more costly in the sense that they need to use laboratories and facilities but also because the courses are capped at much smaller numbers than other more general interest courses in the humanities and the social sciences.
- M. A. Rebell, “Equal opportunity and the courts,” Phi Delta Kappan 89, no. 6 (2008): 432–39.
- N. Shulock, “Concerns about performance-based funding and ways that states are addressing the concerns,” Institute for Higher Education Leadership and Policy, Sacramento State University, 2011, http://archive.sheeo.org/annualmeeting/Concerns%20About%20Performance-based%20Funding.pdf; K. J. Dougherty, S. M. Jones, H. Lahr, R. S. Natow, L. Pheatt, and V. Reddy, Performance Funding for Higher Education (Baltimore: Johns Hopkins University Press, 2016).
- Dougherty, Jones, Lahr, Natow, Pheatt, and Reddy, Performance Funding for Higher Education; J. Lester, “The Completion Agenda: The Unintended Consequences for Equity in Community Colleges,” in Higher Education: Handbook of Theory and Research, vol. 29, ed. M. B. Paulsen (Netherlands: Springer, 2014), 423–66).
- Lester, “The Completion Agenda.”
- State of California, California Budget 2018–19, “Summary: Higher Education,” January 10, 2018, http://www.ebudget.ca.gov/2018-19/pdf/BudgetSummary/HigherEducation.pdf; M. Zinshteyn, “Governor Brown’s plan to change community college funding to promote student success faces scrutiny,” EdSource, March 13, 2018, https://edsource.org/2018/gov-browns-plan-to-change-community-college-funding-to-promote-student-success-faces-scrutiny/594426.
- Zinshteyn, “Governor Brown’s plan to change community college funding to promote student success faces scrutiny.”
- “Vision for Success: Strengthening the California Community Colleges to Meet California’s Needs,” California Community Colleges, July 2017, http://californiacommunitycolleges.cccco.edu/Portals/0/DocDownloads/PressReleases/JUL2017/PR-Strategic-Vision-07-17-2017.pdf.
- Tatiana Melguizo, Keith Witham, Kristen Fong, and W. Edward Chi, “Understanding the relationship between equity and efficiency: Towards a concept of funding adequacy for community colleges,” Journal of Education Finance 43, no. 2 (Fall 2017): 195–216, https://muse.jhu.edu/article/688012/summary.