
In fall 2013, Bill de Blasio campaigned to be mayor of New York City with the expansion of the city’s universal prekindergarten (UPK) program as a cornerstone of his platform. And in just two years, New York City delivered on that bold promise to provide full-day universal pre-K, free of charge, to any four-year-old in the city who wants it. In 2014–2015, the first year of the expansion, enrollment in full-day universal pre-K programs grew to over 53,000 students, nearly tripling enrollment from the previous year. By the following year, the city achieved its goal of fully meeting demand for pre-K. With nearly 69,000 children enrolled in 2015–2016, universal pre-K served roughly 60 percent of the city’s four-year-olds and enrolled almost as many children as public kindergarten.1
Now, with public support for pre-K high,2 the city has turned its focus to ensuring quality education in pre-K classrooms. “Pre-K for All is now part of the lives of tens of thousands of children,” Mayor de Blasio announced in December 2015. “It will only get bigger and better from here.”3
This report looks at one of the ways that New York City can make pre-K better: by giving more children the chance to learn in racially and socioeconomically diverse preschool classrooms. Research shows that diverse classrooms offer important cognitive and social benefits, and universal pre-K creates an unprecedented opportunity to unlock these benefits for more children. While the expansion of universal pre-K represents a huge advancement for early education in New York City, pre-K classrooms are currently more racially homogeneous, on average, than kindergarten classrooms. Thoughtful policies could help create more diversity across pre-K classrooms.
Following up on a 2015 Century Foundation report that outlined the major features of New York City’s universal pre-K expansion and highlighted opportunities and obstacles for integration, this analysis presents new data from pre-K enrollment in 2014–2015 that offer a snapshot of racial and ethnic diversity during the first year of the universal pre-K expansion.4 In 2014–2015, universal pre-K enrolled an overall racially and ethnically diverse student body, with no majority group, but individual pre-K classrooms were on average more racially and ethnically homogeneous than public kindergarten classrooms. In one in six pre-K classrooms, more than 90 percent of students belonged to the same racial or ethnic group, compared to one in eight kindergarten classrooms.
Comparing across different types of pre-K sites, classrooms located in district or charter schools had similar levels of diversity to those of kindergarten classrooms in those settings, while community-based classrooms were more likely to be racially/ethnically homogeneous. Those community-based pre-K classrooms that receive funding through the Administration for Children’s Services (ACS), and that typically limit enrollment to low-income children, were also more likely than kindergarten classrooms or other types of pre-K classrooms to be majority Hispanic or majority black. Meanwhile, other community-based sites were more likely to be majority white or majority Asian.
Map. NYC Pre-K Sites and Census Tracts, By Race/ETHNICITY
This report begins with a summary of research on the benefits of diversity in pre-K classrooms. It then outlines methods of data analysis and presents findings on diversity in overall enrollment, at the classroom level, and in two case study community school districts (Brooklyn’s Districts 13 and 20), followed by a discussion of the role of geography in pre-K classroom demographics. The final sections of the report provide policy recommendations based on these findings for universal pre-K programs in New York City and elsewhere.
Diversity as a Component of Quality in Early Education
The racial/ethnic and socioeconomic diversity of preschool classrooms is a key component of their educational quality.
For decades, research on K–12 education has shown that low-income students see gains to their reading and math skills from learning in socioeconomically integrated environments as opposed to attending schools with high concentrations of poverty.5 Racially integrated classrooms also help foster critical thinking skills and reduce racial biases, important traits in today’s complex, multicultural world.6
Adding to the large body of work on children in K–12, new research finds similar cognitive and social benefits in diverse preschool classrooms. A 2015 report from The Century Foundation and the Poverty & Race Research Action Council highlights these findings.7 One study using a large dataset of children from eleven state pre-K programs found that preschool children in classes with higher average socioeconomic status (SES) learned more on average than those in low-SES classrooms—regardless of the children’s own backgrounds.8 A follow-up analysis of that data also found that racial diversity of pre-K classrooms was independently associated with children’s outcomes and that racially diverse classrooms offer advantages for students.9 Another study comparing preschool children in economically mixed classrooms versus high-poverty classrooms found that those in the economically mixed preschools showed greater growth in language skills.10
The Voices Project: Educators Weigh in on why diversity matters in pre-K classrooms
One of the reasons for the greater learning seen in diverse preschool classrooms may be teacher quality. Research shows that preschool classrooms with higher average SES and low minority enrollment tend to attract more skilled preschool teachers.11 However, even after controlling for instructional quality in the classroom, children in diverse preschool settings still show increased learning outcomes; thus, another mechanism by which diverse preschool classrooms promote children’s cognitive growth may be through peer effects.12 Children learn by interacting with peers in the classroom. It is a particular advantage for lower-skilled children to have higher-skilled peers, while higher-skilled children tend to be less affected by the skill level of their classmates. Because children’s exposure to math and language skills outside the classroom is highly correlated with their socioeconomic background, low-SES children therefore may benefit, on average, from having some middle- or high-SES classmates.13
In addition, racially and socioeconomically diverse preschool classrooms may help reduce prejudice among young children. Research shows that children typically develop awareness of racial and social categories by kindergarten, and that exposure to peers helps shape these perceptions.14 One study of Anglo-British preschool children, for example, found that those children in racially integrated classrooms were less likely than those in homogenous classrooms to show racial bias toward minorities.15
But although we know this diversity benefits children, diverse preschool classrooms are a scarce resource in this country.
But although we know this diversity benefits children, diverse preschool classrooms are a scarce resource in this country. According to one study of state pre-K programs, only one in five children was enrolled in a classroom that was both racially and socioeconomically diverse.16 Our early education landscape has evolved as a fractured system, with a mix of public programs like Head Start and state pre-K that mostly restrict eligibility to low-income or at-risk children and private programs that are frequently unaffordable for working families. As a result, many young children attend preschool with peers who mostly have similar socioeconomic backgrounds. In many cases, this means that preschool classrooms are fairly racially homogeneous as well.17
Universal pre-K programs, like the one in New York City, present an important opportunity in an otherwise divided early education delivery system. Open to all children who meet the age and residency requirements, regardless of income, disability, or family background, these programs hold the potential to foster more diverse preschool classrooms. Indeed, city officials have embraced the idea of diverse classrooms as one of the goals for pre-K in New York City. As Deputy Mayor Richard Buery explained in a local television interview in 2015, “We all know of course that prekindergarten programs have a great impact on the wellbeing of young people in low-income neighborhoods . . . But you also can’t discount the value of those young people being in diverse classrooms, with people of a variety of income levels.”18 Mayor de Blasio similarly told The Atlantic, “I’ve always believed there’s a lift-all-boats dynamic in terms of kids learning from each other across cultures, across backgrounds…. Let’s take a classic example of a kid who may come from a middle-class or upper-middle-class white family, that, absent this, might have gone to a different kind of option that might not have been so diverse. This is good for the future of New York City.”19 Realizing this value by creating integrated classrooms, however, requires building diversity as a priority into the design of the program and continually monitoring progress toward this goal.
Methods of Data Analysis
This report uses data on student enrollment in 2014–2015, the first year of New York City’s expanded universal pre-K program and most recent year of data available from the New York City Department of Education, to compare racial and ethnic diversity in pre-K classrooms to that of kindergarten classrooms throughout the city. (Unfortunately, information on socioeconomic diversity in New York City pre-K classrooms is not currently available, an issue which is discussed further in the recommendations at the end of this report.) The definitions, methods, and rationale behind the analysis of this data are described below.
Different Types of Sites
New York City’s universal pre-K program uses a mixed delivery model, with different types of pre-K sites. This mixed delivery model was a key ingredient in the city’s success expanding universal pre-K rapidly because it allowed the city to rely on existing infrastructure in both schools and community-based organizations. Because these different types of sites have different enrollment criteria and processes, this report frequently disaggregates data for pre-K by site type, grouping sites into three main categories: district or charter, ACS, and UPK-only.
In 2014–2015, 40 percent of all pre-K students attended classrooms across over 500 district schools plus six charter schools. The enrollment process for district pre-K programs follows a set of standard admissions priorities similar to the kindergarten enrollment process that are based on geography (students’ residence the in the zone, district, or borough for the school) and sibling status.20
The other 60 percent of pre-K students were enrolled in community-based pre-K programs operated by both nonprofit organizations and for-profit businesses, which the New York City Department of Education refers to as NYCEECs (New York City Early Education Centers). Within these community-based programs, there are two main types of centers with different funding and enrollment models.
Some community-based pre-K programs receive funding from the city’s Administration for Children’s Services and offer additional hours of child care beyond the six hour, twenty minute universal pre-K day, with tuition for the additional hours charged on a sliding scale. These centers typically restrict enrollment to low-income children who qualify for this subsidized care. In this report, these programs are referred to as “ACS” pre-K. In 2014–2015, 22 percent of pre-K students attended ACS programs.
The rest of the community-based sites, which do not receive funding from ACS and are open to all four-year-olds regardless of income, are referred to in this report as “UPK-only.” Unlike with district pre-K, enrollment at these UPK-only centers is not based on geography. Instead, these centers give priority to students who already attended the center for a three-year-old program, who have siblings in the center, whose families currently receive free or subsidized social services from the organization operating the center, or who speak a native language other than English that the center specializes in serving.21 In 2014–2015, 38 percent of pre-K students attended UPK-only programs.
Comparison with Kindergarten
In order to assess the level of diversity in pre-K classrooms, it is helpful to have a baseline for comparison. Comparing pre-K classroom diversity to kindergarten classroom diversity allows us to put the demographics of pre-K in the broader context of public education in New York City.
New York City’s schools are more segregated than those in Philadelphia, Houston, Los Angeles, Phoenix, San Diego, San Antonio, Indianapolis, San Francisco, Jacksonville, or San Jose.22 And according to a 2014 analysis, New York State as a whole has the most segregated schools in the country.23
At the same time, universal pre-K is developing out of an early education landscape that has also historically been segregated—due to limited public access and a private system that sorts students based on ability to pay as well as preference for programs with particular cultural or religious ties. Community-based child care centers and preschools have developed relationships with particular communities and families under that context, and those relationships remain even as universal pre-K classrooms in those centers create the possibility for cultivating more diverse enrollment.
…a single, expanded universal pre-K program poses the opportunity to create pre-K classrooms that are more diverse than the city’s K–12 classrooms, if diversity is built into the program design.
It is unreasonable to expect, therefore, that universal pre-K would immediately solve the problem of segregation that has plagued New York City Public Schools for decades. And yet, pre-K does provide a chance to form a new system, with different enrollment criteria and new recruitment efforts. The linkage of several different early education delivery streams (district and charter schools, ACS-funded centers, and other community-based preschools) into a single, expanded universal pre-K program poses the opportunity to create pre-K classrooms that are more diverse than the city’s K–12 classrooms, if diversity is built into the program design.
Classroom-level Diversity
This report uses the classroom rather than school or site as the primary unit of analysis.24 Looking at classrooms rather than sites provides a better portrait of students’ educational experiences, because a single site could have multiple classrooms with very different demographics, either as a result of natural enrollment variation or because of specific enrollment policies.
At the kindergarten level, for example, a number of schools have gifted and talented or dual language programs that place participating students in self-contained classrooms, separated from “general education” students, often with extreme demographic differences in classrooms as a result.25 And at the pre-K level, some community-based sites operate multiple classrooms with different funding structures, with ACS classrooms enrolling eligible low-income students alongside UPK-only classrooms open to any four-year-old in New York City.26
Pre-K classrooms in New York can typically enroll up to twenty students, per state law, and kindergarten up to twenty-five students, per the union-negotiated contract.27 The classroom-level analysis in this report was restricted to pre-K and kindergarten classrooms enrolling ten to thirty students. The small percentage of pre-K and kindergarten classrooms enrolling fewer than ten or more than thirty students—either because of special circumstances or aggregated data—were excluded from this analysis.28
Measures of Racial/Ethnic Diversity
There are many different ways to measure racial and ethnic diversity in schools—each with its own advantages and limitations. This report uses absolute measures of racial/ethnic diversity, rather than comparing schools against a citywide or community school district average. Although local context is essential in addressing school integration and equity, absolute measures provide a useful initial benchmark for measuring students’ overall exposure to racial/ethnic diversity and potential educational consequences of that—without passing judgment about what demographic targets would be equitable or feasible in a given classroom. This measure is intended as the opening of a conversation on integration and diversity, not the final word.
This analysis classifies pre-K and kindergarten classrooms on a spectrum of diversity based on the size of the largest racial or ethnic group in the classroom, using 70 percent as a midpoint. Classrooms in which with the largest racial or ethnic group constitutes 50 percent or less of the student body (“plurality” classrooms with no racial/ethnic majority), are considered highly diverse, and those with a racial/ethnic majority of 51–70 percent are considered fairly diverse. Classrooms with a majority constituting 71–90 percent of the student body are considered fairly homogeneous, and those with a majority in excess of 90 percent are considered highly homogeneous. These numerical thresholds are derived loosely from the literature on school integration. Several studies on the effects of racial diversity in education and the “critical mass” of minority representation needed to foster the educational benefits of diversity have found that a school’s culture is at risk of being dominated by one group—and consequently, alienating other students—if the majority group constitutes more than 70 percent of the student body.29
This report also considers all racial and ethnic groups equally in the basic definition of diversity. Under these definitions, a classroom with 50 percent Asian and 50 percent white enrollment and a classroom with 50 percent black and 50 percent Hispanic enrollment would both be considered plurality classrooms. In a school system as diverse as New York City’s, with no racial or ethnic majority, this measure has the advantage of not framing diversity in overly simplistic terms of white versus non-white students. However, this is not to minimize the historical discrimination that students of color in the city have faced30 and the particular underrepresentation of black and Hispanic students in the city’s most elite schools and programs.31 The unique experiences of different racial and ethnic communities must be considered in policies to measure and promote integration. To that end, alongside the diversity analysis based on size of the largest racial or ethnic group, this report provides additional data on which racial and ethnic groups are most represented in pre-K classrooms across different site types.
Diversity in Overall Enrollment
Overall, the children enrolled in New York City’s universal pre-K program in 2014–2015 were a racially and ethnically diverse group, with no racial/ethnic majority. Of the 52,741 children enrolled in pre-K, 37 percent were Hispanic, 30 percent black, 17 percent white, 13 percent Asian, 1.5 percent Native American, and 1.5 percent multi-racial. Compared to the 88,723 kindergartners enrolled that year, pre-K children were slightly less likely to be Hispanic or Asian, and slightly more likely to be black, but in general the demographics of pre-K reflected the demographics of kindergarten (see Figure 1).
This demographic diversity and similarity to the kindergarten population reflects extensive outreach and recruitment efforts by the New York City Department of Education (DOE) to enroll children of all backgrounds from communities throughout the city.32
Diversity at the Classroom Level
While overall pre-K enrollment is racially diverse, however, individual pre-K classrooms are more homogeneous. In half of all pre-K classrooms, more than 70 percent of children come from a single racial or ethnic group.
Pre-K classrooms are also on average more racially homogeneous than kindergarten classrooms. In one-sixth of all pre-K classrooms, more than 90 percent of students come from the same racial or ethnic group, whereas only one-eighth of all kindergarten classrooms has that same level of racial homogeneity (see Figure 2). Across both grades, just one in five classrooms is highly racially diverse, with no racial or ethnic group comprising more than 50 percent of enrollment.
Breaking down this data reveals that the patterns of racial diversity in pre-K classrooms look quite different depending on site type (see Figure 3). The distribution of district and charter pre-K classrooms by level of racial diversity is very similar to the breakdown of kindergarten classrooms. ACS pre-K classrooms, however, are about half as likely as kindergarten classrooms to have highly diverse plurality enrollment with no majority over 50 percent, and they are almost twice as likely to have high levels of racial homogeneity with a majority group constituting over 90 percent. UPK-only classrooms are also more likely than kindergarten classrooms to have a racial majority in excess of 90 percent.
There are also differences among different types of pre-K classrooms in the prevalence of students of a particular race or ethnicity (see Figure 4). Once again, district and charter pre-K classrooms look quite similar to kindergarten classrooms. However, UPK-only classrooms are about 50 percent more likely than kindergarten classrooms to be majority white or majority Asian. Meanwhile, ACS classrooms are somewhat more likely than kindergarten classrooms to be majority Hispanic and considerably more likely to be majority black.
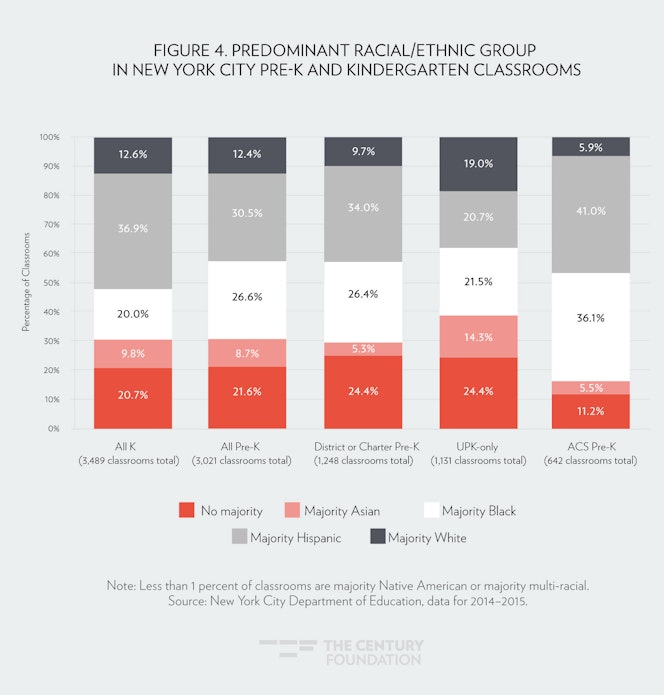
This same pattern exists when looking only at highly homogeneous classrooms with over 90 percent enrollment of a single racial or ethnic group (see Figure 5). UPK-only classrooms have the highest proportion of classrooms with over 90 percent Asian or over 90 percent white enrollment, whereas ACS pre-K has the highest proportion of classrooms that are over 90 percent black or 90 percent Hispanic.
Differences within Districts
Citywide, pre-K classrooms are more likely than kindergarten classrooms to be racially homogeneous, but district by district, the comparison between pre-K and kindergarten varies. For example, in nineteen of the city’s thirty-two community school districts, pre-K classrooms are more likely than kindergarten classrooms in the same district to enroll more than 90 percent of students from a single racial or ethnic group; however, in the remaining thirteen districts, pre-K classrooms are less likely than kindergarten classrooms to have those high levels of racial homogeneity.
These differences among districts are important because the experiences of some districts that already have diverse pre-K enrollment might point toward strategies that could be used to diversify pre-K enrollment in other districts. This section offers detailed analysis of two community school districts, Districts 13 and 20, in an effort to highlight some of those differences. Both districts are located in Brooklyn, and both have diverse overall enrollment. However, in District 13, pre-K classrooms are more likely than kindergarten classrooms to be racially diverse, whereas in District 20, pre-K classrooms are on average more racially homogeneous than kindergarten classrooms.
More Diverse Pre-K in District 13
In Community School District 13, pre-K classrooms are on average more racially diverse than kindergarten classrooms. This is perhaps due in part to the high proportion of district or charter schools offering pre-K and a more even distribution of white students across pre-K as compared to kindergarten classrooms.
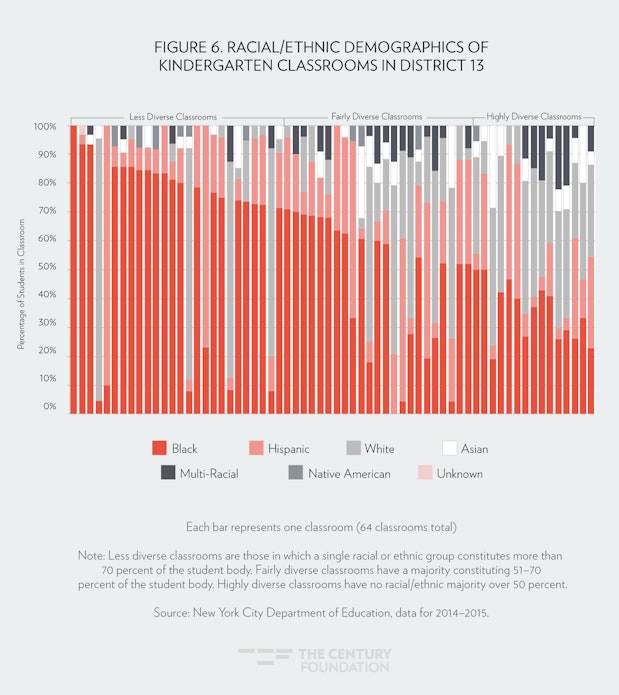
District 13 includes a mix of affluent and gentrifying neighborhoods in Brooklyn, encompassing all or part of Brooklyn Heights, DUMBO, Fort Greene, Clinton Hill, Bedford Stuyvesant, Prospect Heights, Park Slope, Crown Heights, South Williamsburg, Boerum Hill, Gowanus, Vinegar Hill, and Downtown Brooklyn.33 Overall kindergarten enrollment is racially diverse. Of the 1,575 kindergartners enrolled in the district in 2014–2015, just over half (51 percent) were black, 22 percent were white, 18 percent were Hispanic, 5 percent were multi-racial, 4 percent were Asian, and 1 percent were Native American. Kindergarten classrooms in District 13 were more diverse than the city average, with three out of five classrooms having no single racial or ethnic group greater than 70 percent, and one in five classrooms having no racial majority (see Figure 6).
District 13 enrolls about two-thirds as many pre-K students as kindergarten students (973 versus 1,575, respectively). Overall pre-K enrollment is demographically similar to kindergarten—though pre-K students are slightly more likely than kindergartners to be Hispanic and slightly less likely to be black. Across both pre-K and kindergarten, only about 14 percent of students in District 13 speak a language other than English at home, compared to a citywide average of 30 percent of students in pre-K and 37 percent of students in kindergarten.
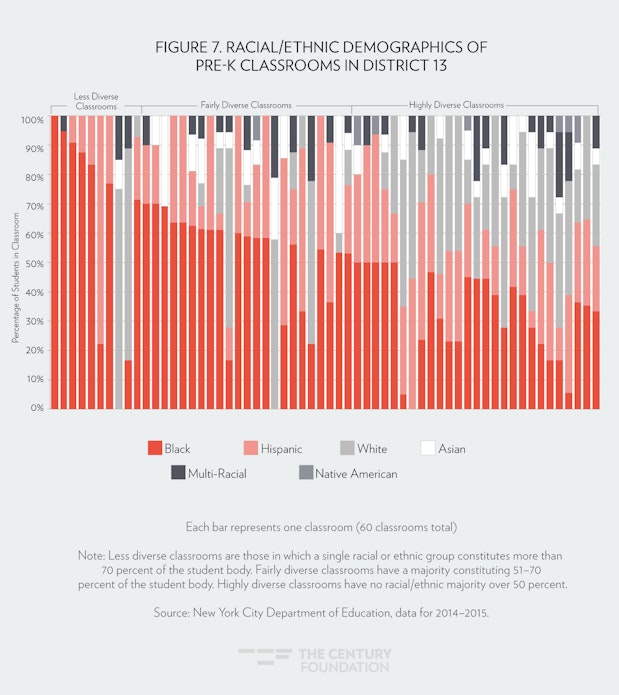
While kindergarten classrooms in District 13 are already relatively diverse, Pre-K classrooms in District 13 are on average more diverse than kindergarten classrooms. A full 83 percent of pre-K classrooms in the district have no racial/ethnic group greater than 70 percent, and nearly half (45 percent) of all pre-K classrooms have no racial/ethnic majority (see Figure 7).
There are several possible reasons why District 13’s pre-K classrooms are more diverse than its kindergarten classrooms. To begin with, the majority of pre-K classrooms in District 13 (twenty-two out of twenty-seven) are located in district or charter schools, which citywide tend to be more racially diverse than UPK-only or ACS classrooms.
White students in District 13 also tend to be more evenly distributed throughout pre-K classrooms than throughout kindergarten classrooms. More than a quarter (26 percent) of white kindergartners in District 13 are enrolled in classrooms where more than 70 percent of their peers are also white. At the kindergarten level, many white students are concentrated in a single school, P.S./M.S. 8 Robert Fulton in Brooklyn Heights, which has the most kindergarten classrooms with over 70 percent white enrollment of any school in the district. However, this school does not offer pre-K, and white students are more evenly distributed among schools and classrooms at the pre-K level. Only 14 percent of white pre-K students in District 13 are enrolled in classrooms where more than 70 percent of their peers are also white.
Thus, one of the lessons from the relative success of District 13’s diverse pre-K classrooms is the extent to which having a few highly segregated schools can have a negative overall effect on racial diversity across schools—as seen in District 13 kindergarten—whereas addressing these spots of racial concentration could have positive effects across the system. P.S. 8 was recently rezoned to address overcrowding; however, while the new attendance zones should increase white enrollment at a neighboring school where currently most students are black or Hispanic, making that school more diverse, they will also likely make P.S. 8 even less diverse. The few public housing buildings that had been zoned for P.S. 8 were moved to the neighboring school as part of the rezoning, promising to further increase the percentage of white and affluent students at P.S. 8.34 There is some hope, however, in district-wide efforts underway in District 13 to promote school integration through a system of equitable choice that balances families’ school preferences with an algorithm to promote socioeconomic diversity in schools, sometimes called “controlled choice.”35 Such a policy has the potential to diversify both pre-K and K–12 classrooms.
More Homogeneous Pre-K in District 20
In Community School District 20, the pre-K landscape looks very different from District 13. Here, pre-K classrooms are on average more homogeneous than kindergarten classrooms, reflecting a majority of classrooms in community-based sites—many with specific cultural, linguistic, or religious ties—and few district or charter pre-K classrooms.
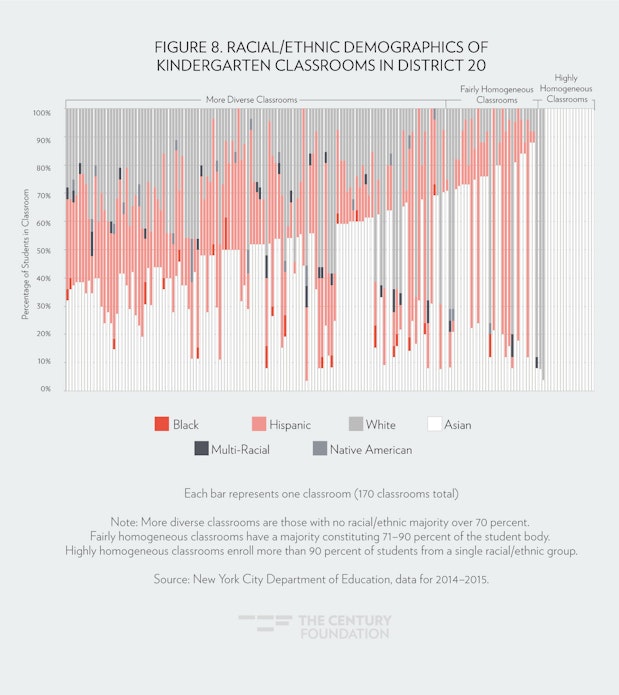
District 20, located in southwest Brooklyn, includes the neighborhoods of Borough Park, Bay Ridge, Dyker Heights, Bath Beach, Bensonhurst, the southern part of Sunset Park, and the Fort Hamilton Army Base. The area is home to large immigrant communities from Russia, Asia, Latin America, and the former USSR, and to a large Orthodox Jewish community that generally sends its children to yeshivas rather than public schools.36 Overall, kindergarten enrollment in District 20 is racially and linguistically diverse. Of the 4,332 kindergartners enrolled in 2014–2015, 47 percent were Asian, 26 percent white, 25 percent Hispanic, and less than 1 percent each multi-racial, black, and Native American. And kindergarten classrooms in District 20 are more racially diverse than the citywide average. In 2014–2015, 35 percent of kindergarten classrooms were plurality classrooms with no racial/ethnic majority, and a full 71 percent of classrooms had no racial or ethnic group constituting more than 70 percent of the student body. Only 11 percent of kindergarten classrooms have over 90 percent enrollment of a single racial or ethnic group (see Figure 8).
District 20’s pre-K classrooms, however, are significantly less likely than kindergarten classrooms to be racially diverse. District 20 enrolls only about one-third as many students in pre-K as in kindergarten (1,532 versus 4,332, respectively). Compared to kindergartners, pre-K students are more likely to be white (44 percent versus 26 percent) and less likely to be Hispanic (15 percent versus 25 percent) or Asian (41 percent versus 47 percent). A majority (56 percent) of pre-K classrooms in the district have over 90 percent enrollment of a single racial or ethnic group. Only 32 percent of pre-K classrooms have no racial/ethnic group over 70 percent (see Figure 9).
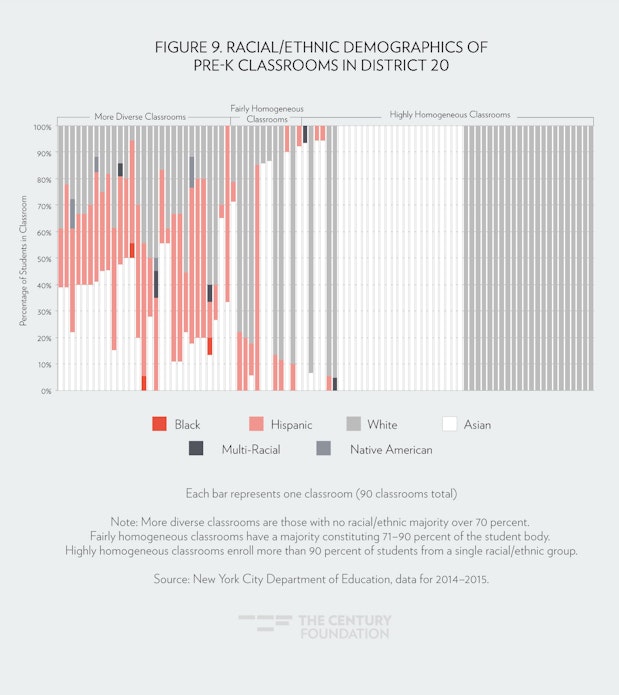
This dramatic difference in diversity between kindergarten and pre-K classrooms mirrors patterns in home language diversity. District 20 is a very linguistically diverse district, with 67 percent of kindergartners and 61 percent of pre-K students speaking a language other than English at home. Roughly a third of students in both pre-K and kindergarten speak Mandarin, Cantonese, or another Chinese language at home, and another 16 percent of kindergartners and 9 percent of pre-K students speak Spanish. Arabic, Russian, and Yiddish speakers also each make up 3–6 percent of kindergarten and pre-K enrollment.
At the kindergarten level, most classrooms mix together students with different home languages. Just over half of all kindergarten classrooms have no linguistic group making up more than 50 percent of the student body, and only 8 percent have more than 90 percent of students with the same home language. At the pre-K level, however, most classrooms have large majorities of a single home language. Two-thirds of pre-K classrooms have more than 70 percent of students with the same home language, and one-third of classrooms have more than 90 percent of students with the same home language.
Concentrations in pre-K by language and race/ethnicity often overlap. There are fifty pre-K classrooms in District 20 in which more than 90 percent of students come from the same racial or ethnic group, and in forty-seven of these classrooms, more than 70 percent of students also have the same home language: twenty-five classrooms with predominantly Chinese speakers, thirteen predominantly English, six Yiddish, and three Russian. Of District 20’s ninety pre-K classrooms, two-thirds (fifty-nine) are UPK-only, sixteen receive ACS funding, and just fifteen are located in district or charter schools. All of the forty-seven classrooms in which more than 90 percent of students come from the same racial or ethnic group and more than 70 percent of students have the same home language are UPK-only or ACS sites.
Thus, in District 20, the relative lack of racial diversity in many pre-K classrooms is likely related to the fact that some of these classrooms are located in private religious schools or centers that focus on serving particular populations, such as Chinese immigrant, Orthodox Jewish, Russian speaking, or Greek Orthodox communities. Disproportionately high enrollment of white students in District 20 pre-K may also stem from the fact that pre-K enrolls some white students in community-based classrooms who go on to attend kindergarten in religious schools.
One way to increase diversity across District 20 pre-K classrooms would be to create more district pre-K classrooms. The fifteen district pre-K classrooms that enrolled students in 2014–2015 were all quite racially diverse, with the largest racial or ethnic group in each classroom ranging from a low of 39 percent to a high of 67 percent. However, a major obstacle to adding additional district pre-K classrooms is that District 20 has many schools that are already overcrowded, as a result of increasing enrollment in the district.37 Creating more district classrooms would likely have to be part of longer-range facilities and enrollment planning to increase school capacity in the district.
The Role of Housing Segregation
While the analysis of pre-K diversity in this report has focused on differences among different types of pre-K settings, geography is a powerful factor that is likely driving many of these patterns. In New York City and across the country, residential segregation is a major contributor to school segregation. And this effect could possibly be particularly pronounced at the pre-K level, if most families opt for programs closest to home.
As the map below shows, the demographics of pre-K programs in New York City in many cases reflect the geography of the city. The top layer of this map shows pre-K sites, marked with circles color-coded for the majority race/ethnicity of children at that program. The bottom layer shows census tracts, color-coded for the majority race/ethnicity of all residents living in that area. Pre-K programs with particular racial or ethnic majorities are concentrated in different parts of the city, echoing the racial makeup of residents of those neighborhoods. There are clusters of majority-Hispanic pre-K programs located in the South Bronx, majority-black pre-K programs in central Brooklyn, majority-Asian programs in Flushing, Queens, and majority-white programs across Staten Island—mirroring the demographics of those areas.
Map. NYC Pre-K Sites and Census Tracts, By Race/ETHNICITY
This link between pre-K demographics and neighborhood demographics may help explain some of the patterns observed in the data in this report. For example, ACS classrooms may be more likely than other types of pre-K sites to be located in majority-black and majority-Hispanic neighborhoods, which would help explain why they are more likely to have majority-black or majority-Hispanic enrollment. Furthermore, the fact that pre-K classrooms overall are on average more racially homogeneous than kindergarten classrooms might reflect a preference among families to attend pre-K close to home. Some pre-K programs may be attracting most of their students from a smaller and more homogeneous geographic area—perhaps just a few blocks—than kindergarten classrooms in the same neighborhoods, which enroll students from across a larger attendance boundary capturing a more diverse population.
While this report does not test these hypotheses, it is important to keep in mind the strong relationship between residential patterns and school demographics when drawing conclusions from the data. In order to create integrated pre-K classrooms, communities and leaders may have to overcome the hurdles of residential segregation or develop solutions to integrate neighborhoods and schools at the same time. Realistically, it would be very difficult to create diverse pre-K classrooms in some of the city’s most segregated neighborhoods anytime soon.
New York City has many areas with different racial demographics that are located close together, creating opportunities for diverse classrooms that draw from across these neighborhood boundaries.
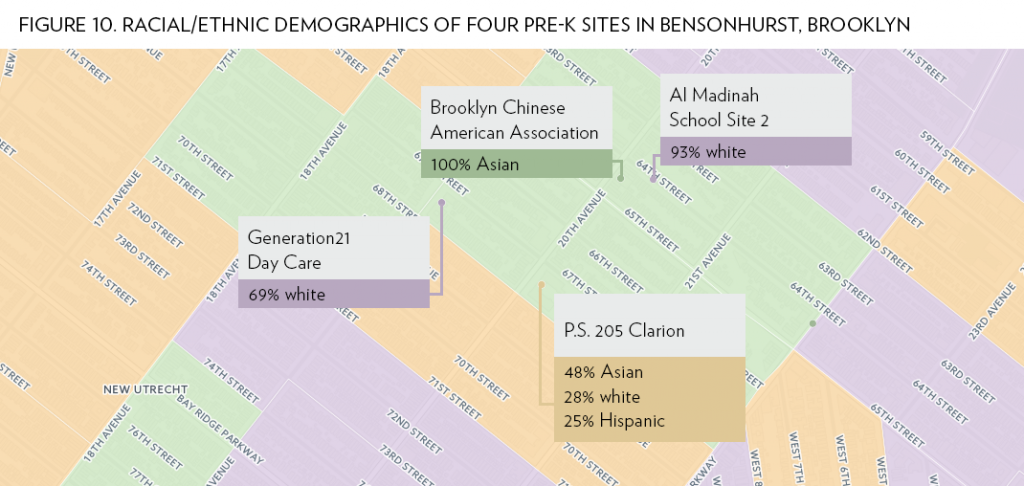
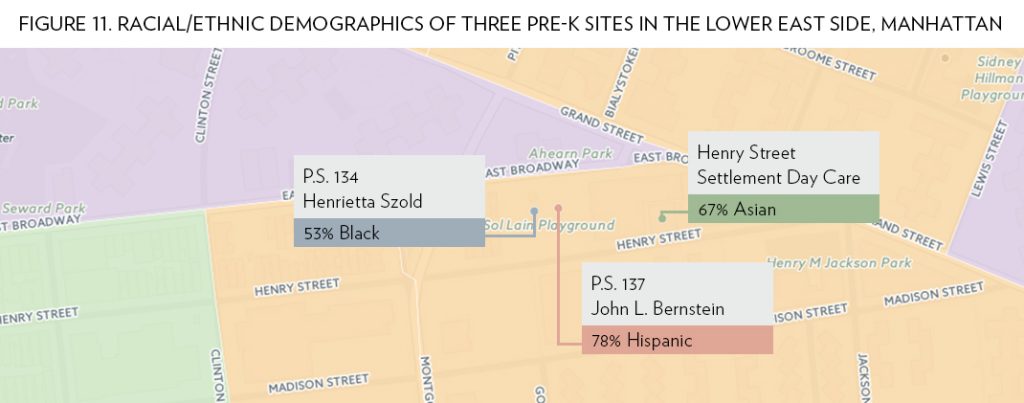
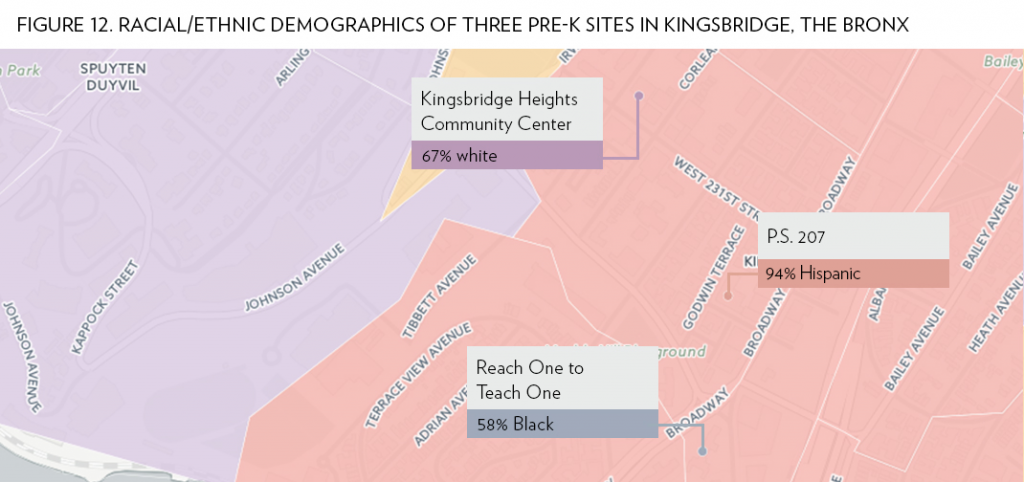
However, the geographic patterns also reveal places where there are presently untapped opportunities for diverse pre-K. For example, in Bensonhurst, Brooklyn, four pre-K sites located within just a few blocks of each other have strikingly different demographics: there are two majority-white programs, one that is 100 percent Asian, and another where the student body is more evenly split among Asian, white, and Hispanic students (see Figure 10). In the Lower East Side of Manhattan, a majority black, majority Hispanic, and majority Asian program are located on the same block (see Figure 11). In Kingsbridge in the Bronx, a ten-minute walk will take you past one majority white, one majority Hispanic, and one majority black pre-K program (see Figure 12).
While neighborhood segregation is an important factor in current pre-K demographics, it need not be the only factor. New York City has many areas with different racial demographics that are located close together, creating opportunities for diverse classrooms that draw from across these neighborhood boundaries.
Policy Recommendations for New York City
The data on diversity in New York City’s pre-K classrooms from the first year of the expansion point toward several strategies that the city can implement to increase opportunities for diverse classrooms.
Track and analyze classroom diversity. In order to create more opportunities for diverse classrooms, education leaders must understand the current state of classroom diversity, but too often this data is not collected or analyzed. When asked about ways to address school segregation in an interview on public radio in June 2016, Mayor de Blasio said, “I think the pre-K program has […] been an example of an initiative that has had a really good impact in terms of diversity.”38 But thus far, New York City has not been collecting or analyzing all of the data needed to assess universal pre-K’s impact on diversity. Pre-K was not included in the first annual diversity report that the New York City Department of Education (DOE) released in December 2015, which includes diversity data for each grade in each school, as mandated by a new law passed by the New York City Council earlier that year.39 Moreover, there is very little information on the socioeconomic status of pre-K students. The most common marker of socioeconomic status in K–12 education, eligibility for free or reduced-price lunch, is not available for all pre-K students because children in community-based pre-K sites do not fill out federal free and reduced-price lunch forms. The DOE does have the ability to see whether pre-K students have been identified by the city’s Human Resources Administration (HRA) as receiving certain types of public assistance, but thus far analyses of this data have not been provided to the public.
- DOE should collect better socioeconomic data on pre-K students—by adding a question about family income to enrollment forms and/or better using the HRA eligibility data.
- DOE should include data on pre-K enrollment in the annual diversity report.
Provide families with information and transportation to encourage them to consider a wider range of pre-K programs. New York City has made family choice one of the hallmarks of universal pre-K: families select up to twelve pre-K programs on their application, and in the first round of admissions for fall 2016, 71 percent of families received their first choice, and 85 percent of families received one of their top three choices.40 But past experiences with school choice in New York City and elsewhere have shown that creating family resource centers and improving families’ access to information about all of their school options are crucial components of making choice-based school enrollment more equitable.41 Families’ choices are limited by the information to which they have access. Right now, the city’s online directory and interactive map provide limited information and focus on finding programs based on location.42 If families could search by quality ratings, languages supported, or other special features of a program, more families might seek out options beyond their local neighborhood.
Lack of transportation can also be a constraint on choice. As the map of pre-K programs demonstrates, geography is an important driver of racial and ethnic isolation in pre-K programs. One important strategy for increasing opportunities for diverse classrooms, therefore, is enabling pre-K classrooms to draw together students from multiple neighborhoods. But right now, that option is only available to families with the means to arrange and pay for transportation on their own. While New York City provides students in K–12 schools who live further than walking distance from school with yellow bus service or free or reduced-fare transit cards, pre-K families do not currently receive any transportation support. Families might be willing to travel farther to pre-K programs with higher quality rankings or appealing programmatic offerings if they had logistical and financial support.
- DOE should expand the online pre-K directory to include more details about each pre-K site, including information such as mission statements, special offerings and features of the program, parent survey results, and quality assessment data. DOE has already begun developing these expanded pre-K site profiles.
- DOE should subsidize transportation for pre-K families. While an ultimate goal might be to extend the transportation policy in effect for kindergartners to pre-K students, the city could increase opportunities for diverse classrooms in the interim with partial transportation programs such as offering transit passes only, limiting eligibility to low-income families, or beginning with a program to offer transportation in certain community school districts only and monitoring the popularity and effectiveness of the program.
Support efforts to increase diversity in classrooms at community-based sites. The data from New York City show that community-based pre-K classrooms, both ACS and UPK-only, are more likely to be highly racially homogeneous. These demographic patterns are probably due in part to the locations of the centers. Some of this homogeneity is also the result of ACS centers accepting only eligible low-income students and UPK-only centers having established ties with particular communities based on language, culture, or religion.
There are good reasons to support both ACS and UPK-only centers in their mission to serve particular communities. Community-based programs with deep connections to local neighborhoods provide important services for children and families. Many of these centers offer additional hours of child care, whether subsidized through ACS or charging market-rate tuition, beyond the six hour, twenty minute day of free universal pre-K. That extended day is an important resource for working families. Continuity in early care and education is also important for children.44 Many community-based sites establish relationships with children and their families before age 4 by providing child care or other social services, so it often makes sense for children to stay in those centers. Moreover, the initial results for program quality assessments across the city’s universal pre-K sites found that the programs with highest quality programs were most likely to be community-based sites. 45
However, there can be benefits to increasing diversity even in centers with a focus on particular communities. For example, Little Star of Broome Street, a subsidized child care center operated by the Chinese-American Planning Council, Inc., has some UPK-only seats open to children regardless of income. Little Star enrolls many children from Chinese American families who are drawn to the center because of the school’s ability to provide Chinese language support, but it also enrolls a number of Hispanic and African American children. Mary Cheng, the center’s director, says that she embraces the income and cultural diversity they already have:
“I think it’s good for [the parents] to see that it doesn’t matter where you come from, that education is just something that’s a basic need for all children, and regardless of what your income is, look, we’re all learning together…. For the kids, I think it is cultural diversity…. I think to be able to unify them—to understand we may come from different backgrounds, but our goal is the same for the children—I think that’s something that all kids need to learn.”46
Cheng would like to further diversify the population at the school but said the center needs support for the marketing needed to reach out to different communities; right now, most families find out about the center from friends or family.
The DOE has already made an important step toward creating more possibilities for diverse enrollment in community-based centers by creating a seamless pre-K application process whereby families can rank their pre-K choices—district, charter, or community-based pre-K—through one unified system. This system did not go into effect until enrollment for fall 2015, so it is not reflected in the data analyzed in this report. When available, enrollment data for 2015–2016 should be analyzed to see if there is any increase in diversity in community-based classrooms.
The DOE can also help to create more opportunities for diverse enrollment in community-based centers in New York City by providing centers with more resources to assist in marketing to the local community and enrolling a diverse group of children.
- DOE should create a pre-K pilot diversity admissions program for community-based pre-K sites interested in diversifying their enrollment. This program would be modeled after the elementary school diversity pilot launched in the 2015–2016 school year.47 Pre-K sites accepted into the pilot program would be allowed to develop new admissions priorities to promote diversity by considering socioeconomic status or other educational risk factors. The district would also support pre-K programs in developing outreach strategies or programmatic changes designed to boost diversity, such as implementing a dual-language model48 or adding wraparound services beyond the six hour, twenty minute universal pre-K day.
Facilitate blended funding. In 2014–2015, seventy-four community-based pre-K sites had both ACS and UPK-only classrooms, but, in accordance with DOE regulations at the time, none of these centers blended classrooms; rather, eligible low-income students were in ACS classrooms and all other pre-K students were in separate classrooms—creating the risk of unintended racial and socioeconomic segregation as a result of sorting of children between classrooms based on funding eligibility. Starting with fall 2015, DOE created the opportunity for centers to apply for a waiver that would allow them to blend enrollment of ACS students and other students into the same classrooms.49 This blending could have positive effects on socioeconomic and racial diversity in classrooms. Data for enrollment in 2015–2016 should be analyzed to see how many centers seized this opportunity, but the city should also work toward a system that expects centers to blend students with different funding as the default and supports them in this work.
- DOE and ACS should work together to develop a system for blending DOE and ACS funds and should require centers to integrate students with different funding in classrooms whenever possible. Both agencies could learn from centers that are already doing this blending in order to develop a protocol for other centers to use with DOE and ACS support.
- DOE and ACS should encourage centers with ACS funding that are looking to expand or fill empty seats to consider applying for funding to add some UPK-only seats at their center. Some ACS-funded centers have struggled in the past to fill all of their child care seats.50 Adding UPK-only seats—which have fewer eligibility requirements and a much simpler paperwork and enrollment process—could help them attract new families with the added benefit of creating a chance for more diverse classrooms.
Expand district and charter pre-K, and include pre-K as a key component of school integration efforts. District and charter pre-K classrooms are on average more diverse than other types of pre-K classrooms. This may be explained in part by their location: some neighborhoods have more district pre-K classrooms than others, largely due to space constraints in public school buildings. But the relative diversity in district pre-K classrooms may also be because these programs are better known by a wider variety of parents, draw families from a larger geographic area, and are less likely to target specific communities. For those reasons, DOE should look for existing opportunities to add pre-K classrooms in schools and factor pre-K into future facilities planning.
Moreover, pre-K should be included and leveraged in broader strategies to diversify schools. Efforts are currently underway in a number of different schools and community school districts in New York City to improve racial and socioeconomic integration. In November 2015, seven schools received permission to implement new enrollment priorities to encourage diversity by reserving seats for at-risk students—such as those eligible for free and reduced-price lunch, English Language Learners, students from families impacted by incarceration, or students who are in the child welfare system—and the following spring the DOE invited more schools to apply for this opportunity.51 Community School Districts 1 and 13 are both working on efforts to integrate schools across the district using “controlled choice,”52 and District 3 is in the middle of school rezoning efforts aimed at increasing integration across some of the district’s elementary schools.53
Pre-K enrollment—across all site types—should be considered as part of these efforts to create new enrollment strategies. It is beneficial to integrate pre-K classrooms along with kindergarten classrooms, and, perhaps more importantly, starting integration efforts in pre-K could pave the way for integration in later grades. Researcher Jennifer Burns Stillman found that middle-class parents in New York City are more likely to enroll their children in higher-poverty public schools starting with pre-K rather than later grades.54
- As space becomes available, DOE should consider adding more pre-K classrooms in district and charter schools.
- DOE should not count pre-K as one of the “non-mandatory” programs that can be cut to relieve overcrowding in schools that cannot fit all of their zoned students, as current policy mandates.55
- Community Education Councils and school leaders should make sure that the diversity of universal pre-K enrollment is part of zoning and enrollment discussions and that the enrollment policies for pre-K are addressed in plans to integrate schools.
Lessons for Other Cities and States
New York City’s ambitious universal pre-K expansion offers an example from which other cities or states interested in expanding universal pre-K can learn. The city’s successes and challenges so far point toward several design principles for promoting diversity and equity in universal pre-K programs:
- Collect and analyze data on student diversity at the classroom level, early and often. This data is essential for setting diversity goals and measuring progress.
- Strive to create a unified system across different pre-K settings. Centralized enrollment and recruitment systems make it easier for community-based pre-K programs to attract and enroll families of different backgrounds and can help prevent racial or socioeconomic stratification among different settings.
- Make diversity, equity, and quality priorities in pre-K admissions and program design. Admissions policies must balance multiple priorities. While family choice, geographic proximity, and continuity for children and siblings are common objectives, admissions policies can and should specifically address the goals of creating diverse classrooms and promoting equitable access to high-quality programs. In choice-based enrollment systems, this requires two things. First, families must have the information and transportation needed to allow them to attend a wide range of programs. Second, admissions policies should be able to consider socioeconomic status or academic risk factors—rather than relying only on free market choice—to promote diverse enrollment.
- Address blended funding at a system level. State or city agencies should develop protocols for blending different early education funding streams that place as much of the compliance burden as possible on the agency rather than individual centers and that allow for blended classrooms that bring together children with different funding eligibility.
- Leverage pre-K to promote diversity in K–12 schools. When possible, pre-K enrollment should be considered alongside K–12 enrollment. Diverse pre-K classrooms can lay a foundation for diverse classrooms in kindergarten and beyond.
Cities and states should factor these principles into the design of universal pre-K programs, but federal government, philanthropy, and national early childhood organizations also have a role to play in furthering diversity in early education.56 The federal government should factor diversity into early childhood programming, creating specific funding for work on equity comparable to current quality set-asides. Philanthropy could help fund the research and experimentation needed to develop strong models for diverse preschool enrollment. And the major national early childhood organizations should make an explicit commitment to diversity and equity part of their mission.
Conclusion
Thus far, many of the efforts to support and expand early education in our country have focused on access. Indeed, too many children still lack the opportunity to attend any public preschool. According to data from the National Institute for Early Education Research, just one in three four-year-olds nationwide is enrolled in state-funded pre-K.57
But access must be accompanied by quality, and diversity must be part of that equation. We know far too well from experience in K–12 education that separate schools for black and white, or rich and poor, are rarely ever equal. We must make sure that early education does not repeat these mistakes but rather includes strong efforts to promote racially and socioeconomically diverse classrooms where possible.
But while universal pre-K has succeeded in enrolling children from many different backgrounds, there is untapped potential for creating more racially and socioeconomically diverse pre-K classrooms.
New York City’s universal pre-K program has opened a huge opportunity in providing all four-year-olds in the city with the chance to attend full-day early education programs. City officials deserve credit for this accomplishment and for highlighting diverse enrollment as one of the goals for the program. Far too often, diversity is missing from the conversation on early childhood education altogether. But while universal pre-K has succeeded in enrolling children from many different backgrounds, there is untapped potential for creating more racially and socioeconomically diverse pre-K classrooms. There is more that the city can and should do to promote integrated learning environments for students, beginning with our youngest learners. Other cities and states would do well to watch and learn from the New York City’s progress so far and improvements to come.
Acknowledgments
The author would like to thank the New York City Department of Education for providing data and information for this report; Eden Berdugo for assisting with research; Mary Cheng for providing an interview; Nicole Mader for sharing geographic data; and Matthew Gonzalez, Clara Hemphill, Shelby Miller, and David Tipson for providing helpful feedback on drafts.
The interactive map “Pre-K sites and Census Tracts, By Race/Ethnicity” was created by Simon Glenn-Gregg. All other graphics in this report were produced by Abigail Grimshaw.
Notes
- “Mayor de Blasio Announces Over 68,500 Students Enrolled in Pre-K for All,” New York City Office of the Mayor, December 18, 2015, http://www1.nyc.gov/office-of-the-mayor/news/954-15/mayor-de-blasio-over-68-500-students-enrolled-pre-k-all; and Eliza Shapiro and Brendan Cheney, “City Enrolls 68K in Pre-K, with Big Growth in Poorest Neighborhoods,” Politico New York, December 18, 2015, http://www.politico.com/states/new-york/city-hall/story/2015/12/city-enrolls-68k-in-pre-k-with-big-growth-in-poorest-neighborhoods-029284. For estimate of the number of four-year-olds, seeBruce Fuller and Elise Castillo, “Failing to Count Children Entering Catholic, Charter, and Jewish Schools, New York May Fall Short of Universal Pre-K” (Berkeley, Calif.: University of California—Berkeley, April 2015), 3, http://gse.berkeley.edu/sites/default/files/docs/De%20Blasio%20falls%20short%20of%20universal%20pre-k%20-%20Berkeley%20brief%20-%20April%202015_kn_BF888.pdf. The figure for kindergarten enrollment excludes children whose IEPs require pre-K in non-public settings. See Office of the Mayor, Office of Management and Budget, Department of Education, Administration for Children’s Services, Ready to Launch: New York City’s Implementation Plan for Free, High-Quality, Full-Day Universal Pre-Kindergarten, January 2014, 14, n. 1, http://www1.nyc.gov/assets/home/downloads/pdf/reports/2014/Ready-to-Launch-NYCs-Implementation-Plan-for-Free-High-Quality-Full-Day-Universal-Pre-Kindergarten.pdf.
- Westat, New York City’s Pre-K for All: Family Perceptions, February 19, 2016, http://schools.nyc.gov/NR/rdonlyres/35669F51-084F-42D7-BCE0-457E0F27F067/0/BranchAssociatesFamilyPerceptionsReport21916.pdf
- “Mayor de Blasio Announces Over 68,500 Students Enrolled in Pre-K for All,” New York City Office of the Mayor, December 18, 2015, http://www1.nyc.gov/office-of-the-mayor/news/954-15/mayor-de-blasio-over-68-500-students-enrolled-pre-k-all.
- Halley Potter, Lessons from New York City’s Universal Pre-K Expansion: How a Focus on Diversity Cold Make It Even Better, The Century Foundation, May 13, 2015, https://tcf.org/content/report/lessons-from-new-york-citys-universal-prek-expansion/
- Richard D. Kahlenberg, All Together Now: Creating Middle-Class Schools through Public School Choice (Washington, D.C.: Brookings Institution Press, 2001).
- Amy Stuart Wells, Lauren Fox, and Diana Cordova-Cobo, How Racially Diverse Schools and Classrooms Can Benefit All Students, The Century Foundation, February 9, 2016, https://tcf.org/content/report/how-racially-diverse-schools-and-classrooms-can-benefit-all-students/. Brief of 553 Social Scientists as Amici Curiae in Support of Respondents, Parents Involved v. Seattle School District, No. 05-908, and Meredith v. Jefferson County, No. 05-915 (2006), http://civilrightsproject.ucla.edu/legal-developments/court-decisions/statement-of-american-social-scientists-of-research-on-school-desegregation-submitted-to-us-supreme-court/amicus_parents_v_seatle.pdf.
- See Jeanne L. Reid and Sharon Lynn Kagan, A Better Start: Why Classroom Diversity Matters in Early Education (Washington, D.C., and New York: The Century Foundation and the Poverty & Race Research Action Council, April 2015), https://tcf.org/content/report/a-better-start/.
- Jeanne L. Reid, “Socioeconomic Diversity and Early Learning: The Missing Link in Policy for High-Quality Preschools” in The Future of School Integration, ed. Richard D. Kahlenberg (New York: The Century Foundation, 2012), 67–126, https://tcf.org/content/book/the-future-of-school-integration/.
- Jeanne L. Reid, “The Racial and Ethnic Composition of Pre-Kindergarten Classrooms and Children’s Language Development,” Penn State Law Review 119, no. 3 (2015): 645-685, http://www.pennstatelawreview.org/print-issues/the-racial-and-ethnic-composition-of-prekindergarten-classrooms-and-childrens-language-development/.
- Carlota Schechter and Beth Bye, “Preliminary Evidence for the Impact of Mixed-Income Preschool on Low-income Children’s Language Growth,” Early Childhood Research Quarterly 22 (2007): 137–46, http://eric.ed.gov/?id=EJ752960.
- Jeanne L. Reid and Sharon Lynn Kagan, A Better Start: Why Classroom Diversity Matters in Early Education (Washington, D.C., and New York: The Century Foundation and the Poverty & Race Research Action Council, April 2015), https://tcf.org/content/report/a-better-start/, 11.
- Jeanne L. Reid, “Socioeconomic Diversity and Early Learning: The Missing Link in Policy for High-Quality Preschools” in The Future of School Integration, ed. Richard D. Kahlenberg (New York: The Century Foundation, 2012), 67–126, https://tcf.org/content/book/the-future-of-school-integration/.
- Reid and Kagan, A Better Start, https://tcf.org/content/report/a-better-start/, 11.
- Ibid., 12.
- Adam Rutland, Lindsey Cameron, Laura Bennett, and Jennifer Ferrell, “Interracial Contact and Racial Constancy: A Multi-site Study of Racial Intergroup Bias in 3-5 Year Old Anglo-British Children,” Applied Developmental Psychology 26 (2005): 699–713, https://kar.kent.ac.uk/26168/4/rutland%20et%20al%20JADP.pdf.
- Jeanne L. Reid, “The Racial and Ethnic Composition of Pre-Kindergarten Classrooms and Children’s Language Development,” Penn State Law Review 119, no. 3 (2015): 668-669, http://www.pennstatelawreview.org/print-issues/the-racial-and-ethnic-composition-of-prekindergarten-classrooms-and-childrens-language-development/. The study defines socioeconomically diverse classrooms as those with a standard deviation of family incomes that is at least 0.5 times the mean standard deviation for all classrooms. Racially diverse classrooms are defined as those with 21–70 percent minority children.
- Reid and Kagan, A Better Start, https://tcf.org/content/report/a-better-start/.
- “Deputy Mayor Talks Universal Pre-K, Year Two”, New York One, March 17, 2015, http://www.ny1.com/nyc/all-boroughs/inside-city-hall/2015/03/17/deputy-mayor-talks-universal-pre-k–year-two.html.
- Dana Goldstein, “Bill de Blasio’s Pre-K Crusade,” The Atlantic, September 7, 2016, http://www.theatlantic.com/education/archive/2016/09/bill-de-blasios-prek-crusade/498830/.
- 2016 New York City Pre-Kindergarten Directory: Brooklyn, New York City Department of Education, January 2016, http://schools.nyc.gov/NR/rdonlyres/F5FF9418-4BA1-4FE0-A6E2-3678B66D02D4/0/2016NYCPreKDirectoryBrooklynENGLISH.pdf, 10.
- Ibid., 11.
- “A Portrait of Segregation in New York City’s Schools,” The New York Times, May 11, 2012, http://www.nytimes.com/interactive/2012/05/11/nyregion/segregation-in-new-york-city-public-schools.html.
- John Kucsera with Gary Orfield, “New York State’s Extreme School Segregation: Inequality, Inaction and a Damaged Future,” Civil Rights Project at UCLA, March 2014, https://civilrightsproject.ucla.edu/research/k-12-education/integration-and-diversity/ny-norflet-report-placeholder/Kucsera-New-York-Extreme-Segregation-2014.pdf, vi.
- The one exception is the map of pre-K program locations and demographics presented in the section, “The Role of Housing Segregation,” which shows site-level diversity in order to create a less cluttered map with fewer subgroups of five students or fewer, for which data must be suppressed.
- Allison Roda and Halley Potter, “It’s Time to Stop Putting Kids in Separate Gifted Education Programs,” Quartz, April 26, 2016, http://qz.com/666405/its-time-to-stop-putting-kids-in-separate-gifted-education-programs/.
- Clara Hemphill and Halley Potter, “Let Rich and Poor Learn Together,” The New York Times, June 12, 2015, http://www.nytimes.com/2015/06/12/opinion/let-rich-and-poor-learn-together.html?_r=0.
- “Universal Pre K. and Experimental Kindergarten Programs, Current through March 31, 2010,” New York State Education Department, Laws and Regulations, http://www.p12.nysed.gov/sss/lawsregs/1511-1-2-3.html; and “What Are the Class Size Limits for My Grade?” United Federation of Teachers, n.d., http://www.uft.org/faqs/what-are-class-size-limits-my-grade.
- In the 2014–2015 data, there were 4,616 unique kindergarten classrooms and 3,307 unique pre-K classrooms. This analysis excluded 1,067 kindergarten classrooms and 274 pre-K classrooms with fewer than 10 students, many of which were part of District 75, the NYCDOE’s department serving students with disabilities. It also excluded 60 kindergarten and 12 pre-K classrooms with more than 30 students. The remaining groups of 3,489 kindergarten classrooms and 3,021 pre-K classrooms are the basis for the classroom-level analysis in this report.
- Madeleine F. Green, Minorities on Campus: A Handbook for Enhancing Diversity (Washington, DC: American Council on Education, 1989); Kevin G. Welner, “K–12 Race-conscious Student Assignment Policies: Law, Social Science, and Diversity,” Review of Educational Research 76, no. 3 (2006): 349–82, http://www.colorado.edu/education/sites/default/files/attached-files/Welner_K-12%20Race-Conscious%20Student%20Assignment%20Policies.pdf; J. S. Ma and M. Kurlaender, “The Future of Race-conscious Policies in K–12 Public Schools: Support from Recent Legal Opinions and Social Science Research,” in School Resegregation: Must the South Turn Back? ed. J. Boger and G. Orfield (Chapel Hill: University of North Carolina Press, 2005), 239–60; and J. McConahay, “Reducing Racial Prejudice in Desegregated Schools,” in Effective School Desegregation: Equity, Quality, and Feasibility, ed. W. Hawley (Beverly Hills, CA: Sage, 1981), 35–53.
- See, e.g., Rebecca Klein, “The South Isn’t the Reason Schools Are Still Segregated, New York Is,” Huffington Post, April 1, 2016, http://www.huffingtonpost.com/entry/new-york-school-desegregation_us_56fc7cebe4b0a06d5804bdf0.
- See, e.g., Annie Ma, “Getting Black and Hispanic Students into Specialized Schools Remains a Challenge, Even for Programs Designed to Help,” Chalkbeat New York, June 9, 2016, http://www.chalkbeat.org/posts/ny/2016/06/09/getting-black-and-hispanic-students-into-specialized-schools-remains-a-challenge-even-for-programs-designed-to-help/.
- See Halley Potter, Lessons from New York City’s Universal Pre-K Expansion: How a Focus on Diversity Cold Make It Even Better, The Century Foundation, May 13, 2015, https://tcf.org/content/report/lessons-from-new-york-citys-universal-prek-expansion/, 8–9.
- CEC 13 Greeting,” CEC13 Brooklyn, n.d. https://cec13.org/about/.
- Nikole Hannah-Jones, “Choosing a School for My Daughter in a Segregated City,” The New York Times Magazine, June 9, 2016, http://www.nytimes.com/2016/06/12/magazine/choosing-a-school-for-my-daughter-in-a-segregated-city.html?_r=0; and Samuel Lieberman, “Dumbo Schools Rezoned in Spite of Parents’ Big Feelings,” New York Magazine, January 6, 2016, http://nymag.com/daily/intelligencer/2016/01/dumbo-schools-rezoned-over-parent-protests.html.
- Patrick Wall, “Lower East Side Families Get First Look at a Sweeping Plan to Integrate Schools,” Chalkbeat New York, March 30, 2016, http://www.chalkbeat.org/posts/ny/2016/03/30/lower-east-side-families-get-first-look-at-a-district-wide-school-integration-plan/#.V5tkPmgrKUk.
- “What are CECs?” District 20, n.d., http://www.cec20.org/what-are-cecs-.html; and “District 20,” InsideSchools, The Center for New York City Affairs, The New School, n.d. http://insideschools.org/districts/brooklyn/district-20.
- Brian Charles, “As Enrollment Climbs City Struggles to Keep Ovecrowding from Growing, Too,” Chalkbeat New York, March 3, 2015, http://www.chalkbeat.org/posts/ny/2015/03/03/as-enrollment-climbs-city-struggles-to-keep-overcrowding-from-growing-too/#.V6QM_bgrLIU.
- “#AskTheMayor: Bronx Edition,” The Brian Lehrer Show, June 16, 2016, http://www.wnyc.org/story/askthemayor-june-16/; and “Transcript: Mayor de Blasio Appears Live on WNYC’s Brian Lehrer Show,” New York City Office of the Mayor, June 16, 2016, http://www1.nyc.gov/office-of-the-mayor/news/543-16/transcript-mayor-de-blasio-appears-live-wnyc-s-brian-lehrer-show.
- “Local Law 59 School Diversity Accountability Act,” New York City Department of Education, December 2015, http://schools.nyc.gov/community/city/publicaffairs/KeyDocuments/default.htm; and Sabrina Rodriguez, “De Blasio Signs Law Requiring New School Diversity Reports,” Chalkbeat New York, June 17, 2015, http://www.chalkbeat.org/posts/ny/2015/06/17/de-blasio-signs-law-requiring-new-school-diversity-reports/#.V55LHLgrK00.
- “Chancellor Fariña Announces Earliest-Ever Pre-K for All Offers,” Press Release, New York City Department of Education, May 2, 2016, http://schools.nyc.gov/Offices/mediarelations/NewsandSpeeches/2015-2016/Chancellor+Announces+Earliest+Ever+PreK+for+All+Offers.htm.
- See discussion of “Parent Information Centers” in Charles V. Willie, Ralph Edwards, and Michael J. Alves, Student Diversity, Choice, and School Improvement (Westport, CT: Bergin & Garvey, 2002), chapter 5, 61–76. For discussion of the ways in which high school choice in New York City has failed to promote equity or integration, see Carolyn Sattin-Bajaj, Unaccompanied Minors: Immigrant Youth, School Choice, and the Pursuit of Equity (Cambridge, MA: Harvard Education Press, 2014).
- See NYC Pre-K Finder, https://maps.nyc.gov/upk/.
- Mary E. Bratsch-Hines, Irina Mokrova, and Lynne Vernon-Feagans, “Child Care Instability from 6 to 36 Months and the Social Adjustment of Children in Prekindergarten,” Early Childhood Research Quarterly 30 (2015): 106–16.[\note] Many community-based sites establish relationships with children and their families before age 4 by providing child care or other social services, so it often makes sense for children to stay in those centers. Moreover, the initial results for program quality assessments across the city’s universal pre-K sites found that the programs with highest quality programs were most likely to be community-based sites.43Susan Edelman, “City Pre-K Programs Lag Behind Nonprofits in Quality: Analysis,” New York Post, January 10, 2016, http://nypost.com/2016/01/10/city-pre-k-programs-lag-behind-nonprofits-in-quality-analysis/.
- Susan Edelman, “City Pre-K Programs Lag Behind Nonprofits in Quality: Analysis,” New York Post, January 10, 2016, http://nypost.com/2016/01/10/city-pre-k-programs-lag-behind-nonprofits-in-quality-analysis/.
- Mary Cheng, telephone interview with author, April 16, 2015.
- “Chancellor Farina Announces new Admissions Pilot at Seven Elementary Schools Designed to Promote Diversity,” New York City Department of Education, November 20, 2015, http://schools.nyc.gov/Offices/mediarelations/NewsandSpeeches/2015-2016/Chancellor+Farina+Announces+New+Admissions+Pilot+at+Seven+Elementary+Schools+Designed+to+Promote+Div.htm.
- For a discussion of how to structure dual language programs so that they promote integration while serving ELL students, see Segregation in NYC District Elementary Schools and What We Can Do about It: Addressing Internal Segregation and Harnessing the Educational Benefits of Diversity, New York Appleseed, February 2014, https://www.appleseednetwork.org/wp-content/uploads/2014/02/Within-Our-Reach-2nd-Brief-February-2014-FINAL.pdf.
- Halley Potter, Lessons from New York City’s Universal Pre-K Expansion: How a Focus on Diversity Cold Make It Even Better, The Century Foundation, May 13, 2015, 21, https://tcf.org/content/report/lessons-from-new-york-citys-universal-prek-expansion/.
- Kendra Hurley and Abigail Kramer, Big Dreams for New York City’s Youngest Children: The Future of Early Care and Education, Center for New York City Affairs, The New School, summer 2014, 28–29 https://static1.squarespace.com/static/53ee4f0be4b015b9c3690d84/t/54ad8d51e4b0de5681a441d9/1420660049609/BigDreamsforNYsYoungestChildren_FINAL_001.pdf.
- Amy Zimmer, “7 Elementary Schools Will Try to Boost Student Diversity in Pilot Program,” DNAinfo, November 20, 2015, https://www.dnainfo.com/new-york/20151120/fort-greene/7-brooklyn-manhattan-schools-win-fight-for-diversity-based-admissions; and Ben Chapman, “NYC to Push for Classroom Diversity throughout City Schools with New Program,” New York Daily News, May 30, 2016, http://www.nydailynews.com/new-york/nyc-push-classroom-diversity-city-schools-article-1.2655085; and Monica Disare, “New York City, and Its Teachers Union, Now Encouraging Schools to Bend Its Rules to Reduce Segregation,” Chalkbeat New York, May 26, 2016, http://www.chalkbeat.org/posts/ny/2016/05/26/new-york-city-and-its-teachers-union-now-encouraging-schools-to-bend-its-rules-to-reduce-segregation/#.V5qQFWgrKUk.
- WNYC Data News Team, “‘Controlled Choice’ for Integrating Schools: What It’s All About,” WNYC SchoolBook, June 6, 2016, http://www.wnyc.org/story/controlled-choice-public-schools-explainer/.
- Patrick Wall, “Advocates Seize Chance to Push for Upper West Side Desegregation, but Face Stiff Resistance,” Chalkbeat New York, July 21, 2016, http://www.chalkbeat.org/posts/ny/2016/07/21/advocates-seize-chance-to-push-for-upper-west-side-desegregation-but-face-stiff-resistance/#.V55OxrgrK00.
- Jennifer Burns Stillman, Tipping In: School Integration in Gentrifying Neighborhoods, Ph.D. Dissertation, Columbia University, 2011, 78–79, http://academiccommons.columbia.edu/catalog/ac%3A132299.
- Meredith Kolodner, “New Steps to (Maybe) Ease Crowding,” InsideSchools, January 3, 2012, http://insideschools.org/blog/item/1000201-new-steps-to-maybe-ease-crowding; and New York City Department of Education Regulation of the Chancellor, January 21, 2016, no. A-101, 8, http://schools.nyc.gov/NR/rdonlyres/1CC25F63-74E8-41A6-8031-490F206F148D/0/A101.pdf.
- For more national policy recommendations, see Jeanne L. Reid and Sharon Lynn Kagan, A Better Start: Why Classroom Diversity Matters in Early Education (Washington, D.C., and New York: The Century Foundation and the Poverty & Race Research Action Council, April 2015), 19–22, https://tcf.org/content/report/a-better-start/.
- W. S. Barnett, et al., The State of Preschool 2015: State Preschool Yearbook (New Brunswick, NJ: National Institute for Early Education Research, 2016), http://nieer.org/research/state-preschool-2015.