Dramatic changes to the health care system, including Affordable Care Act (ACA) coverage, are on the horizon due to rule changes, the budget reconciliation law, and Congressional inaction to date on extending health insurance premium tax credits. As a result, many Americans will see their premium costs skyrocket and many more could become disenrolled from their current plans. This commentary updates an earlier June 27, 2025 version to reflect the passage of Public Law 119-21 and include state fact sheets for the thirty-two states that used HealthCare.gov in 2024.
Snapshot of Projected Increases for Vulnerable ACA Enrollees Under GOP Cuts
- The average annual out-of-pocket premium increase will be 25 percent higher for rural enrollees than urban ones, with increases averaging $760 per year and climbing upwards of $3,000 or more in the nation’s hardest hit rural counties.
- The 12.8 million enrollees in HealthCare.gov plans who live in counties with high rates of diabetes would pay on average $559 more for coverage, and an estimated 2.8 million residents in those counties who previously were auto-reenrolled are at risk of losing coverage entirely—which could be life-threatening for people with diabetes.
- Around 8.9 million HealthCare.gov enrollees living in areas with lower than average access to primary care doctors—including 2.1 million older adults and 928,000 children—will pay an average of $619 more for their health plans, despite facing barriers to even accessing basic primary health care.
The ACA’s health insurance marketplaces offer people without access to Medicaid or affordable employer coverage quality, affordable private plans. The federal government provides premium tax credits to lower out-of-pocket premiums and runs these marketplaces in thirty-one states through HealthCare.gov. (State-based marketplaces operate in the remainder.)
Yet, after reaching record-high enrollment in January 2025, marketplace enrollment is projected to plunge in 2026 and thereafter due to higher out-of-pocket premiums and policies making it harder for people to get and stay covered. The nonpartisan Congressional Budget Office estimates that GOP plans for the marketplace would reduce federal funding and increase the number of uninsured Americans by millions—which doesn’t even count the additional Americans who could face coverage loss due to proposed Medicaid changes.
Much of the forthcoming premium cost increases would result from sharp reductions in tax credits that Congress has yet proposed to extend that will raise out-of-pocket costs in January. Additionally, both a final rule from the Trump administration and policies in the Republican Congress’s budget reconciliation law would make it harder for people currently enrolled to stay covered. For example, the law ends the practice used in all other private insurance of re-enrolling people automatically if they like their plan and their circumstances haven’t changed. Enrollees will have to sign up and verify eligibility again to stay covered.
This is not inevitable: Congress could reject proposals that cause people to lose health insurance marketplace coverage and extend the current level of premium tax credits. It is a choice.
About the Project
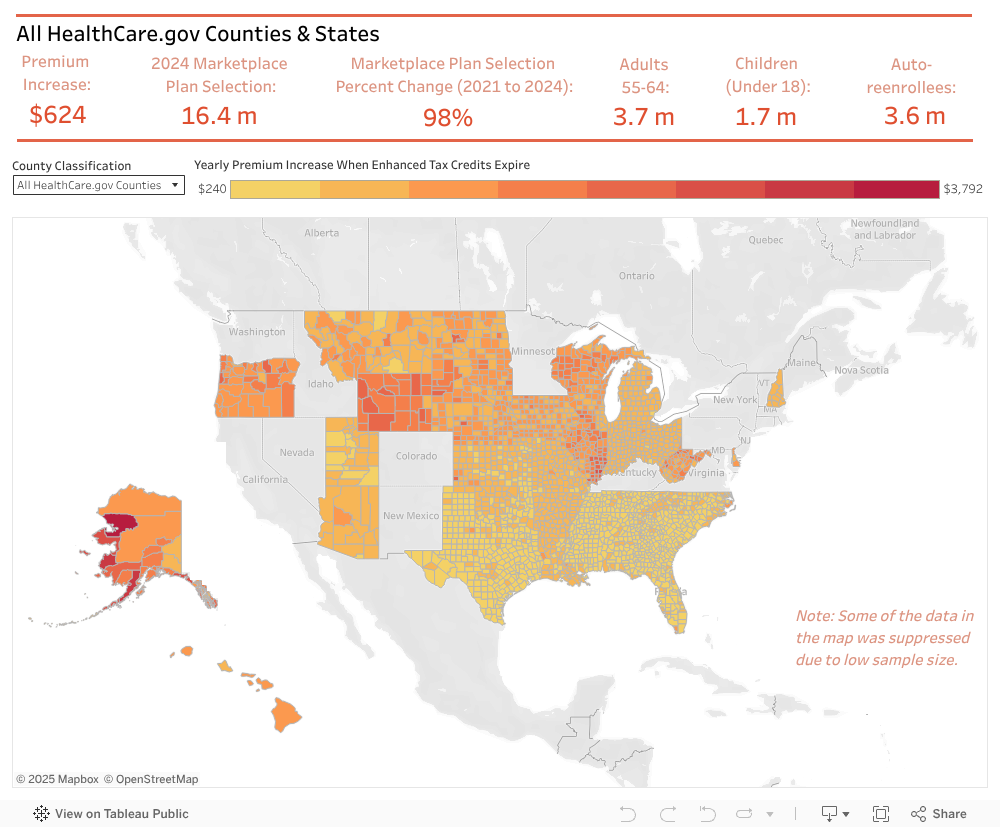
This data dashboard shows how changes to the ACA marketplaces will affect Americans at the county and state levels in HealthCare.gov states.1 These states had 16.4 million of the 21 million marketplace enrollees nationwide in 2024. It focuses on counties facing extra challenges, including rural counties as well as those that have a higher than average percent of residents who have diabetes, are uninsured, and have less access to primary care. Information is available at the county and state level, with options to drill down to see the average annual out-of-pocket premium increase for health plans; the overall number of people, including older people and children, affected by the changes; the percent increase in enrollment between 2021 and 2024; and how many people were auto-reenrolled in 2024 who will be affected by the new law making it harder to keep coverage. Details are described in the methodology section.
State Fact Sheets on Health Insurance Premium Tax Increases (July 25, 2025)
These states used HealthCare.gov in 2024; comparable data is not available for the eighteen states and the District of Columbia that ran their own health insurance marketplaces.
Alabama
Alaska
Arizona
Arkansas
Delaware
Florida
Georgia
Hawaii
Illinois
Indiana
Iowa
Kansas
Louisiana
Michigan
Mississippi
Missouri
Montana
North Carolina
North Dakota
Nebraska
New Hampshire
Ohio
Oklahoma
Oregon
South Carolina
South Dakota
Tennessee
Texas
Utah
West Virginia
Wisconsin
Wyoming
Key Findings
- All HealthCare.gov states: In the thirty-two states that used the federally run HealthCare.gov in 2024, enrollment has nearly doubled since 2021 to 16.4 million people, including 3.7 million adults ages 55 to 64 and 1.7 million children. Enrollees receiving premium tax credits today would pay on average $624 more per year for the same coverage if Congress does not extend improvements to premium tax credits. Additionally, 3.6 million enrollees who were automatically re-enrolled in coverage would have to re-sign up under the new budget law, causing some to lose coverage. States particularly hard hit by these plans include Alaska and Wyoming, whose average cost increases would exceed $1,800; Florida, which has the most enrollees (4.2 million); and West Virginia, which had the largest growth in enrollment (163 percent).
- Rural America: The average annual out-of-pocket premium for the 2.8 million residents of rural counties in HealthCare.gov states would increase by $760 without Congressional action, over 25 percent higher than the increase for urban residents. States with the largest average additional cost for health plans for rural enrollees include Wyoming ($1,943), Alaska ($1,835), and Illinois ($1,700). Texas, Georgia, and North Carolina have the highest number of rural HealthCare.gov enrollees who will face both higher prices and hurdles to remain covered. Rural enrollment growth since 2021 was highest in Georgia (222 percent), South Carolina (203 percent), Texas (190 percent), and Louisiana (173 percent).
- Areas with high rates of diabetes: About 12.8 million enrollees in HealthCare.gov plans live in counties with high rates of diabetes, a pre-existing condition that requires lifelong medical care to manage. Currently enrolled people, including 2.8 million older adults, would pay on average $559 more for coverage because of Congress’s failure to extend premium tax credits. Additionally, an estimated 2.8 million residents in such counties who previously were auto-reenrolled are at risk of falling through the cracks and losing coverage, which could be life-threatening for a person with diabetes. The states that would experience the highest increase in annual premiums for their residents who live in counties with higher than average diabetes rates include Alaska ($2,136), Oregon ($1,413), West Virginia ($1,404), and South Dakota ($1,243). Texas has the largest number of enrollees (664,279) who will have to file new paperwork to stay covered.
- Places where fewer people have health insurance: Health insurance marketplaces have provided affordable, quality health coverage in areas where employer and Medicaid coverage are limited. HealthCare.gov enrollment in counties with higher than average uninsured rates grew by 121 percent from 2021 to 2024, nearly twice the increase in counties with low uninsured rates (65 percent). Yet, in high uninsurance counties, 13.7 million HealthCare.gov enrollees, including families with 1.4 million children, would pay an average $564 more annually for their plans if Congress fails to extend enhanced premium tax credits. Nearly 3 million people will face challenges re-enrolling. The highest average increase in out-of-pocket costs for health plans for residents of high-uninsurance counties would be in Wyoming ($1,870) and Alaska ($1,840). In Florida, 455,078 children have coverage through HealthCare.gov in counties with high uninsured rates, putting them at risk of losing coverage.
- Communities where accessing primary care is difficult: Around 8.9 million HealthCare.gov enrollees live in areas with high ratios of residents to primary care doctors. This means that the population need is greater than the supply so that such residents struggle to get basic care—and may struggle more depending on the outcome of the Congressional debate. Without action, HealthCare.gov enrollees with limited primary care access would pay $619 more on average for their health plans, including 2.1 million older adults and families with 928,000 children. The highest average increase in out-of-pocket costs for health plans for residents of counties with relatively few primary care providers would be in Alaska ($1,864) and Wyoming ($1,856). Louisiana and North Carolina have both a high number of counties with limited primary care access and large out-of-pocket cost increases unless Congress acts.
Methods: Data for this dashboard came from three sources: the U.S. Centers for Medicare and Medicaid Services (CMS); the U.S. Health Resources and Services Administration (HRSA), Federal Office of Rural Health Policy; the University of Wisconsin Population Health Institute, County Health Rankings & Roadmaps 2025; and the National Institutes of Health, National Cancer Institute, Incident Rates Tables.
CMS was the source for all health insurance marketplace data. The increase in out-of-pocket premiums when the enhanced tax credits expire was based on data from Other Resources in a file called “ARP/IRA Savings for HC.gov OE 2024 Plan Selections made by Consumers who Elected to Receive APTC by county (XLSX).” The difference between the Advanced Premium Tax Credit (APTC) with and without the ARP/IRA changes was calculated through subtraction and multiplied by twelve to annualize. State and HealthCare.gov averages were calculated by weighting the county averages by county enrollees who received APTC. Data on overall marketplace enrollment, enrollment by age, and the number of enrollees who were auto-reenrolled were from 2024 Marketplace Open Enrollment Period Public Use Files in the file called “2024 OEP County-Level Public Use File (ZIP).” The 2024 overall enrollment data were compared to 2021 overall marketplace enrollment to calculate the percent change in enrollment; the 2021 overall enrollment was from 2021 Marketplace Open Enrollment Period Public Use Files in a file called “2021 OEP County-Level Public Use File (ZIP).” State and HealthCare.gov enrollment counts were cumulated from the county data.
The analysis categorized a county as “rural” when the HRSA data labeled it “Fully FORHP Rural Counties.” The County Health Rankings for 2025 were used for the dichotomous categorization of counties as high or low diabetes, high or low uninsured, and high or low primary care ratio. The years, definitions, and sources of these variables can be found here. The cancer rate incidence are county-level averages from 2017 to 2021. This analysis’s categorization of counties was done by calculating a national average from the county data for each of these variables and categorizing the county as “high” or “low” by comparing it to the variable’s national average. State and HealthCare.gov average annual out-of-pocket premium increases were calculated as weighted averages of the county enrollment in the categorization (see above). Enrollment counts at the state and HealthCare.gov levels were cumulated. Additional information is available upon request.
Acknowledgements: The authors would like to thank Keep Americans Covered for support for the state fact sheets and supplemental analyses. We also thank the Harvard University students in the Charles River Economics Lab, Stephanie Chen, Sophia Lichterfeld, Tinaye Nigorima, Chloe Sow, Michael Wang, and Iris Xue, who assisted with data analysis. The authors would especially like to thank Stephanie Chen, who acted as a project coordinator and assisted with data visualization as well.