There has been a great deal of political and media attention paid to the rate of economic growth under the Trump administration during 2017 and 2018. President Trump has often called the results under his administration unprecedented. His statements are unfounded: while wage growth has been strong, most other measures of economic growth under the current administration are less impressive than they were during the tail end of the previous administration, Barack Obama’s second term.
As Election Day nears, we’ve dug into the last four years, spanning the end and the beginning of two different sets of executive leadership, and now let the facts speak for themselves. By comparing the rate of growth of key economic variables in the last years of the Barack Obama administration to the record thus far in the Trump administration, we present a report card on results under the two presidents.
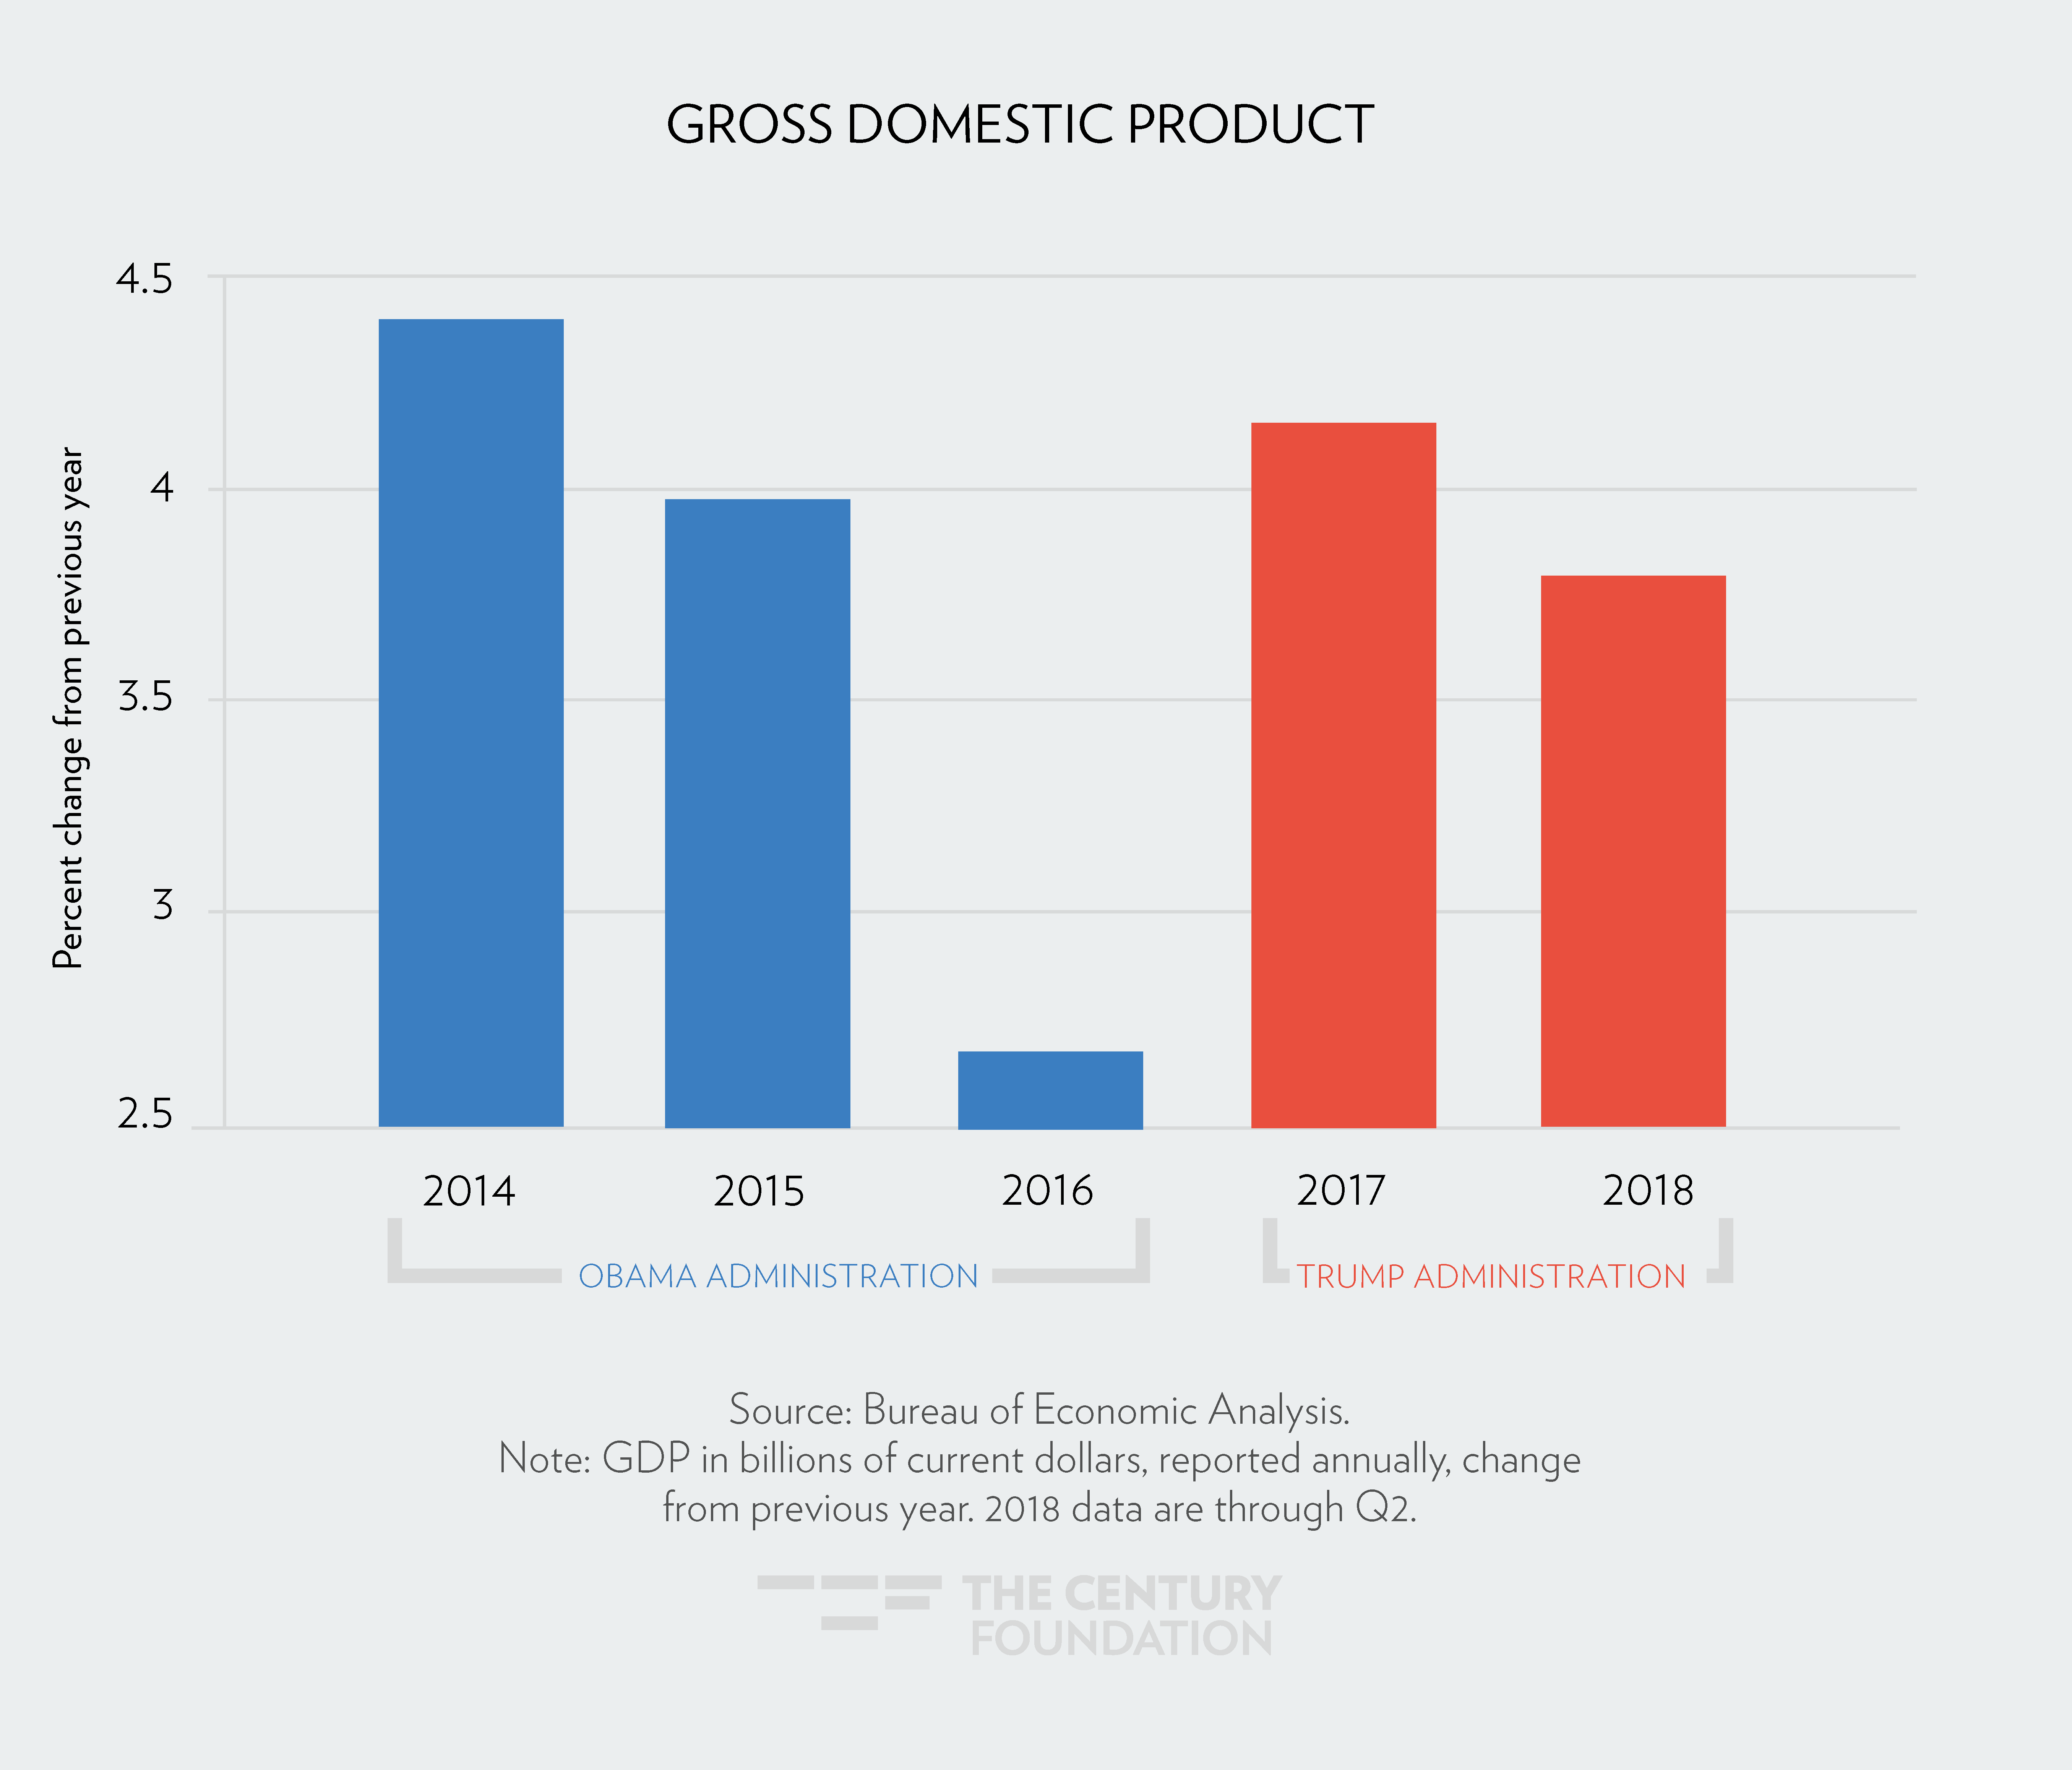
1. GDP Growth Was Higher on Average under Obama in 2014 and 2015 Than Compared to Trump in 2017 and 2018
Gross Domestic Product, or GDP, is a measure of total income in the economy. Figures shown represent the percent change from the previous year of the Bureau of Economic Analysis’ accounting of GDP.
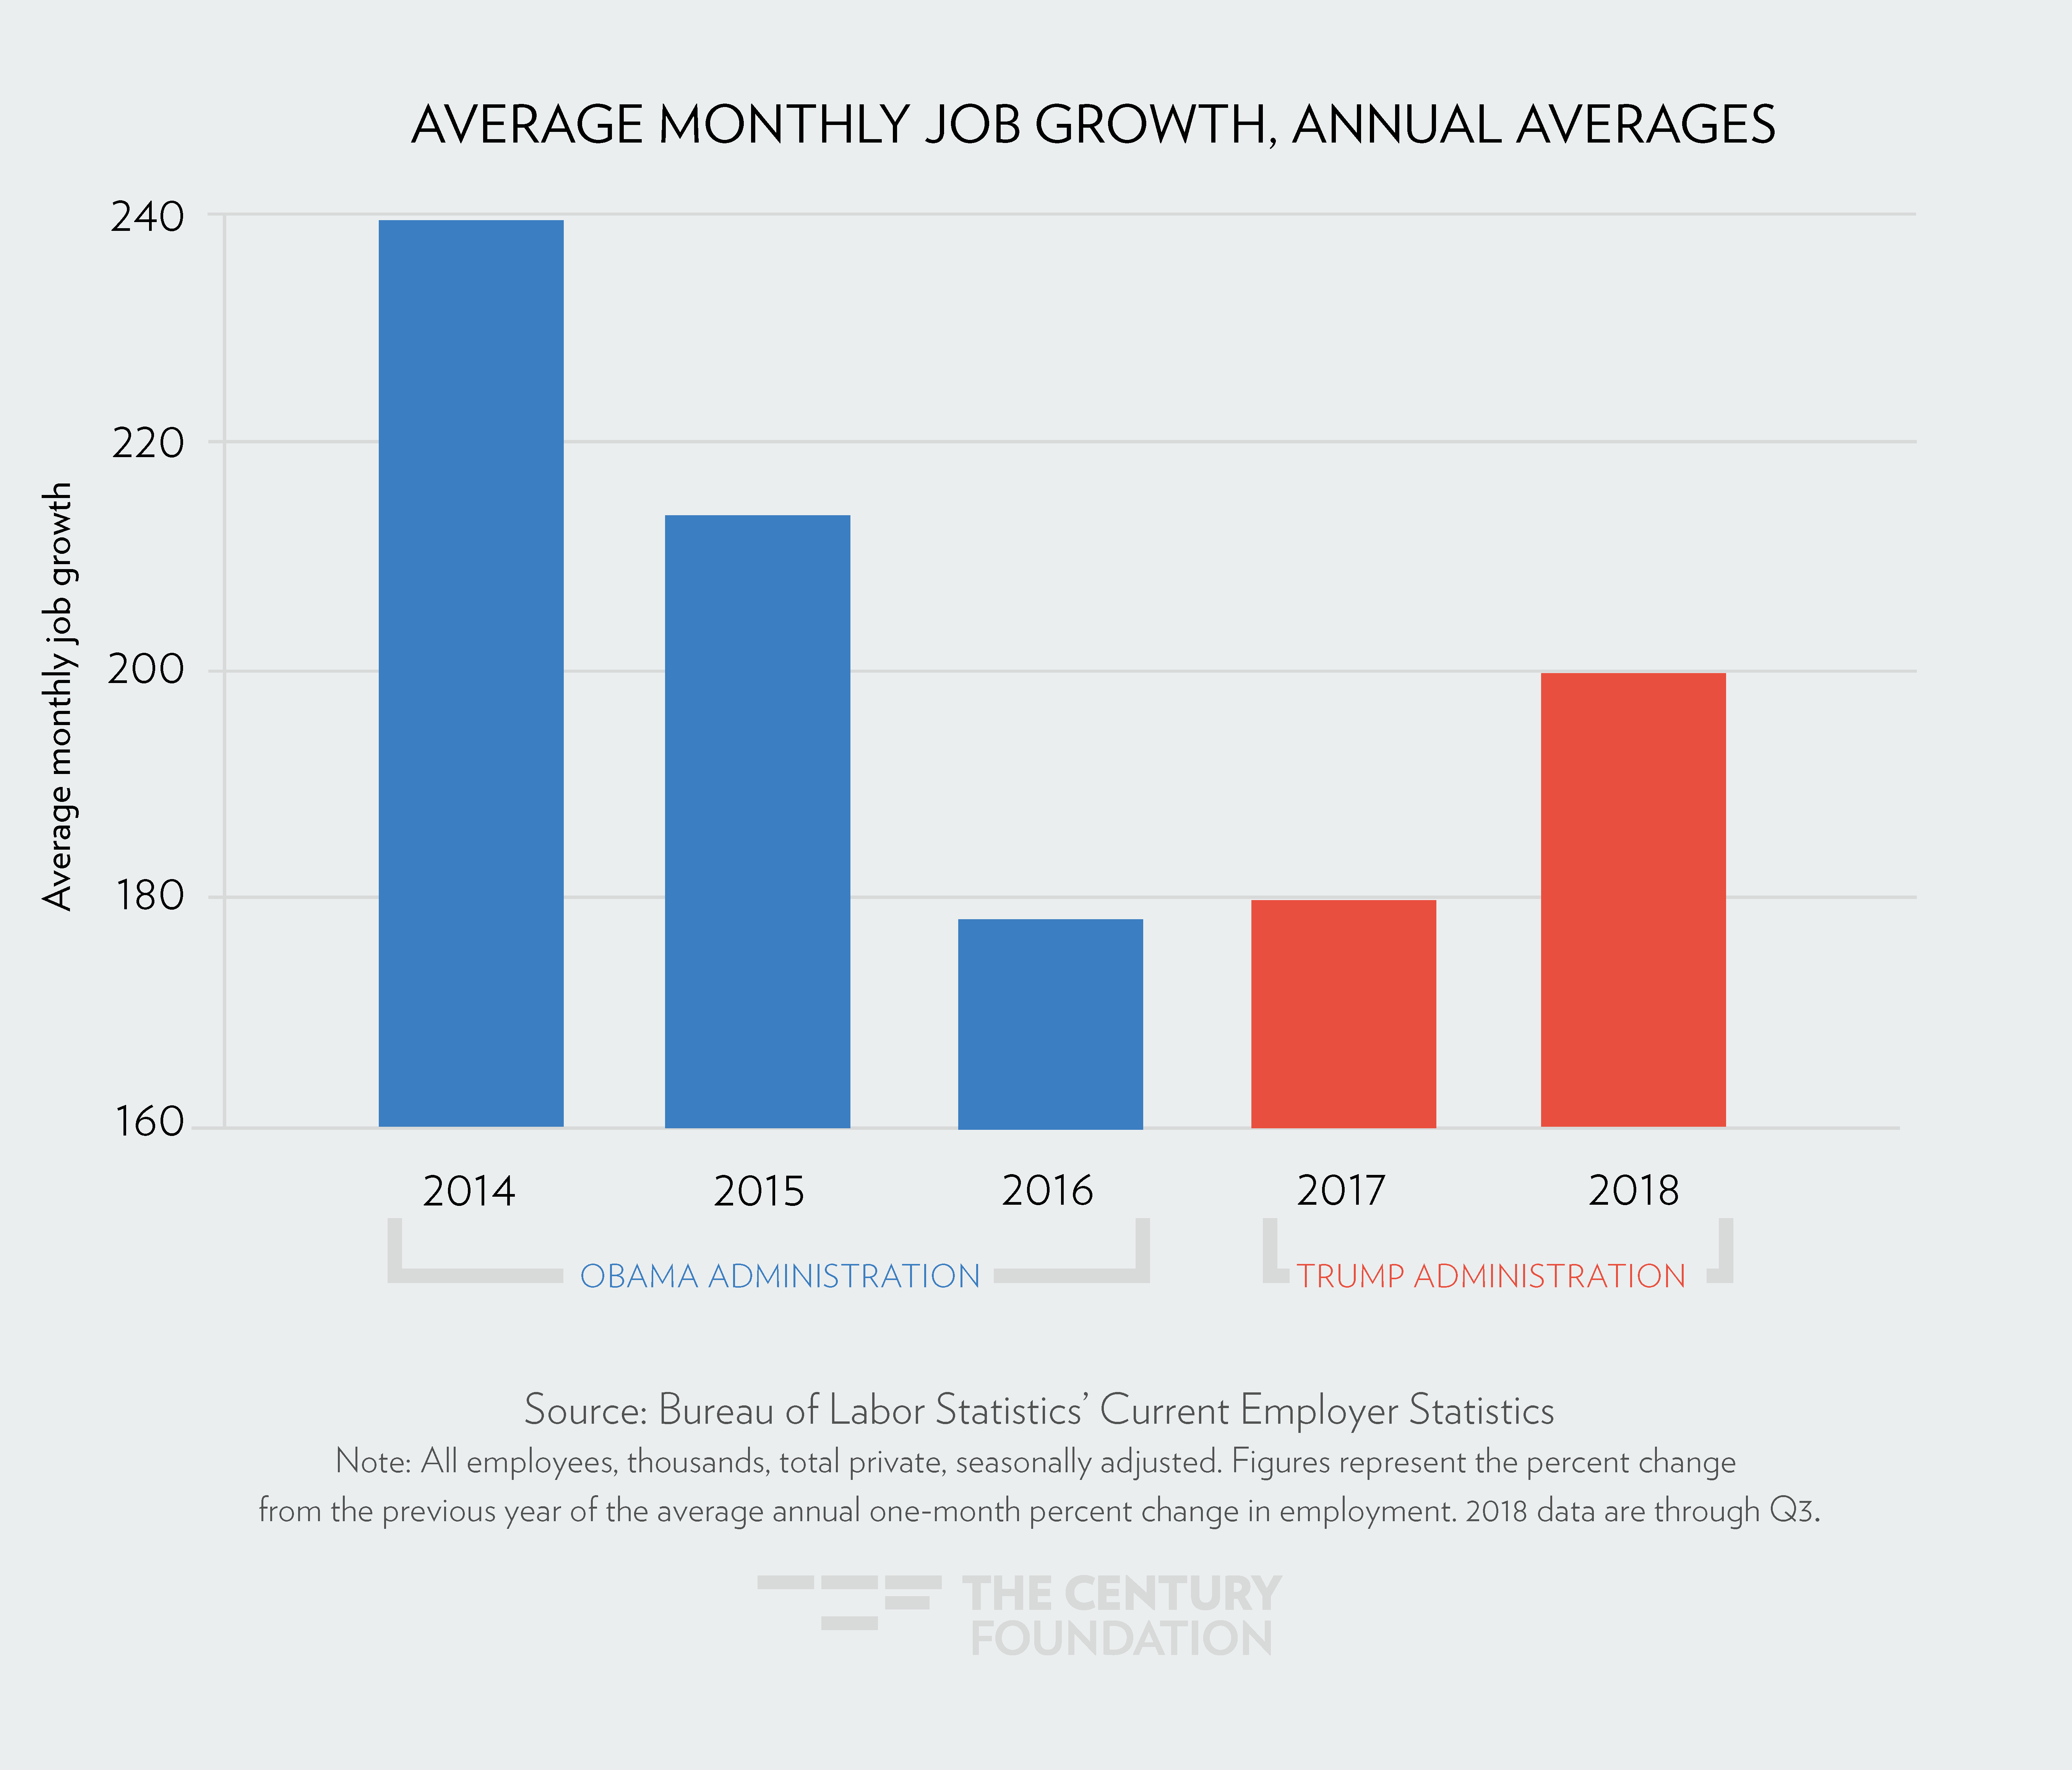
2. Monthly Job Growth Was Higher under Obama Than in Trump’s First Two Years
Using Bureau of Labor Statistics data on the number of jobs in the economy each month, this figure shows the average monthly job gains, by year.
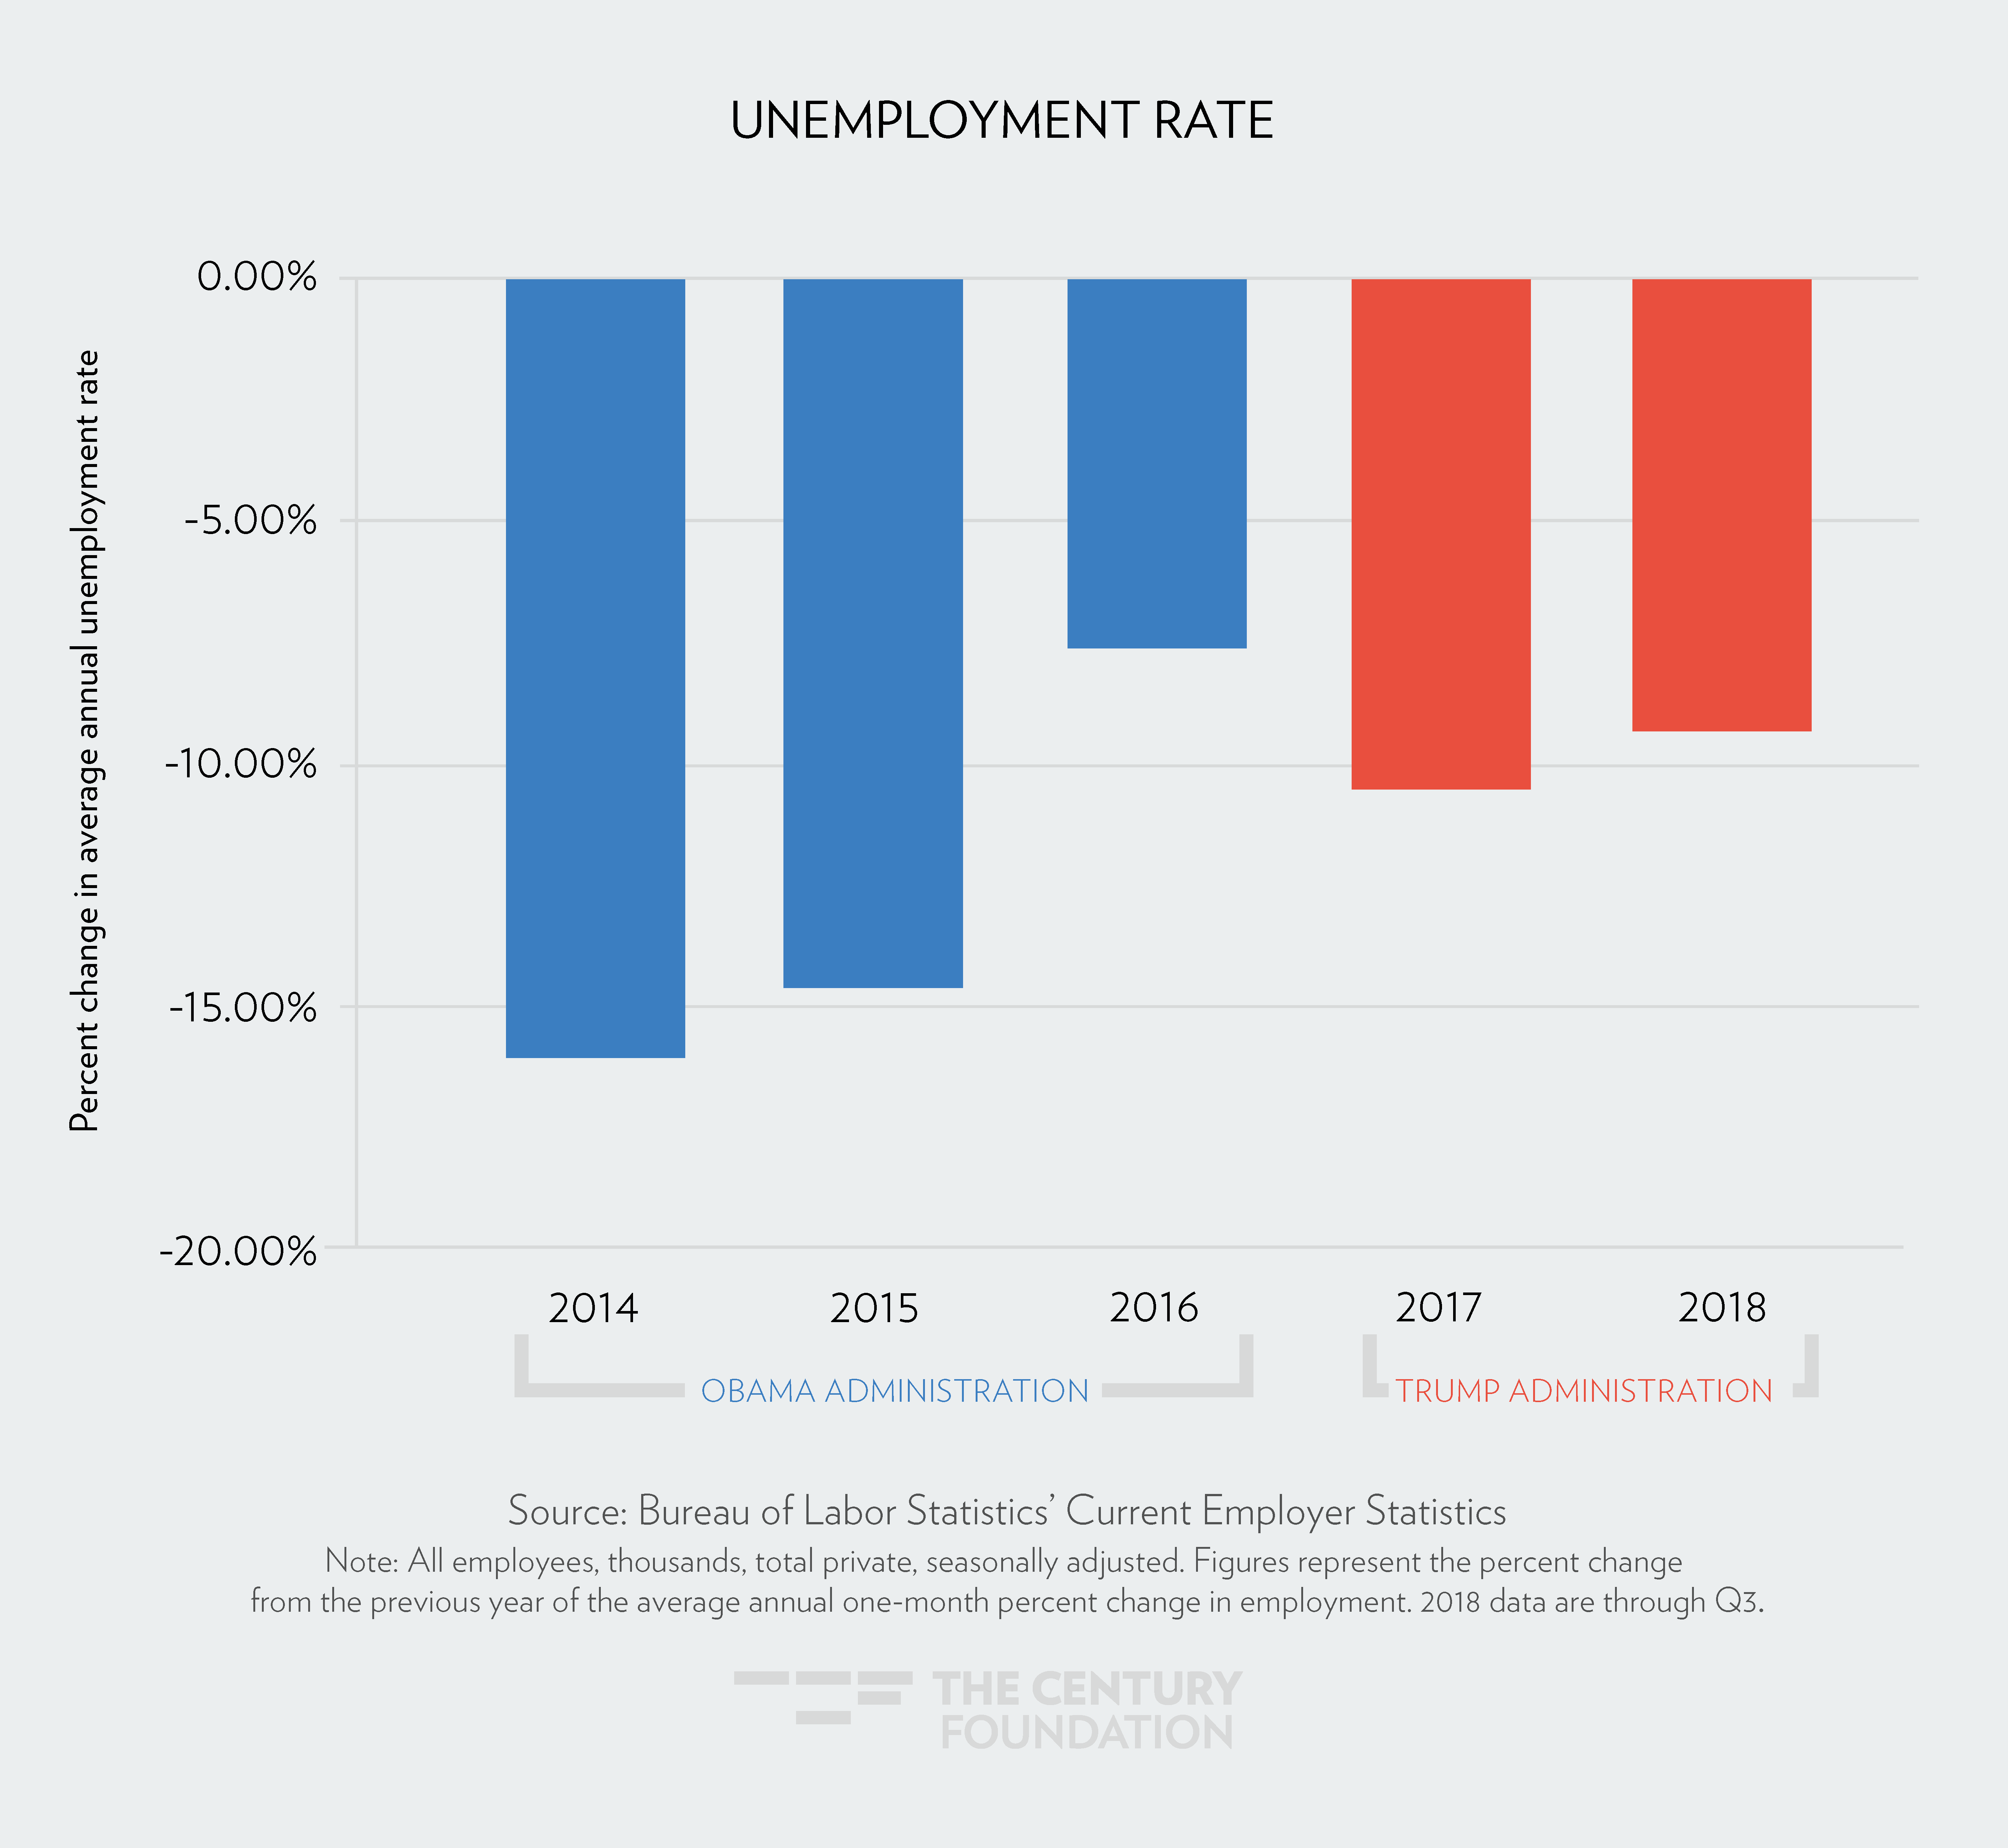
3. The Unemployment Rate Was Falling Faster under Obama in 2014 and 2015 than in Trump’s First Two Years
The official unemployment rate, also measured by the Bureau of Labor Statistics, has declined but at different rates in each year, as shown below.
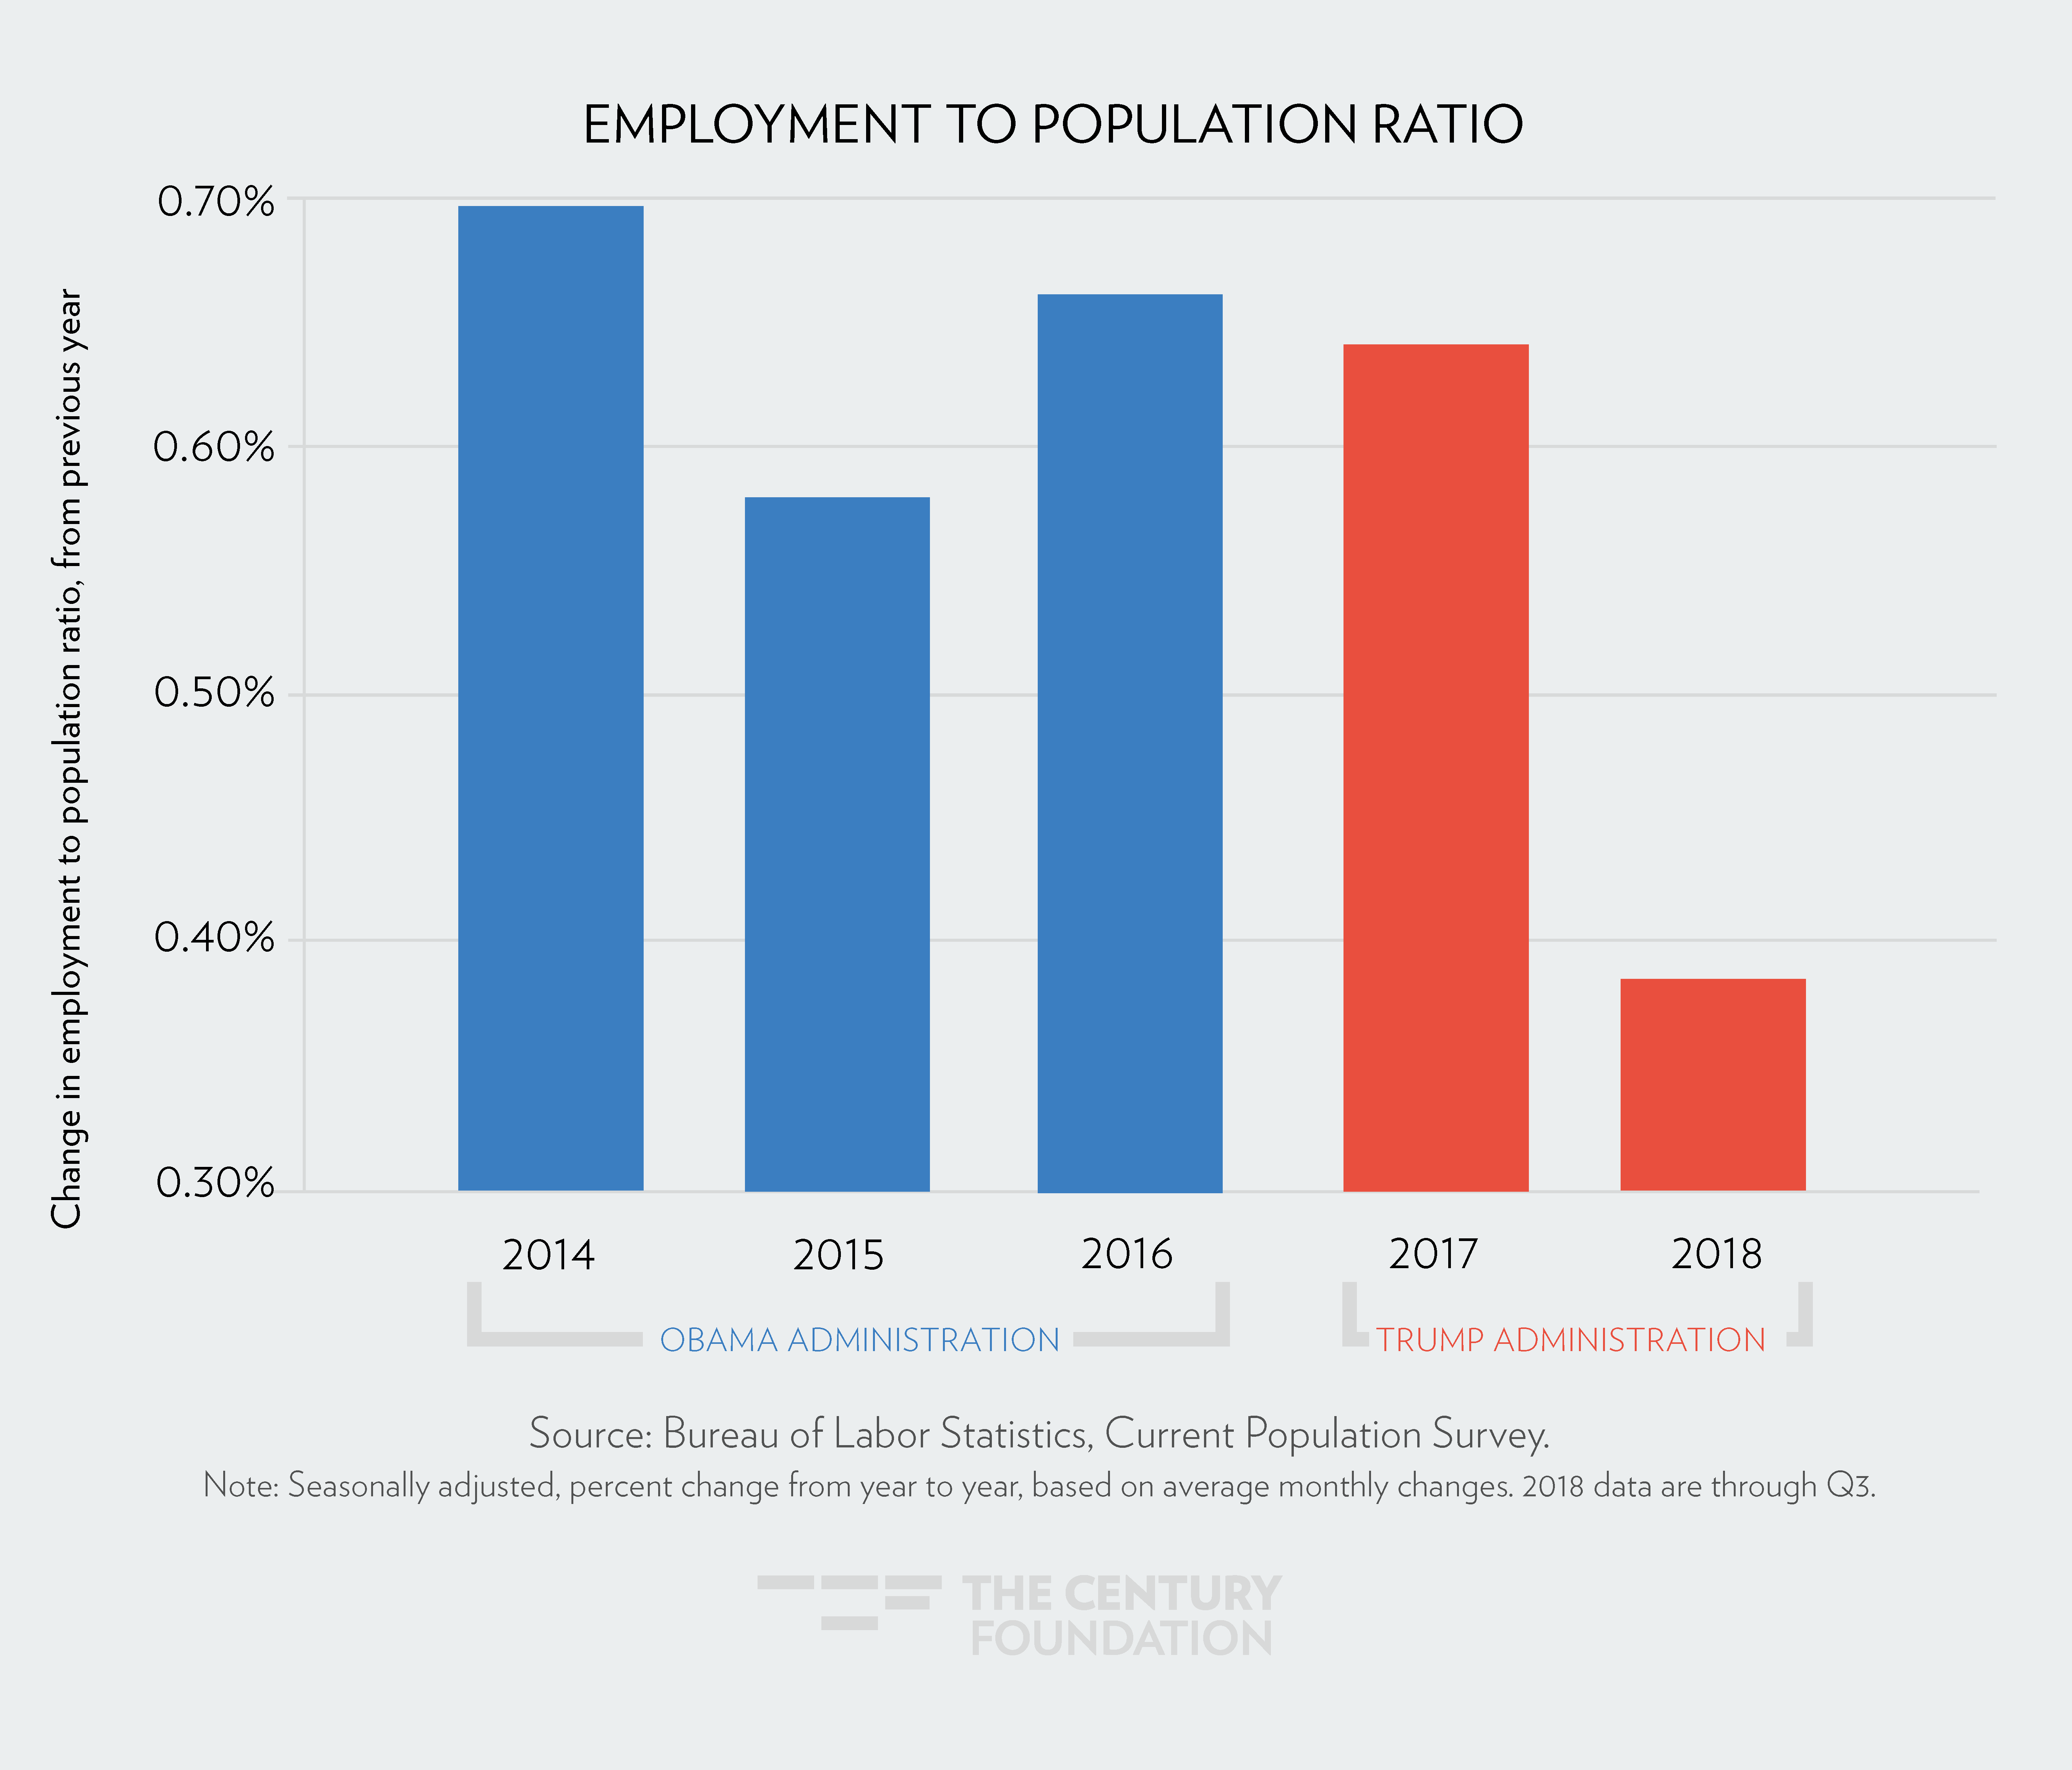
4. Growth in the Employment-to-Population Rate Has Slowed under Trump
The employment to population ratio (EPOP), currently at 60.4 percent, is the percent of prime-aged workers in the country that are working. The EPOP has been increasing slowly for all years presented below, but at different rates in each year.
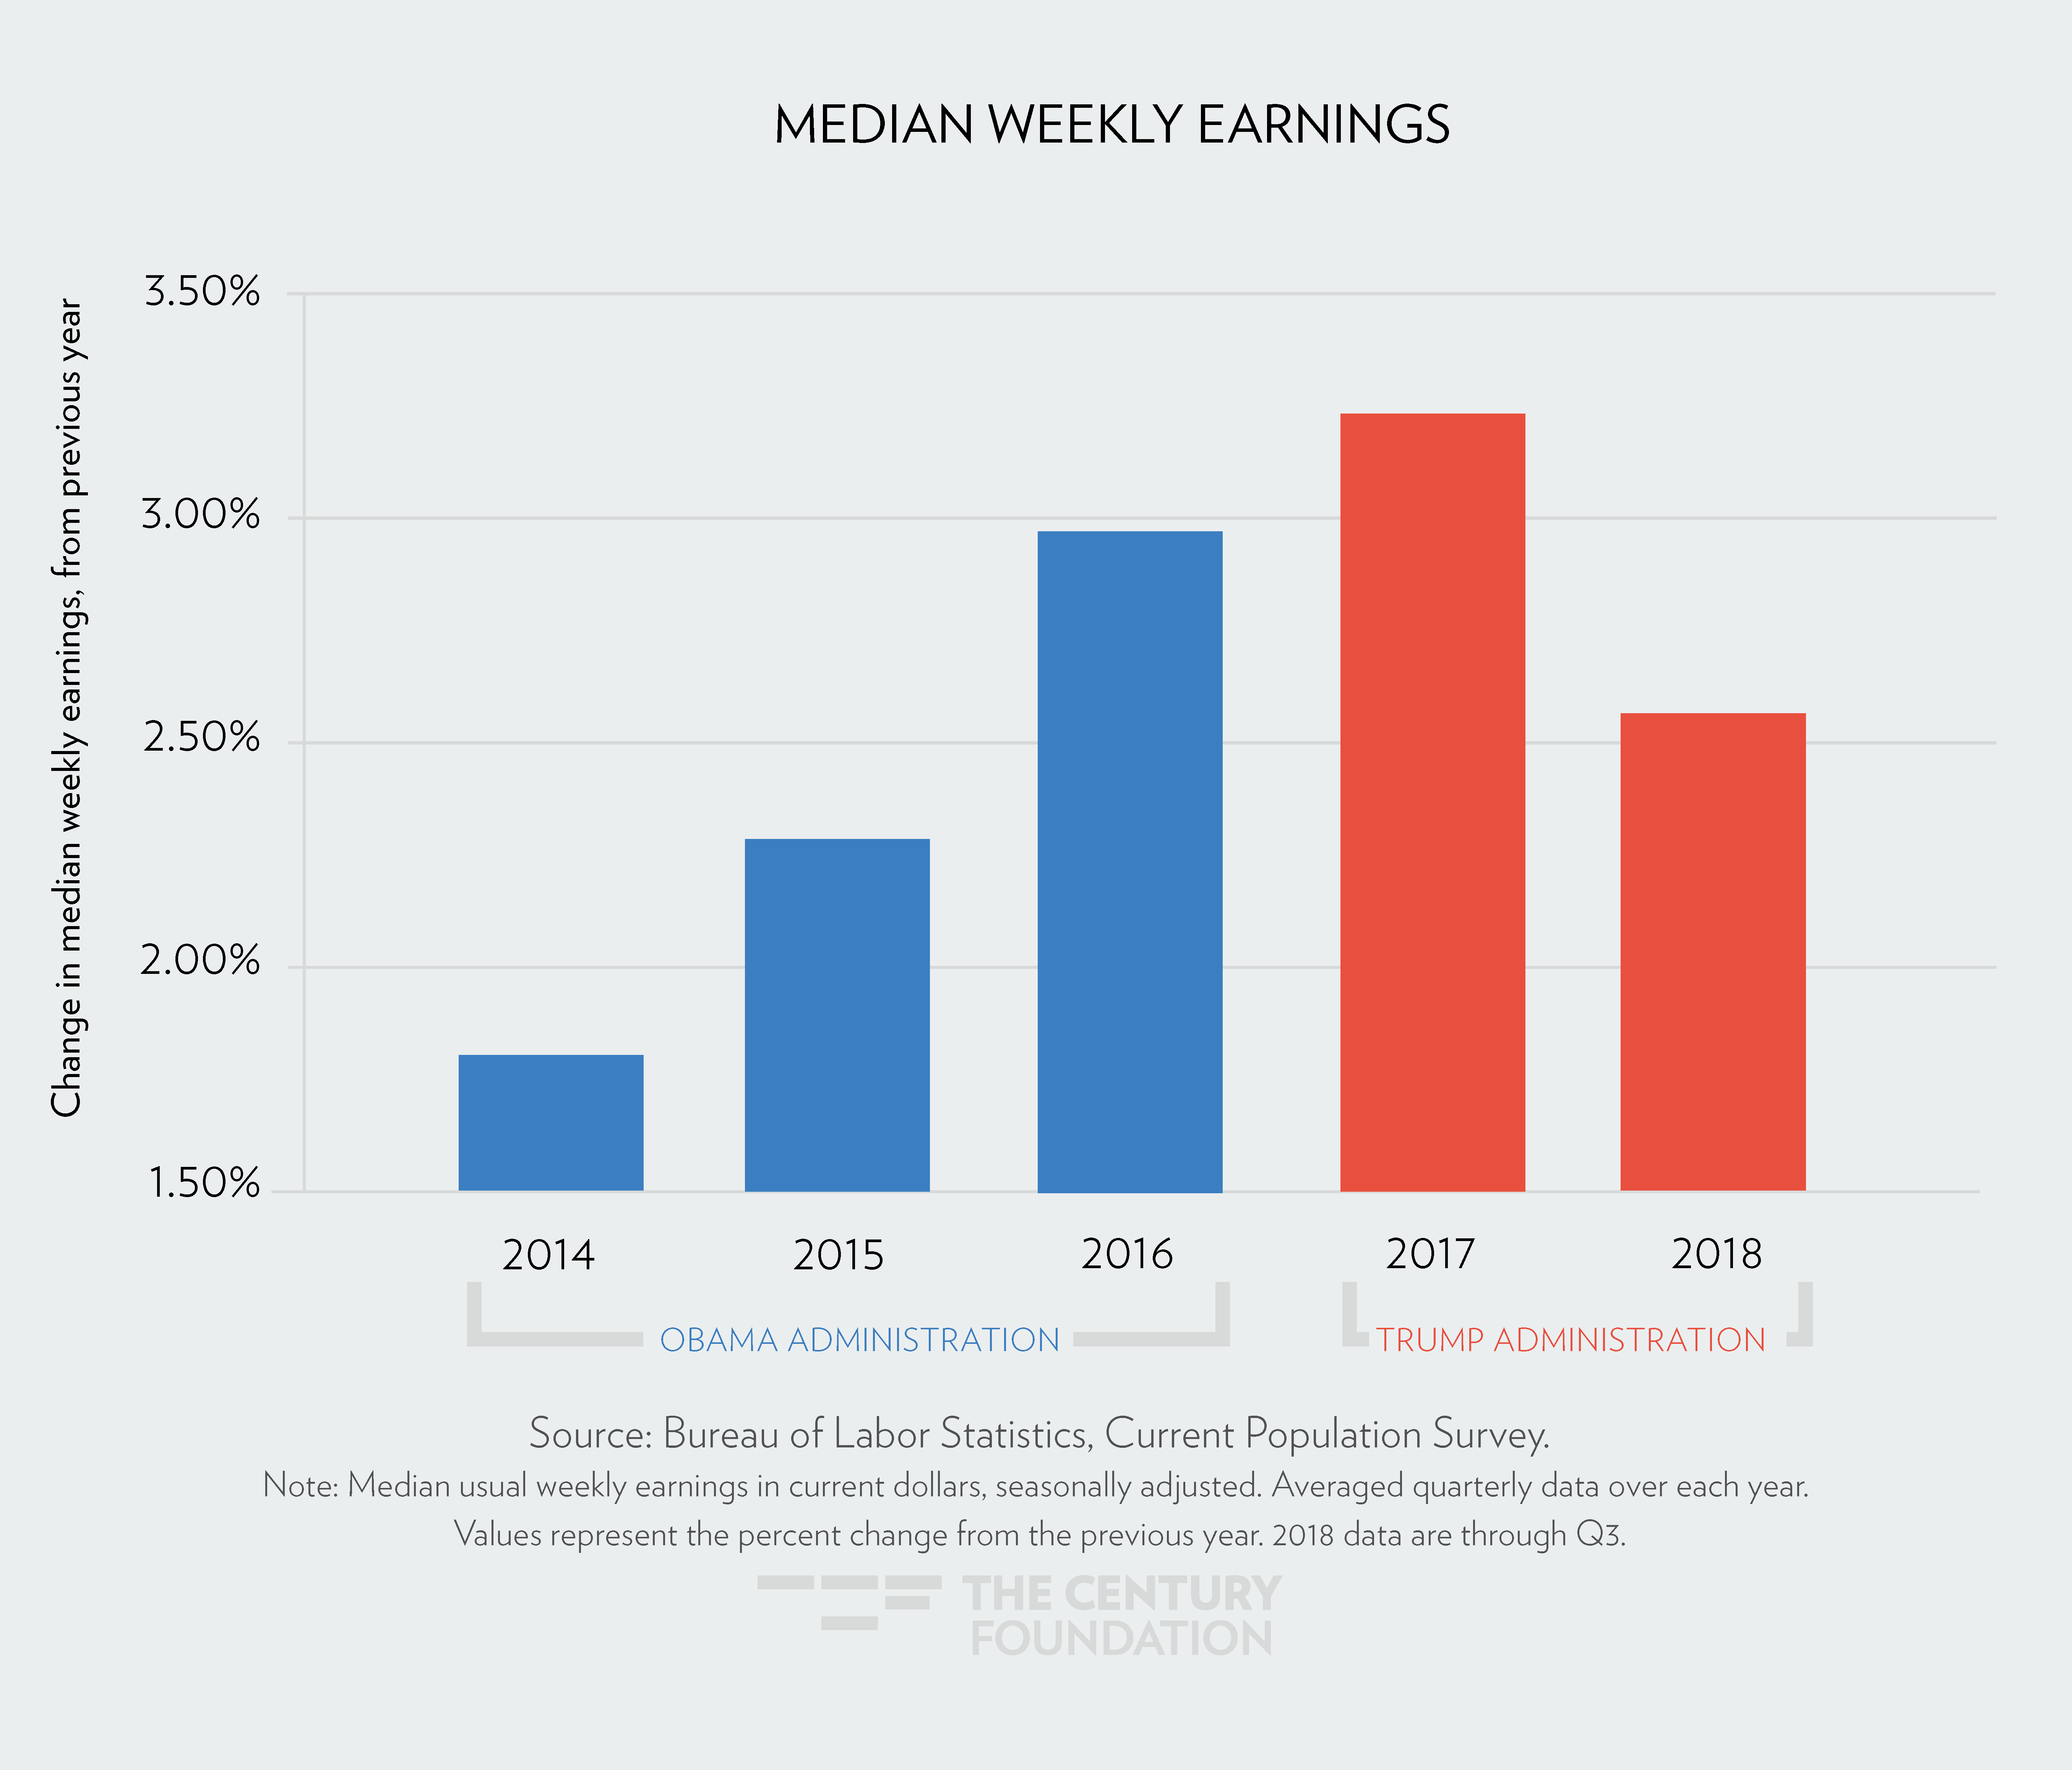
5. Wage Growth Grew Sharply in 2016 and 2017—Until 2018, When It Slowed
The Bureau of Labor Statistics’ Current Population Survey tracks wages by a variety of measures including demographics and income levels. Below we show that median weekly earnings have grown in each year presented, but at a different pace in each year.
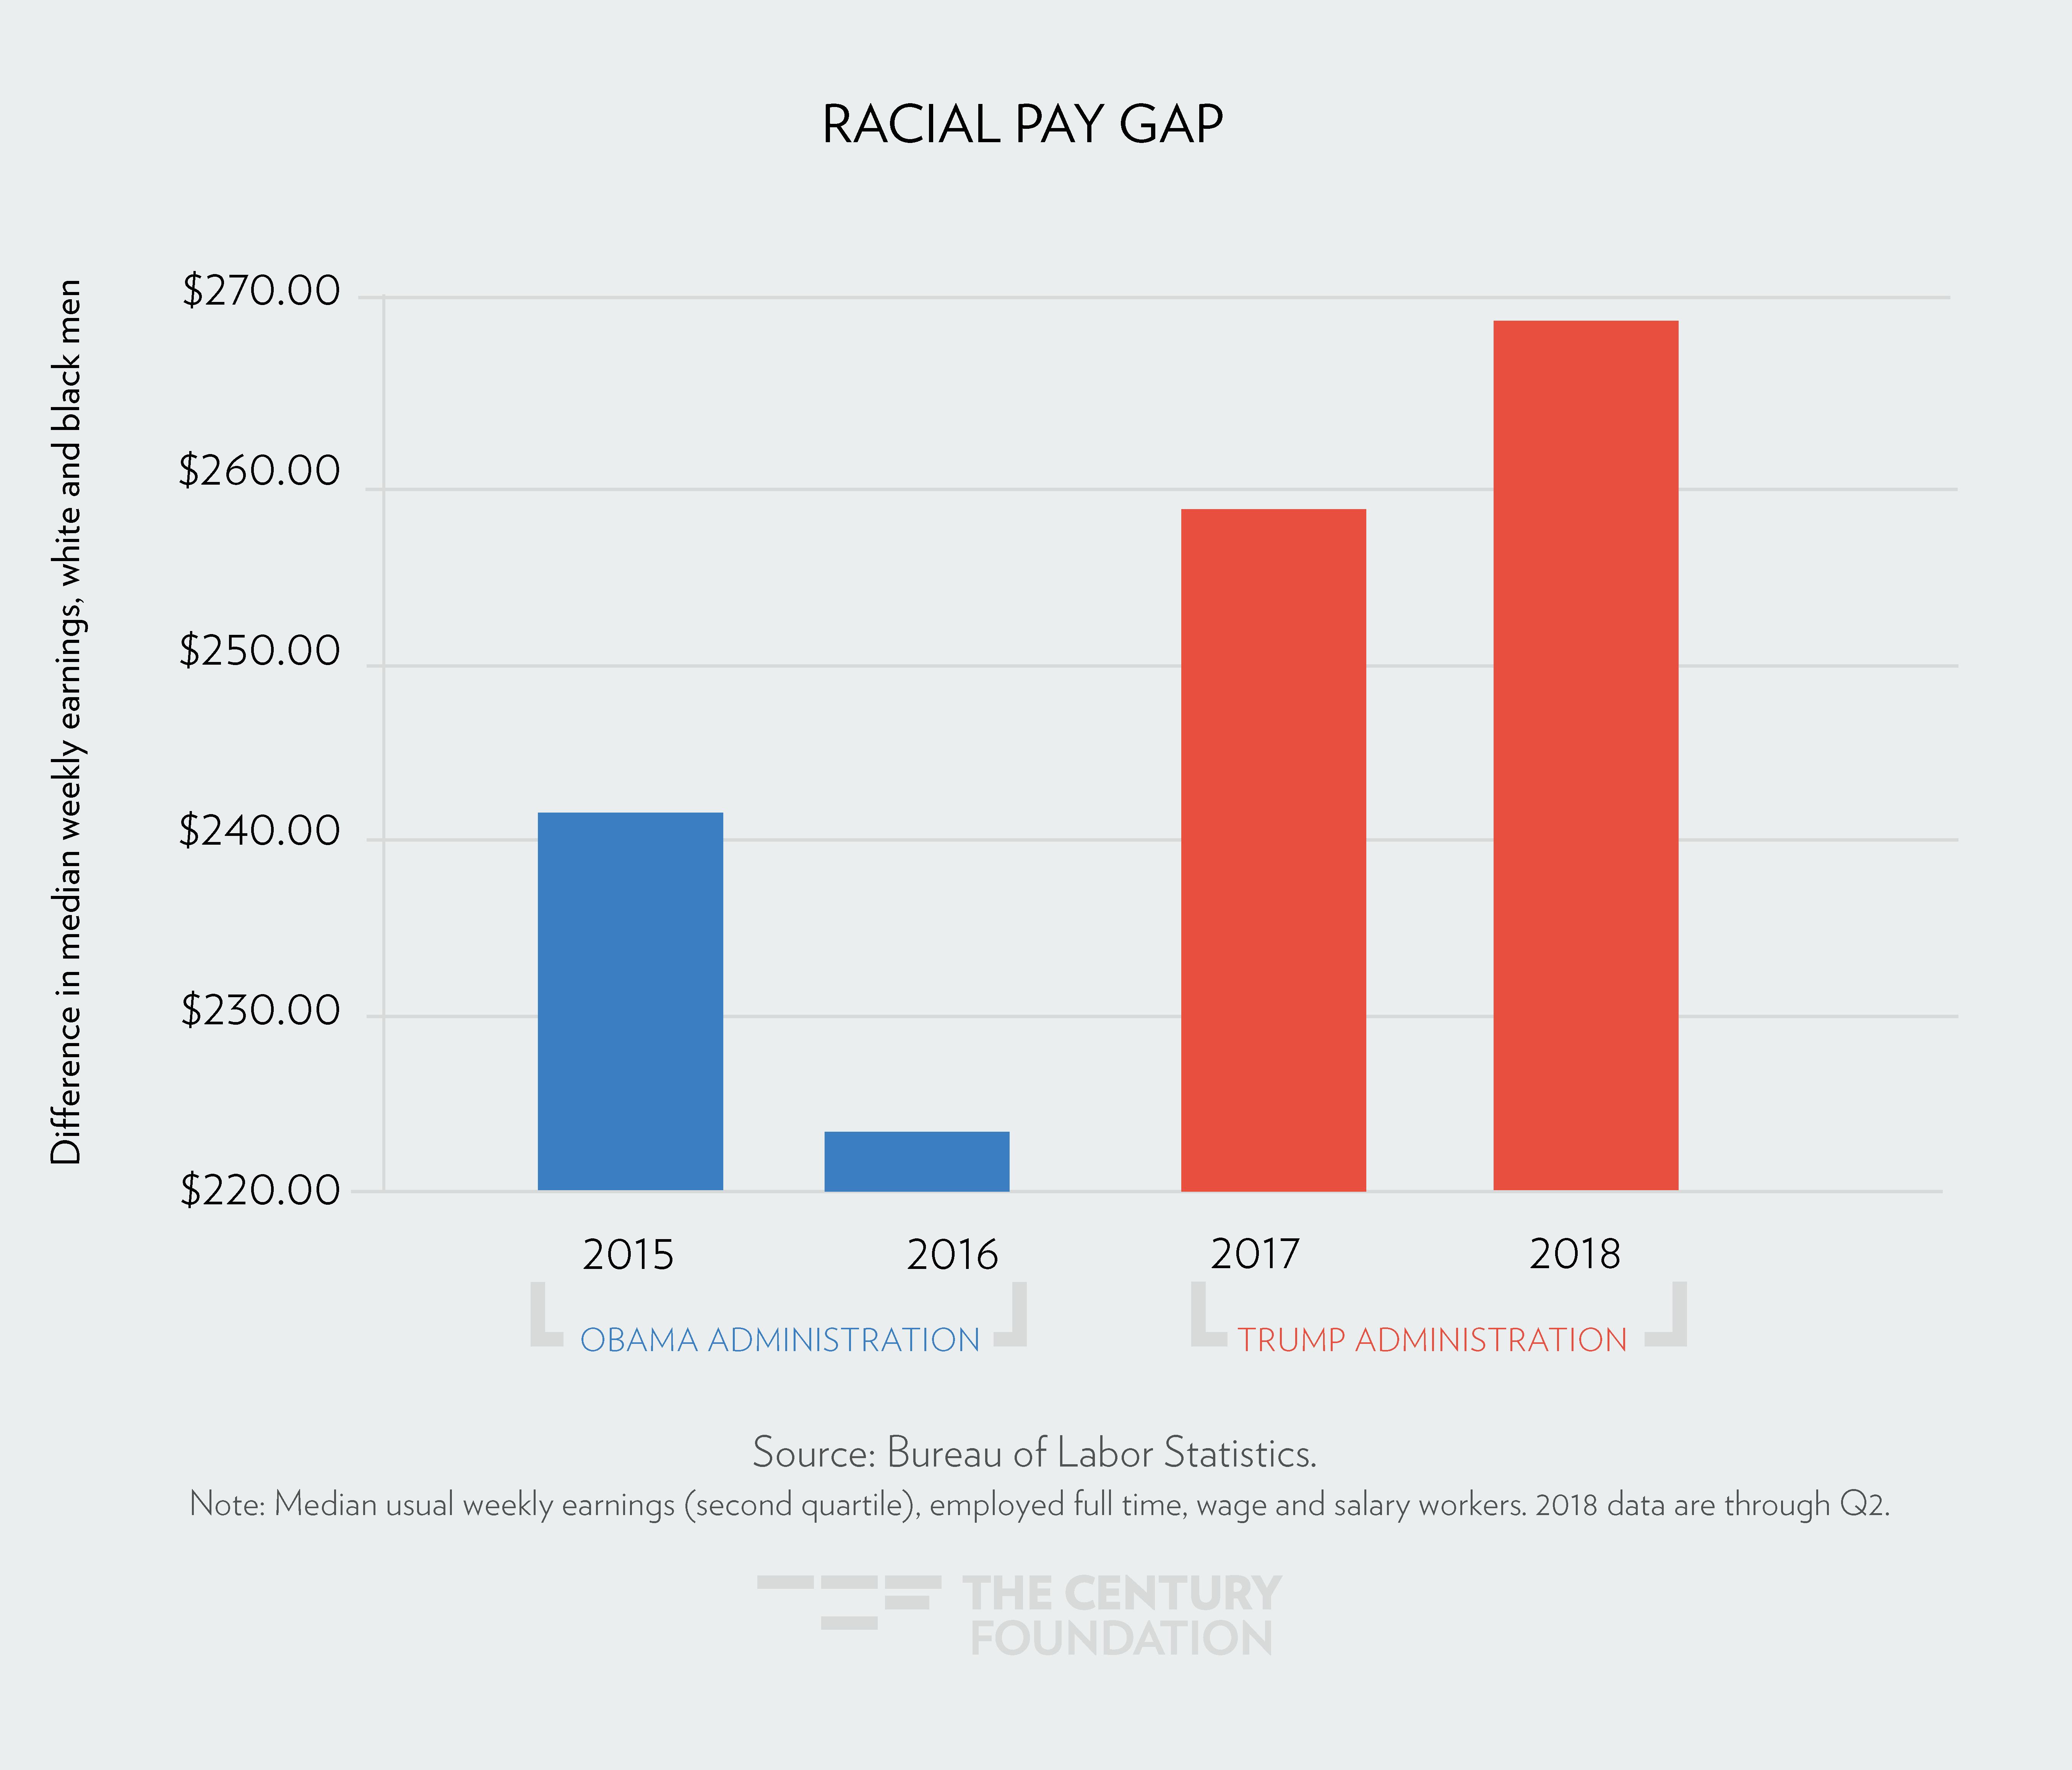
6. The Racial Pay Gap Declined in Obama’s Final Years—It Has Widened Under Trump
The racial pay gap documented below is the difference in weekly median earnings for white men and for black men. The higher the number presented below, the higher the gap between the two groups of workers.
7. Adult and Child Poverty Rates Have Fallen—But Much Faster under Obama
|
Percent Change in 2015 |
Percent Change in 2016 |
Percent Change in 2017 |
| Percent of Children Living in Poverty |
-6.64 |
-8.63 |
-2.78 |
| Percent (All) Living in Poverty |
-8.78 |
-5.93 |
-3.15 |
| Sources: Child poverty data are calculated by the U.S. Census. Both reflect the official poverty rate, rather than the supplemental rate. See also this fact sheet produced by the Children’s Defense Fund. |
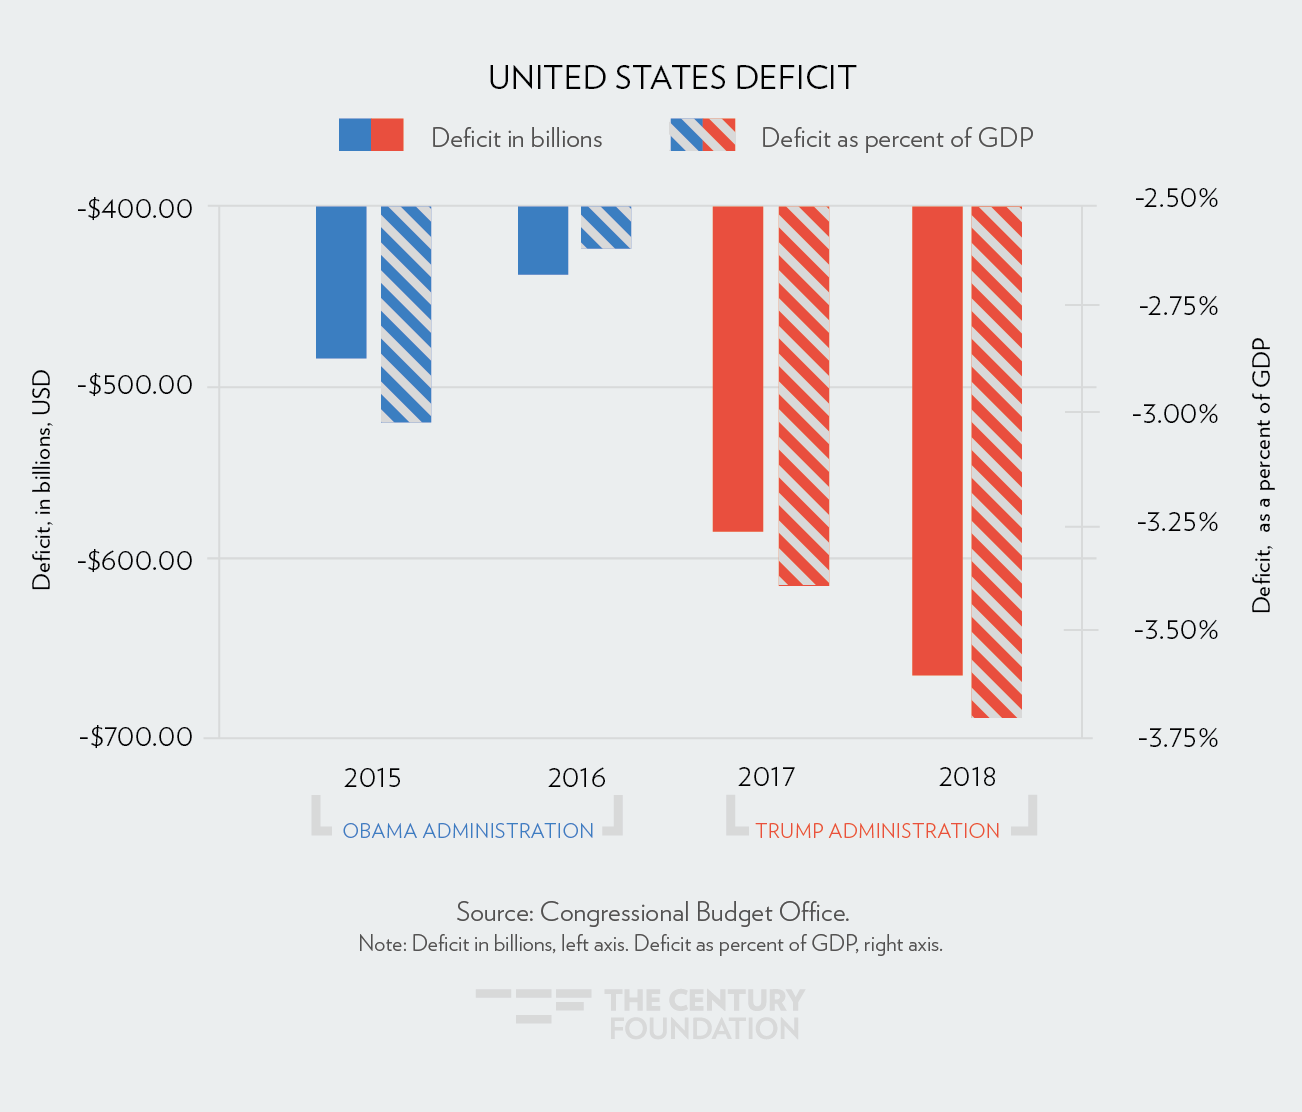
8. The Federal Deficit Is Growing Rapidly under Trump
The graph below shows the federal budget deficit, as measured by the Congressional Budget Office, in billions of dollars (left axis) and as a percent of GDP (right axis).
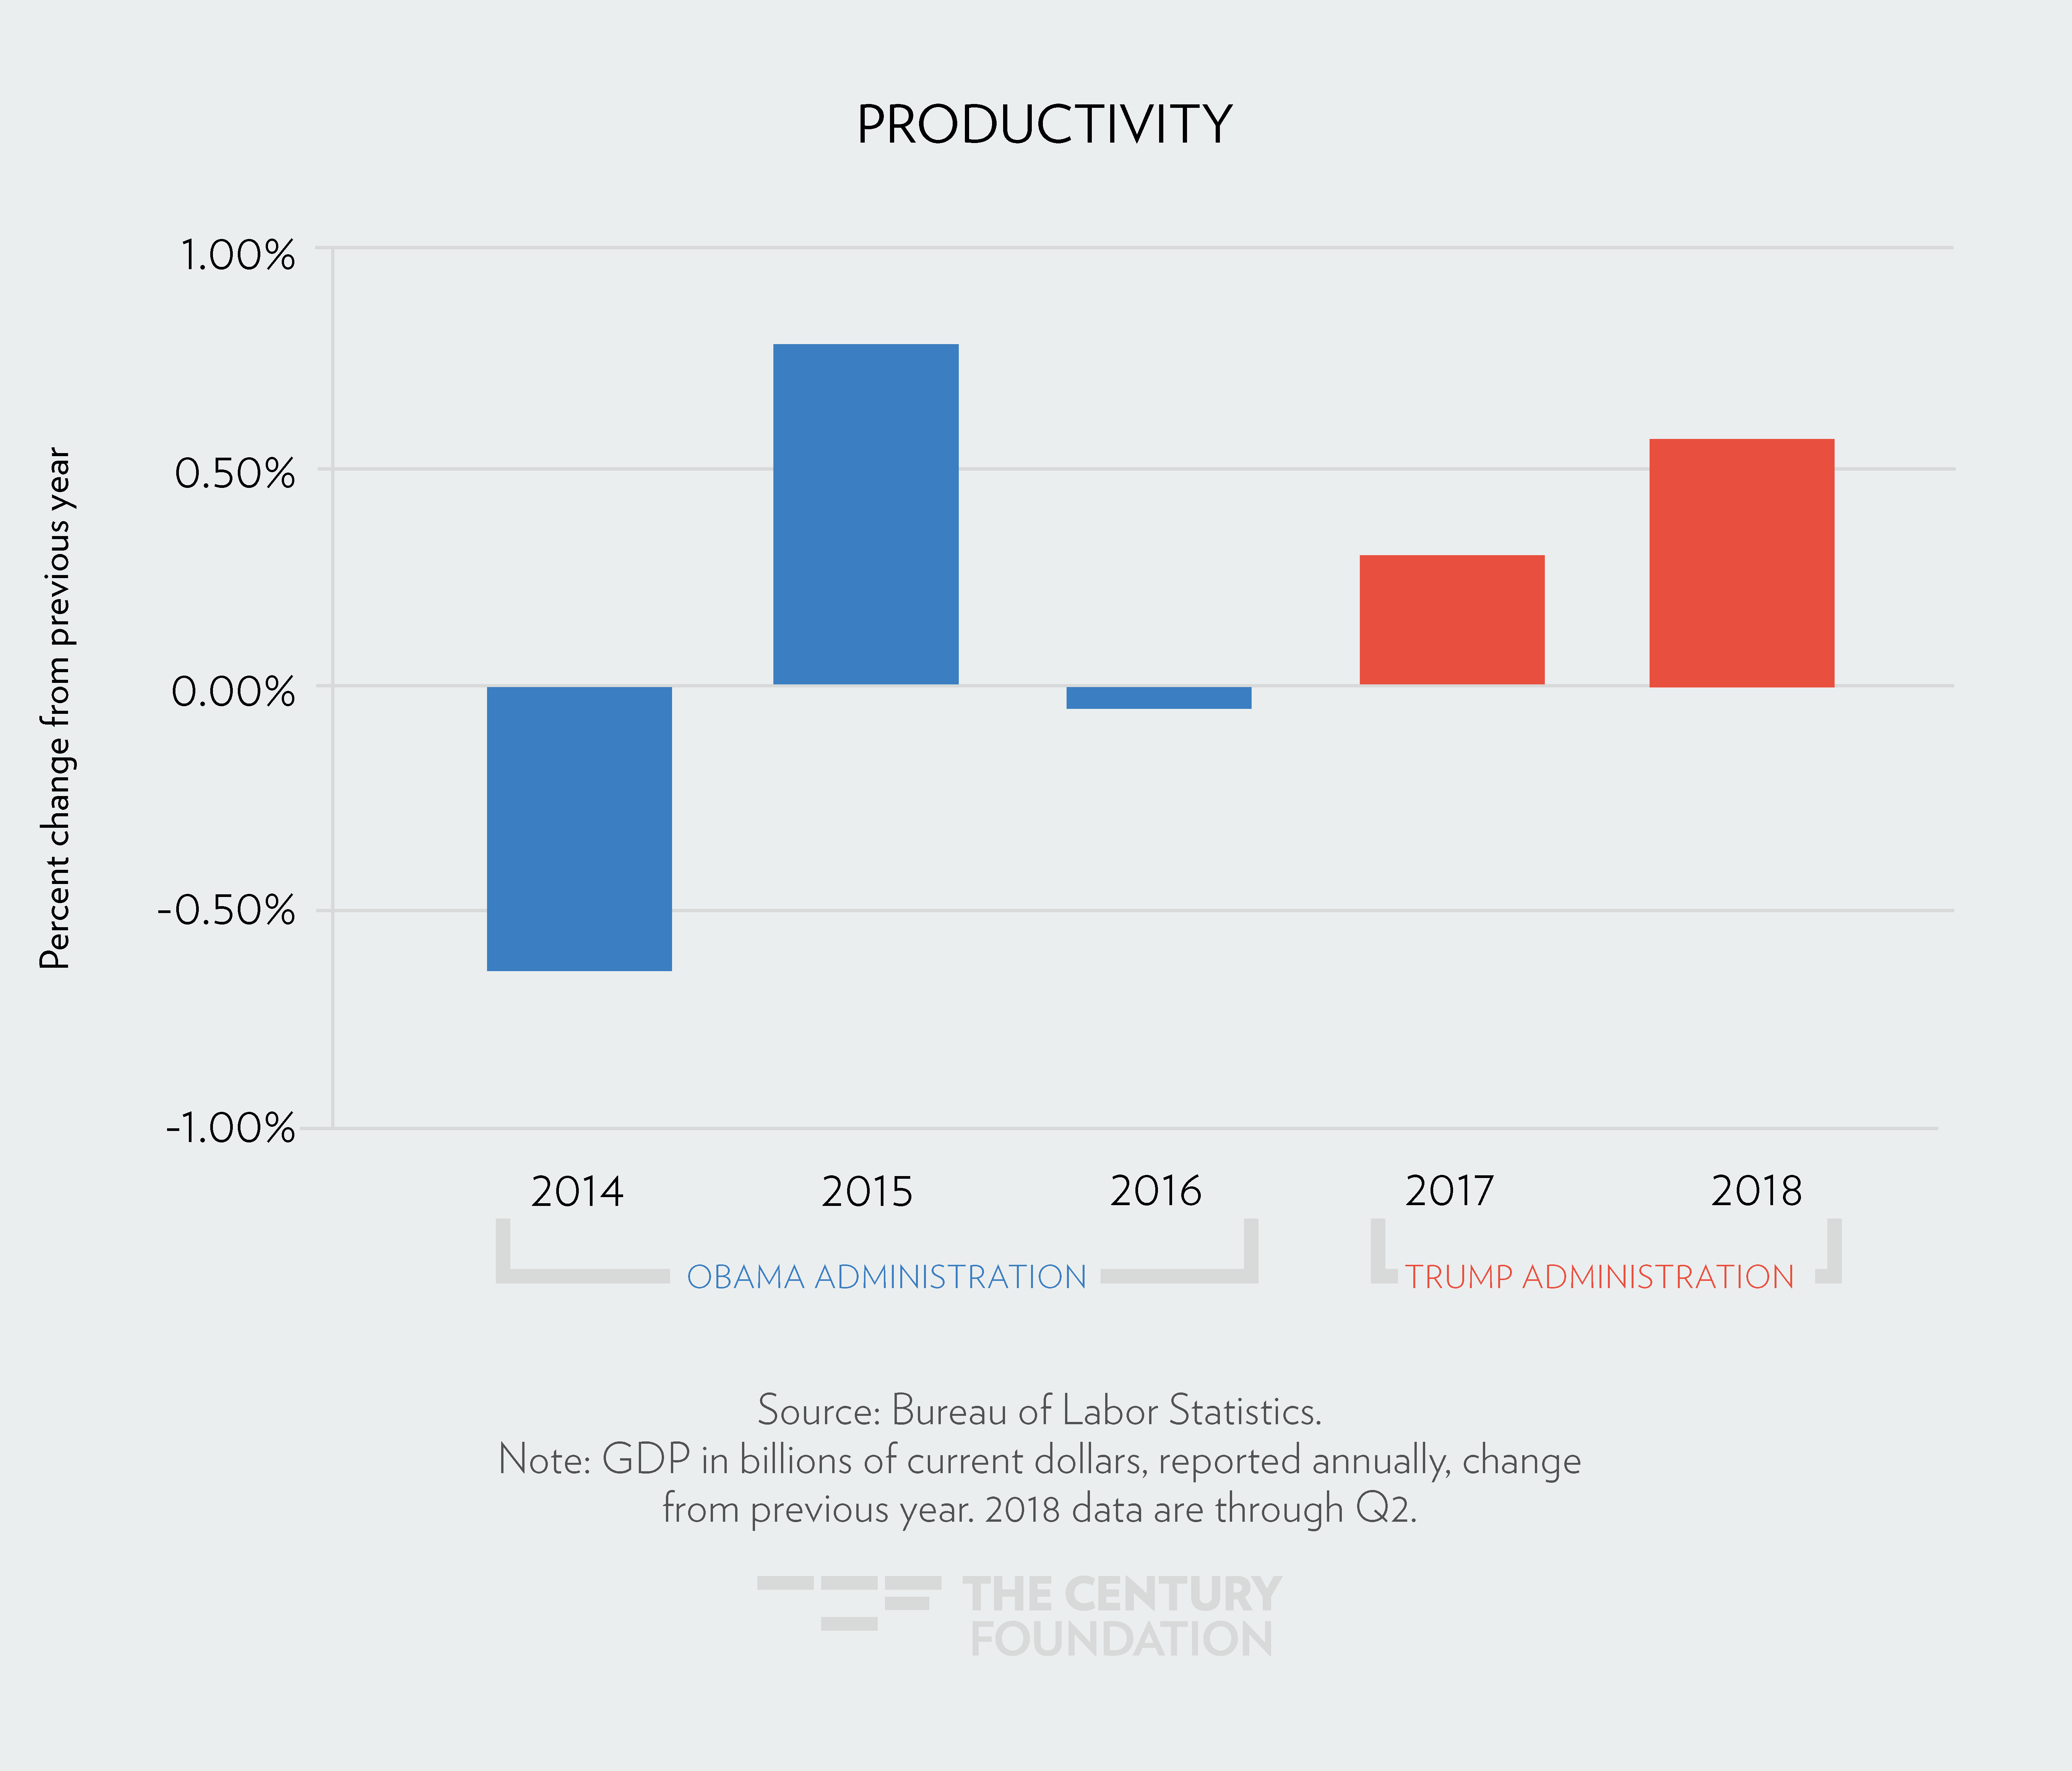
9. Growth in Worker Productivity Rose Slowly under Both Trump and Obama—But Remains Weak under Trump
The most common measure of productivity is the average output per hour of work. It is an indexed measure, and the figure below shows the growth in that figure from year to year.
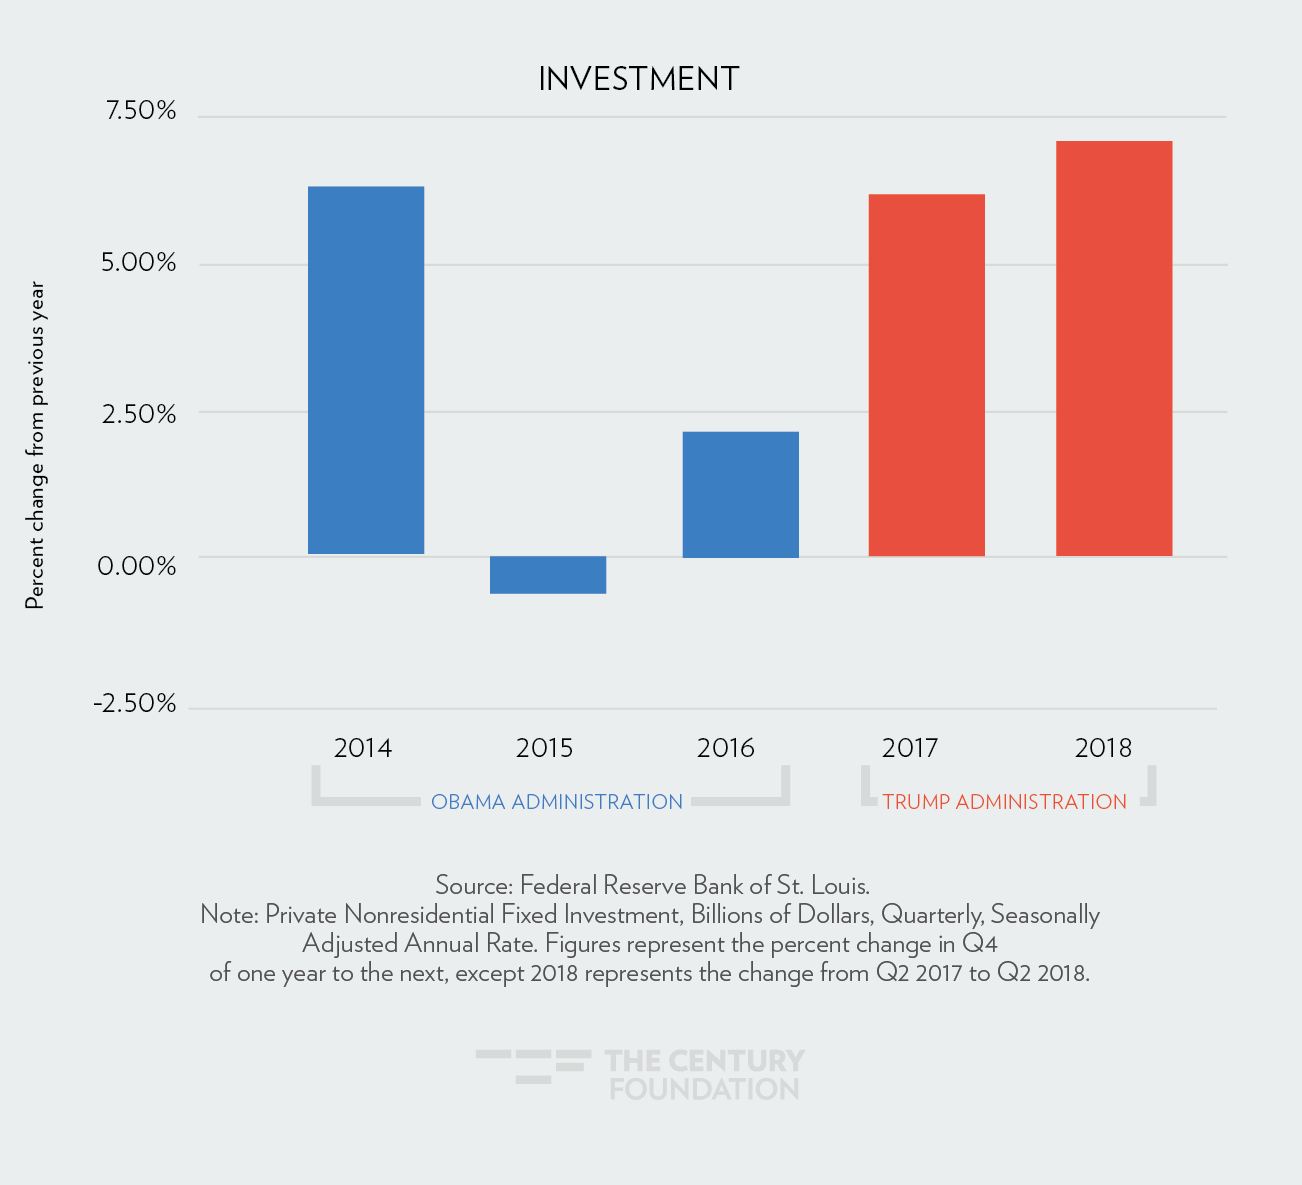
10. Despite Trump’s Massive Corporate Tax Cuts, Business Investment Isn’t Growing “Like Never Before”
Capital investment is a measure of how much businesses spend on research and development, equipment, and similar assets. The figures below represent the percent change from the previous year. The data on investment in the economy are in the billions. Given our deadlines, we did not include the preliminary estimate of third quarter investment, which has grown more slowly than in the second quarter.
11. It’s True Stocks Are at Their Highest Levels—But Stock Prices Grew Faster after the Reelections of Both Clinton and Obama
The S&P 500 is a key measure of stock prices. This figure shows the change in the S&P 500 from election day over the following 710 days to match the current duration of the Trump administration.
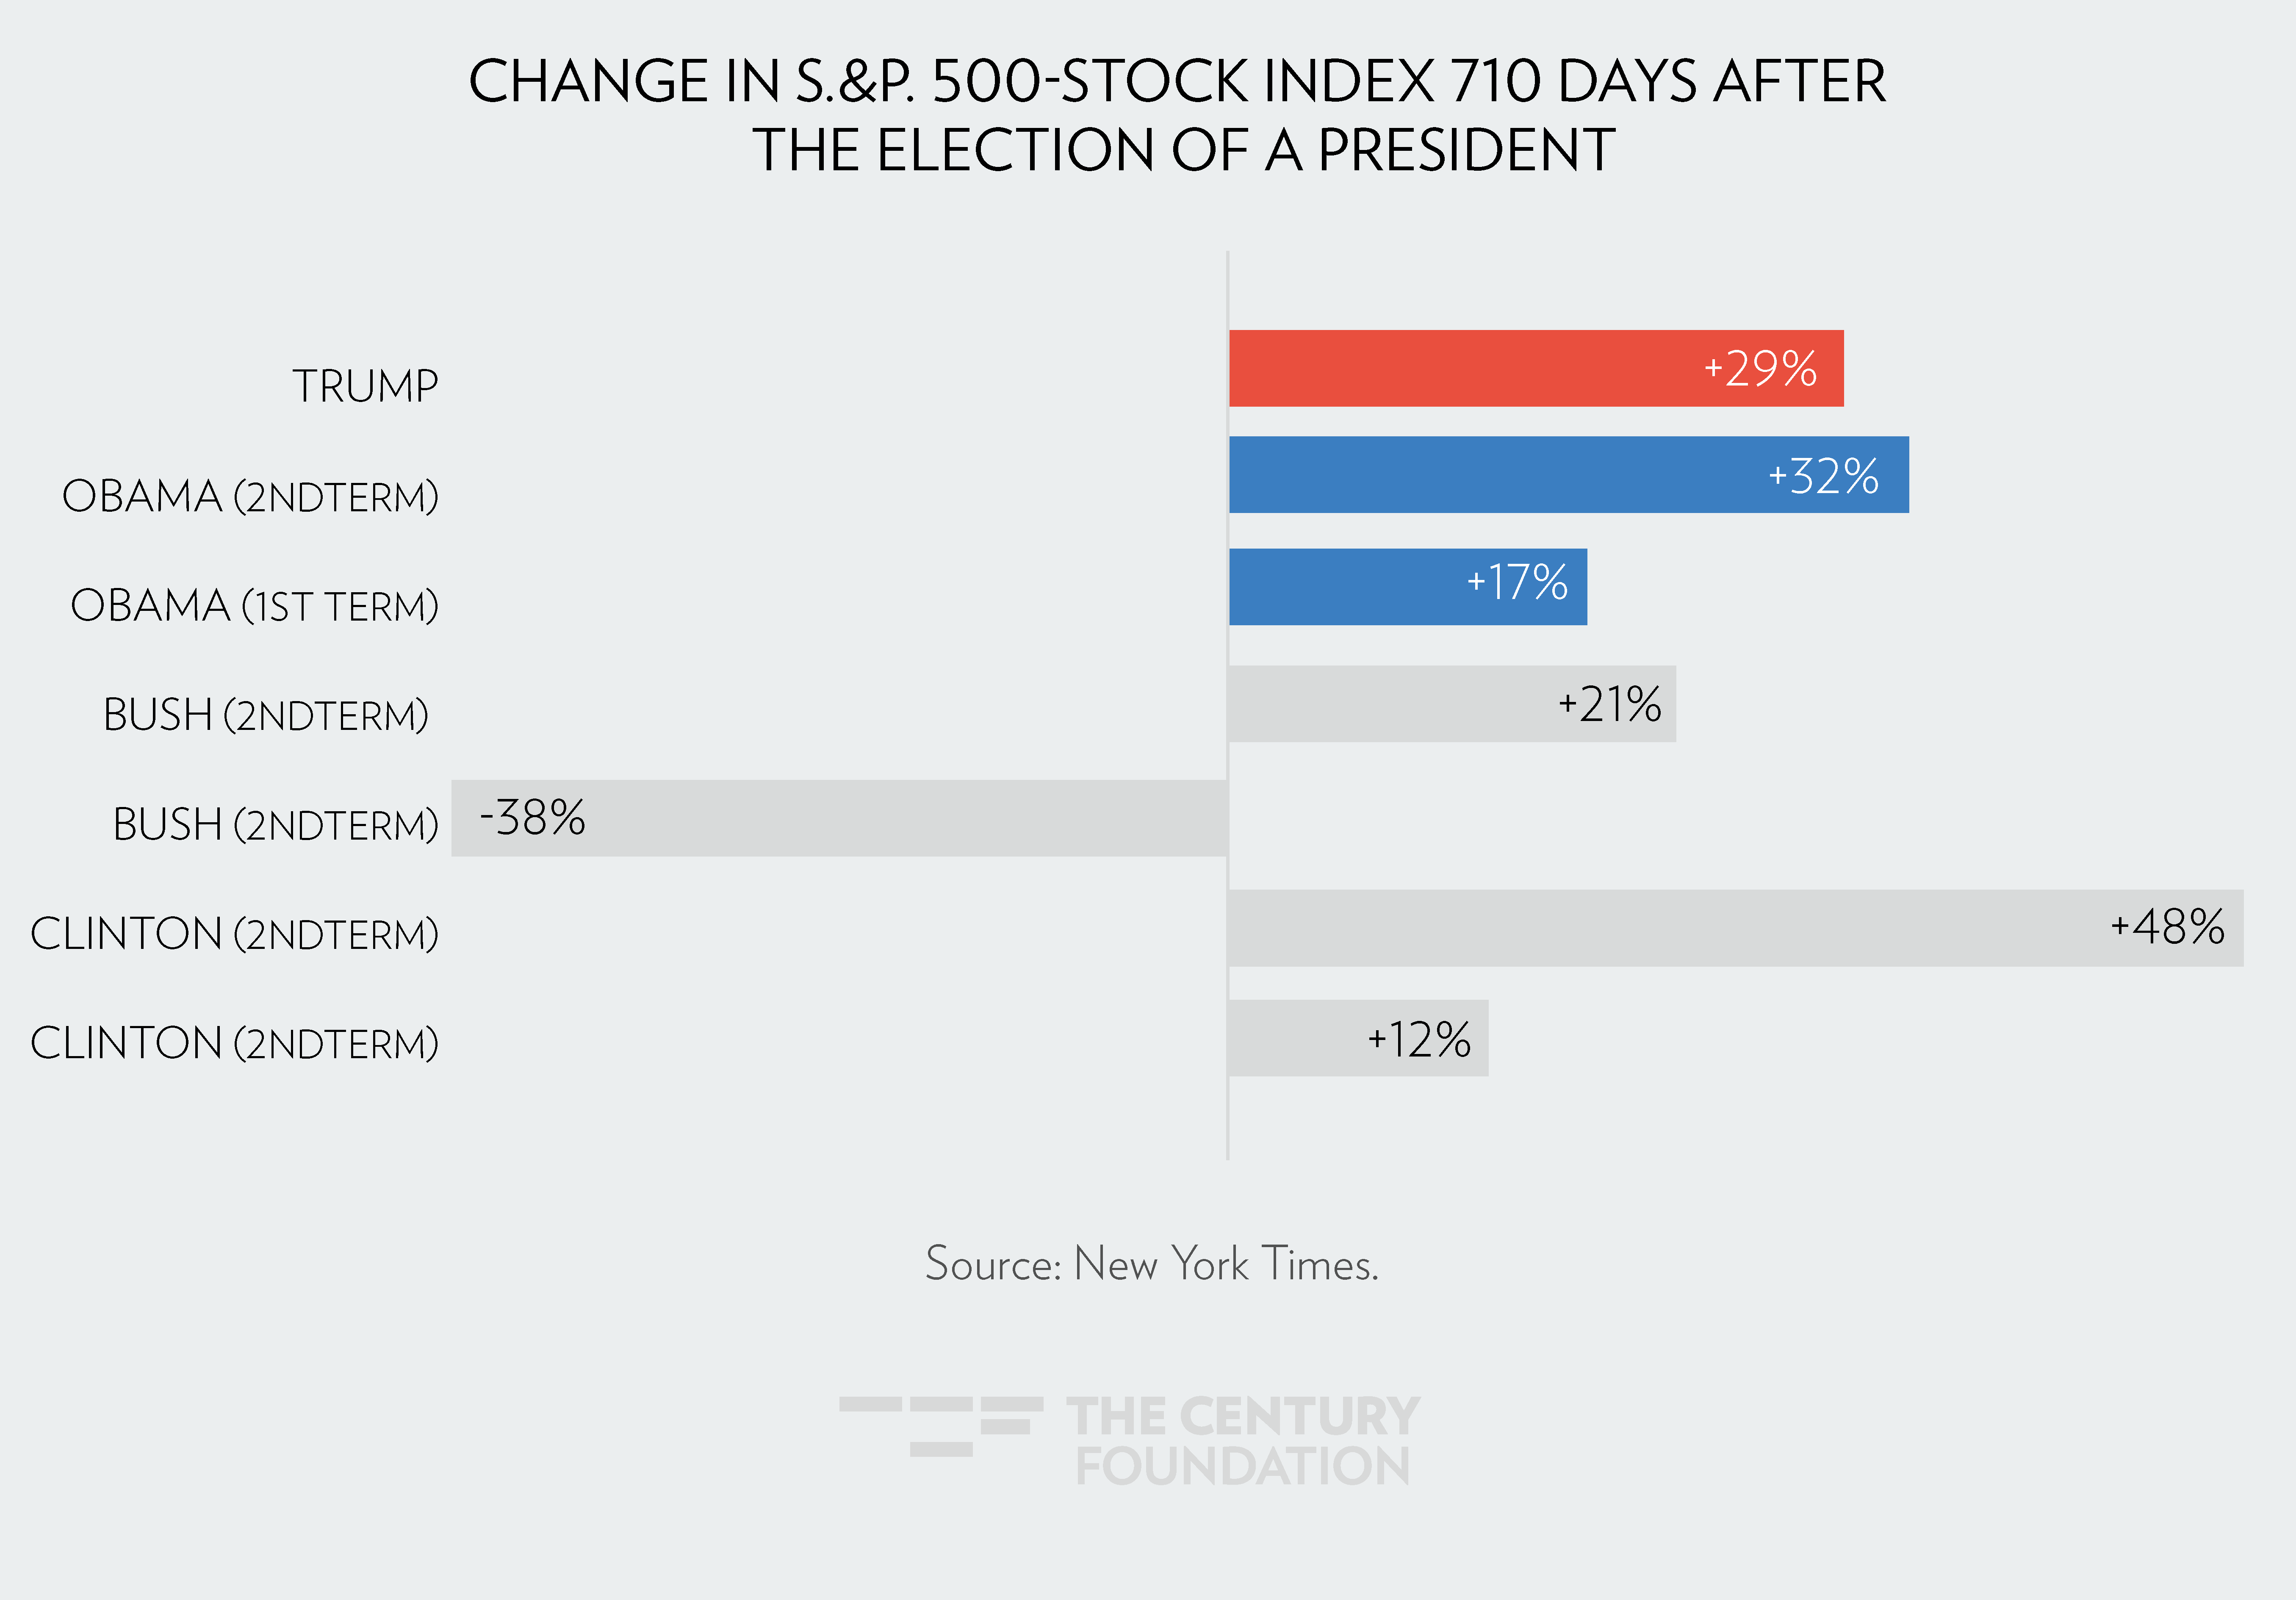
Photo Credit: November 1, 2016 – Wisconsin. Republican presidential nominee Donald Trump speaks at a campaign rally. (Photo by Chip Somodevilla/Getty Images)
Tags: jobs, economy, Trump, Wages
Trump Claims the Economy Is the Best Ever—These 11 Facts Tell a Different Story
There has been a great deal of political and media attention paid to the rate of economic growth under the Trump administration during 2017 and 2018. President Trump has often called the results under his administration unprecedented. His statements are unfounded: while wage growth has been strong, most other measures of economic growth under the current administration are less impressive than they were during the tail end of the previous administration, Barack Obama’s second term.
As Election Day nears, we’ve dug into the last four years, spanning the end and the beginning of two different sets of executive leadership, and now let the facts speak for themselves. By comparing the rate of growth of key economic variables in the last years of the Barack Obama administration to the record thus far in the Trump administration, we present a report card on results under the two presidents.
Sign up for updates.
1. GDP Growth Was Higher on Average under Obama in 2014 and 2015 Than Compared to Trump in 2017 and 2018
Gross Domestic Product, or GDP, is a measure of total income in the economy. Figures shown represent the percent change from the previous year of the Bureau of Economic Analysis’ accounting of GDP.
2. Monthly Job Growth Was Higher under Obama Than in Trump’s First Two Years
Using Bureau of Labor Statistics data on the number of jobs in the economy each month, this figure shows the average monthly job gains, by year.
3. The Unemployment Rate Was Falling Faster under Obama in 2014 and 2015 than in Trump’s First Two Years
The official unemployment rate, also measured by the Bureau of Labor Statistics, has declined but at different rates in each year, as shown below.
4. Growth in the Employment-to-Population Rate Has Slowed under Trump
The employment to population ratio (EPOP), currently at 60.4 percent, is the percent of prime-aged workers in the country that are working. The EPOP has been increasing slowly for all years presented below, but at different rates in each year.
5. Wage Growth Grew Sharply in 2016 and 2017—Until 2018, When It Slowed
The Bureau of Labor Statistics’ Current Population Survey tracks wages by a variety of measures including demographics and income levels. Below we show that median weekly earnings have grown in each year presented, but at a different pace in each year.
6. The Racial Pay Gap Declined in Obama’s Final Years—It Has Widened Under Trump
The racial pay gap documented below is the difference in weekly median earnings for white men and for black men. The higher the number presented below, the higher the gap between the two groups of workers.
7. Adult and Child Poverty Rates Have Fallen—But Much Faster under Obama
8. The Federal Deficit Is Growing Rapidly under Trump
The graph below shows the federal budget deficit, as measured by the Congressional Budget Office, in billions of dollars (left axis) and as a percent of GDP (right axis).
9. Growth in Worker Productivity Rose Slowly under Both Trump and Obama—But Remains Weak under Trump
The most common measure of productivity is the average output per hour of work. It is an indexed measure, and the figure below shows the growth in that figure from year to year.
10. Despite Trump’s Massive Corporate Tax Cuts, Business Investment Isn’t Growing “Like Never Before”
Capital investment is a measure of how much businesses spend on research and development, equipment, and similar assets. The figures below represent the percent change from the previous year. The data on investment in the economy are in the billions. Given our deadlines, we did not include the preliminary estimate of third quarter investment, which has grown more slowly than in the second quarter.
11. It’s True Stocks Are at Their Highest Levels—But Stock Prices Grew Faster after the Reelections of Both Clinton and Obama
The S&P 500 is a key measure of stock prices. This figure shows the change in the S&P 500 from election day over the following 710 days to match the current duration of the Trump administration.
Photo Credit: November 1, 2016 – Wisconsin. Republican presidential nominee Donald Trump speaks at a campaign rally. (Photo by Chip Somodevilla/Getty Images)
Tags: jobs, economy, Trump, Wages