There is renewed focus in our nation’s capital on raising the federal minimum wage. In July, the U.S. House of Representatives approved the Raise the Wage Act that will raise the federal minimum wage in stages to $15 an hour by 2025. The federal minimum wage has been stuck at $7.25 an hour for more than a decade. In intervening years, twenty-nine states and the District of Columbia have raised their minimum wages, but many workers in the other twenty-one states are still laboring under a woefully outdated wage floor that has left far too many working families in or near poverty and contributed to heightened income polarization. This report examines the impact of higher minimum wages among those states that have raised the minimum wage the most, and models what a federal minimum of wage of $15 an hour would mean for local government payrolls in the remaining states.
The rate of $15 an hour was chosen for analysis because there seems to be an emerging consensus among policymakers that the rate should be set at that level (or near that level):
- In the first half of 2019, four states—New Jersey, Illinois, Maryland, and Connecticut—joined New York, California, Massachusetts, and the District of Columbia in enacting legislation to raise their minimum wages to $15, in stages. These seven states and the District of Columbia together account for 30 percent of the nation’s workforce.
- Last year, local government actions took effect, raising the minimum wage to $15 an hour in Seattle and San Francisco, and New York City reached $15 at the beginning of this year under the state’s minimum wage legislation.
- Seven other states—Arizona, Colorado, Maine, Michigan, Missouri, Oregon, and Washington—have adopted legislation to raise their minimum wages in stages to the $12-to-$14.75 range.
Most of the policy focus around raising the minimum wage has been on employment and earnings impacts in the private sector, seeking to inform questions about how businesses would adapt, what implications there would be for employment levels and hours, and the living standards of low-wage workers. Very little attention has been paid to what the impact would be on the government workforce, and, in turn, on government budgets. When the topic has been discussed, often it takes the form of worries about further cost pressures on already tight local budgets, and in extreme cases, possibly even triggering tax increases or reductions in public services. This is the public sector equivalent of the pushback in the private sector that higher minimum wages will lead employers to cut jobs and hours. A growing body of academically respectable research finds that higher minimum wages on balance do not diminish private sector employment opportunities, that they are effective in raising incomes for low-income workers, and that they push businesses to become more efficient.1
Government directly employs nearly 15 percent of the nation’s workforce, with two-thirds of that employment (10 percent of the total workforce) occurring at the local government level, including local schools. Direct local government employment generally is not as low-wage-labor-intensive as food services or retail, but as statutory minimum pay levels rise, the wages of a significant portion of local government employees will rise as well.
The twenty-fifth-percentile hourly wage for local government employees (non-education, non-hospitals) was $15.61 in 2017, and for public elementary and secondary schools it was $14.58.2 While a $15 minimum wage would directly impact about a quarter of local government workers closer to one-third are likely to see higher wages after a move to a $15 minimum wage once spillover effects are taken into account.3 While this would mean a raise for a significant portion of the local government workforce, the estimates presented in this report show that the annual cost of a minimum wage increase phased in over six years is actually substantially less than the cost of general wage increases that local governments have been implementing during the 2013-to-2017 period.
In fact, the impact on local government expenses is significantly less than many municipal leaders may fear. For California, Massachusetts, New York State, New Jersey, Illinois and the District of Columbia, the cost of increasing wages to get all local government workers over the $15 minimum threshold is relatively small as a share of total local wage costs, ranging from 0.2 percent per year for the District of Columbia to 1.0 percent yearly for Illinois, with a weighted annual average of 0.6 percent.
The impact on local government expenses is significantly less than many municipal leaders may fear.
These cost increases are a fraction of the cost of the average annual wage increases local governments have paid in recent years. From 2013-to-2017, wages for local school employees rose by an annual average of 2.1 percent while for all other local government workers wages rose by 2.5 percent on average for these five states and the District of Columbia.4
Paying for a $15 minimum wage for local government workers will not be as easy in states where current wage levels currently are much lower and where much greater shares of the workforce will be affected. However, as the data presented in this report make clear, the challenge is not as daunting as one might think. In fact, the annual increases in local government payroll expenditures needed in these states between now and 2024 to reach $15 an hour under the Raise the Wage Act are well within the bounds of the average increases in wage costs local governments in these states saw over the 2013-to- 2017 period. (This is not to say that the increases needed for low-wage private sector workers who are paid less than most local government employees would not be significant.)
The Fiscal Impact Where the $15 Minimum Wage Is Being Phased In
California, Illinois, Massachusetts, New York State, New Jersey, and the District of Columbia by the end of February 2019 when the research for this report was conducted had adopted phased-in increases to their minimum wages on a path to reach $15 an hour.5 The phase-in schedules vary: New York City’s large employers are already at $15, under state legislation; the District of Columbia is scheduled to reach $15 on July 1, 2020; California and Massachusetts will reach $15 on January 1, 2022; New Jersey will hit $15 on July 1, 2024, and Illinois on January 1, 2025. (See Table 1.)
Table 1
| States (and the District of Columbia) That Are Phasing In a $15 Minimum Wage | |||||||||||
| 2013 | 2014 | 2015 | 2016 | 2017 | 2018 | 2019 | 2020 | 2021 | 2022 | 2023 | |
| California6 | $8.00 | $9.00 | $9.00 | $10.00 | $10.50 | $11.00 | $12.00 | $13.00 | $14.00 | $15.00 | $15.00+ |
| New York City7 | $7.25 | $8.00 | $8.75 | $9.00 | $11.00 | $13.00 | $15.00 | $15.00 | $15.00 | $15.00 | $15.00 |
| New York State: New York City suburbs8 | $7.25 | $8.00 | $8.75 | $9.00 | $10.00 | $11.00 | $12.00 | $13.00 | $14.00 | $15.00 | $15.00 |
| New York State: 54 upstate counties9 | $7.25 | $8.00 | $8.75 | $9.00 | $9.70 | $10.40 | $11.10 | $ 11.80 | $ 12.40 | TBD | TBD |
| Massachusetts | $8.00 | $8.00 | $9.00 | $10.00 | $11.00 | $11.00 | $12.00 | $12.75 | $13.50 | $14.25 | $15.00 |
| New Jersey10 | $7.25 | $8.25 | $8.38 | $8.38 | $8.44 | $8.60 | $10.00 | $ 11.00 | $12.00 | $13.00 | $14.00 |
| District of Columbia11 | $8.25 | $9.50 | $10.50 | $11.50 | $12.50 | $13.25 | $14.00 | $15.00 | $15.00+ | $15.00+ | $15.00+ |
| Illinois12 | $8.25 | $8.25 | $8.25 | $8.25 | $8.25 | $8.25 | $8.25 | $ 10.00 | $ 11.00 | $12.00 | $13.00 |
|
Note: Increases effective date January 1, unless noted. Source: Compiled by author from state department of labor websites. |
|||||||||||
These states consistently have higher local government wage levels than the national average, and, in fact, higher than for almost all other states. Most (Illinois is the exception) also have a much smaller share of their workforces that would be affected (directly and indirectly) by an increase to a $15.00 pay floor. On a combined basis (local government and school employees), 23 percent of workers in these states will be affected—considerably fewer than the 37 percent affected share for the forty-five other states.
To gauge the impact of a higher minimum wage on local government payrolls, this report relies on an analysis of wage data for local government employees from the Occupational Employment Survey (OES), compiled annually by the U.S. Bureau of Labor Statistics. The OES data allow us to estimate the earnings distribution for two sets of workers: (1) local government workers (not including school and hospital workers) and (2) employees in elementary and secondary schools.13 Table 2 presents an analysis of the OES employment and wage data for all the states, sorted into three groups: the six jurisdictions discussed above that had adopted $15 minimum wages by the end of February 2019; twenty-four states that have raised their state minimum wages above the $7.25 federal level but had not yet adopted a $15 minimum wage as of the end of February 2019; and the remaining twenty-one states that are still at the $7.25 federal minimum. The wage data for general local government workers are shown separately from elementary and secondary school employment, as that is how the OES data are presented.
Table 2
| Estimated Cost of Increasing Wages for Local Government Workers to at Least $15 an Hour by 2024, Compared to 2013–17 Increases | ||||
| Annualized Estimated Wage Increase to Reach $15 an Hour in 2024 (or sooner14*) | Annualized Change in Median wage, 2013-17 | |||
| States, including the District of Columbia (grouped by current minimum wage status) | Local government employment (excluding schools and hospitals) | Employment in local elementary and secondary schools15 | Local government employment (excluding schools and hospitals) | Employment in local elementary and secondary schools16 |
| Five states that have adopted a $15 minimum wage floor and the District of Columbia | 0.5% | 0.7% | 2.5% | 2.1% |
| Twenty-four states above $7.25 federal minimum | 0.9% | 1.0% | 2.4% | 1.7% |
| Twenty-one states at $7.25 federal minimum | 1.5% | 1.5% | 2.2% | 2.1% |
|
Note: See the Appendix table for the states in each group. Source: Author’s estimates based on BLS Occupational Employment Survey for 2013 and 2017. |
||||
For these jurisdictions, the cost of increasing wages further to the $15 minimum threshold is relatively small as a share of total wage costs, ranging from 0.5 percent annually for general local government workers (that is, excluding education and hospitals) to 0.7 percent annually for local school employees. These cost increases are fairly small, particularly when compared to the cost of average annual wage increases paid in recent years that were 2.1 percent annually for school employees and 2.5 percent for general local government workers. (See Figure 1.) Only a portion of these costs were from the increase to a $15 an hour wage, with some of the increase coming from negotiated raises with public sector unions. In the case of New York City, for example, close to 300,000 city employees (including school employees) received wage increases that averaged 2.6 percent per year during the years from 2013 to 2017 from collective bargaining agreements.17 Four of the jurisdictions raised wages even more at the 10th percentile level than at the median.18 California boosted wages at the 10th percentile at an annual average of 4.6 percent over this period.19
Figure 1
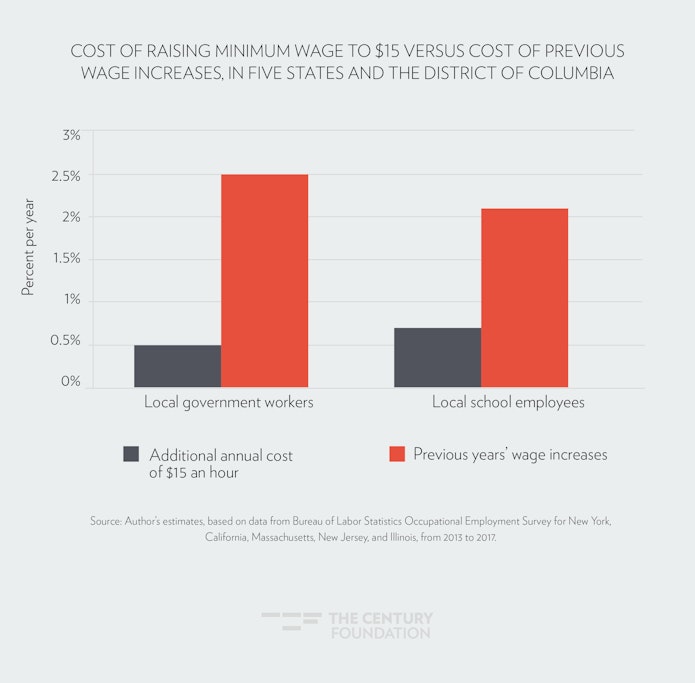
These states are clearly well on their way to reaching the $15 an hour minimum for most local government workers, and the further increases in wages needed to reach that threshold are much less than recent wage increases.20 In other words, while the move to a $15 minimum wage may seem like a huge leap, the cost of meeting those increases for local governments will not be.
What about the Fiscal Impact in Other States?
Paying for a $15 minimum wage for local government workers will not be as easy in other states, where current wage levels are lower and larger shares of the workforce will be affected. However, as the data presented in Table 2 make clear, the challenge is not as daunting as one might think. In fact, the annual increases in wage costs that would be needed between now and 2024 to reach $15 under the Raise the Wage Act are well within the bounds of the average local government wage increases these states saw over the 2013-to-2017 period, even for the twenty-one states where the $7.25 an hour federal minimum wage still prevails.
The annual increases in wage costs that would be needed between now and 2024 to reach $15 under the Raise the Wage Act are well within the bounds of the average local government wage increases these states saw over the 2013-to-2017 period.
The first two columns of Table 2 show the annual average cost of increasing wages to $15 an hour by 2024. For the twenty-four states with minimum wages above $7.25 but that had not yet enacted a phased-in $15 minimum wage by the end of February 2019, the cost is about 1 percent annually; that is, 1 percent relative to the total wages and salaries of all local government employees. For the twenty-one states that have not increased their minimum wages above the $7.25 federal minimum wage floor, the cost would be about 1.5 percent annually for both general local government and school employees.
These costs are well below the typical wage increases provided to local government workers in these states in recent years—data shown in the last two columns in Table 2. From 2013 to 2017 (the latest year available in the OES data21), the increase in median wages for local government workers averaged from 1.7 percent (school employees) to 2.4 percent (general local government workers) in the twenty-four states with minimum wage levels above the federal minimum. Thus, for general local government workers, these states have in recent years increased the median wage by a rate that is 1.5 percentage points more per year than would be needed to fund a phased-in $15 minimum wage. For school employees, the differential is smaller, but local governments have increased the median wage by 0.7 percentage points per year more than the total wage increase that would be needed to raise wages for the roughly one-third of workers who would be affected directly or indirectly by raising the minimum to $15 an hour.
The twenty-one states still at the $7.25 federal minimum generally pay lower wages to local government employees, which means about two out of every five local government workers would be directly or indirectly affected were the minimum wage to rise to $15 an hour. However, even for these states, the median wages provided to local government workers in recent years have increased at a higher rate than total wage costs would have to increase in order to raise the wage floor to $15 an hour by 2024. Wages for the median general local government employees increased an average of 2.2 percent annually from 2013 to 2017, and for school employees by 2.1 percent, while the wage cost increase of phasing in a $15 wage floor over the next six years would average 1.5 percent annually. (See Table 2.)
Other Cost Estimate Considerations
While health insurance and pension coverage generally are better for government workers than for many private sector employees,22 an increase in the minimum wage would only entail a slight increase in retirement contributions, since they track with increased wage levels. Health insurance premiums do not change depending on pay level. Keep in mind, however, that the baseline wage increases for local government employees over the period of 2013 to 2017 shown in Table 2 also would have entailed higher retirement contributions (and payroll taxes), so the relative comparison of projected minimum wage increases to previous local government pay increases discussed above would not be affected by factoring in fringe benefit costs.
It is also important to keep in mind that the analysis shown in Table 2 reflects a likely overestimate of the additional wage costs needed to reach $15 an hour in that the estimate presented here does not factor in any wage increases that might have occurred since May 2017 when the OES survey was conducted, as the estimates of the cost of raising wages to lift everyone above $15 an hour was based on wage levels existing as of May 2017. Any wage increases that have occurred since then would further lessen the estimated cost of reaching $15 an hour.
Considering that unemployment has generally fallen since early 2017, it is not surprising that state and local government workers have seen continued wage increases in the past two years. According to data from the BLS Employment Cost Index series, on average for the country, state and local government workers saw wages rise 2.1 percent in 2017 and 2.4 percent in 2018, larger annual gains than the average during the four previous years.23
There is undoubtedly some unevenness in the fiscal ability of local governments within a given state to manage a $15 wage floor. For example, in New York State, some suburban and upstate local government and school districts have seen their finances severely constrained by a tight property tax cap and by limited state aid to localities in recent years.24 In most states, local governments, particularly school districts, rely mainly on the property tax for revenues to fund the wages and salaries of local government employees. State governments generally have more broadly based revenue sources, such as the personal or business income taxes, that could be used to bolster local government finances. Government employee wage and salary costs are about one-third of total expenditures for local governments on average, but only 15 percent of expenditures for state governments.25
Fiscal and Community Benefits from a Higher Minimum Wage
Lifting wages for low-wage workers has the added benefit of yielding some fiscal dividends for government in budget savings from reduced expenditures for public benefits, as low-wage workers are better able to support their families without having to rely as heavily on public subsidies, such as for health insurance or child care. These monetary dividends are challenging to quantify, and some of the savings accrues to the federal and state governments rather than local, but there are clearly strong dividends for community well-being, with parents better able to provide for their families and be more involved in local schools and community activities. We are a rich country. There is no reason why people who work hard and play by the rules should have poverty-level living standards. Raising the wage floor is the best way to reduce the ranks of the working poor, and improve the life chances of their children. With the steady rise in the minimum wage, child poverty in New York City fell from 30 percent to 24 percent between 2013 and 2018, and in California from 23 to 17 percent over this period. Child poverty also declined in the rest of the United States between these years, but the decline for New York City and California was 6 percentage points, more than one-and-a-half times the reduction in child poverty in the rest of the country.26 And the minimum wage is higher now than in 2017.
What may present more of a fiscal challenge to local governments than the cost of a rising minimum wage floor for their direct employees is the need to increase funding in contracts with nonprofits providing essential human services. In a growing economy, states should be able to help nonprofits fund their higher wage by prioritizing more of their state budgets for needed social services and leveraging federal dollars without raising taxes. Nonetheless, this is an important area of further policy research and inquiry.
Conclusion and Policy Recommendations
Momentum is building around the country to raise the minimum wage to a more livable $15 an hour threshold. Local governments account for about 10 percent of the nation’s total workforce, and about one-third of all local government workers would directly or indirectly be affected by a $15 minimum wage. A higher minimum wage for local government and public school employees will foster greater workforce retention, improve the quality of service delivery, and significantly benefit the incomes and well-being of millions of families and their communities.
Can local governments afford this? It certainly looks from the data as though the cost of phasing in wage increases for the bottom third of the local government workforce over six years to reach $15 by 2024 is manageable and, on an annual basis, within the bounds of wage increases provided in recent years. In fact, the estimates presented here overstate the additional cost, since they do not incorporate wage increases paid over the past two years when unemployment has been low, and wages increased more for state and local government employees than during the 2013-to-2017 period.(Since many low-wage private workers are paid less than local government workers and have not seen comparable increases in recent years, somewhat greater wage increases will be needed to lift these workers to $15 an hour.)
Where the finances of individual local governments call into question their ability to fund higher wages for the lowest-paid, state governments should utilize their more extensive—and less regressive—revenue bases to assist financially strapped local governments.
Download the Appendix
Notes
- Kevin Rinz and John Voorheis, “The Distributional Effects of Minimum Wage Evidence from Linked Survey and Administrative Data,” March 27, 2018; Sylvia Allegretto, Anna Godoey, Carl Nadler and Michael Reich, “The New Wave of Local Minimum Wage Policies: Evidence from Six Cities,” University of California, Berkeley, Center on Wage and Employment Dynamics, September 6, 2018; David Cooper, Lawerence Mishel, Ben Zipperer, “Bold increases in the minimum wage should be evaluated for the benefits of raising low-wage workers’ total earnings,” Economic Policy Institute, April 18, 2018. and Michael Reich, “What are the Likely Effects of a $15 Federal Minimum Wage by 2024?” Testimony prepared for presentation at the hearing of the House Education and Labor Committee, Washington, D.C., February 7, 2019.
- As discussed below, local and state governments contract out a broad range of services, including the delivery of most government-funded human services ranging from child and foster care services, to mental health, and services for seniors. Many publicly funded human services are provided by relatively low-paid nonprofit employees.
- In this report, when talking about the workers whose wages will rise as a result of a higher minimum wage, we use “affected” to refer to those directly and indirectly affected, with the indirectly affected those who now earn more than $15 an hour who will benefit from a “spillover effect.” See the Appendix on Methodology.
- We averaged median wage increases for the 2013 to 2017 period rather than the increases in total wage costs since some local governments may have increased employment levels. The change in the median wage provides a good indication of what the typical local government employee might have received.
- Maryland joined the $15 states in March and Connecticut became the seventh state adopting $15 in May of 2019.
- California 2014 increase effective July 1, 2014.
- New York State effective dates December 31 of the prior year (that is, the day before January 1). New York State minimum wage increases for New York City are for employers with eleven or more employees (increases for workers at smaller employers reach $15 on December 31, 2019).
- New York State effective dates December 31 of the prior year (that is, the day before January 1).
- New York State effective dates December 31 of the prior year (that is, the day before January 1). Minimum wage increases adjusted on December 31, 2021 and each following December 31 dates by yet-to-be-determined indices raising the minimum to not more than $15.00.
- New Jersey minimum wage increased to $8.85 on January 1, 2019, and will rise to $10.00 on July 1, 2019; thereafter increases take effect on January 1.
- District of Columbia minimum wage increases in 2019 and 2020, effective July 1.
- Illinois minimum wage will increase to $9.25 on January 1, 2020, and to $10.00 on July 1, 2020. It reaches $14.00 on January 1, 2024 and $15.00 on January 1, 2025. Under local ordinance, the minimum wage in the City of Chicago rose to $12.00 on July 1, 2018 and will reach $13.00 on July 1, 2019.
- For more on the OES, see https://www.bls.gov/oes/home.htm. Wage data are presented here for all occupations. For more details on the methodology used in this report, see the Appendix on Methodology.
- Phase-in for states that have already adopted $15 minimum wages based on the year $15 is reached; that is, 2020 for the District of Columbia; 2022 for California; 2023 for New York State (New York City is already at $15, New York City suburbs will reach in 2023; the rest of New York State later, but 2023 assumed here;) 2023 for Massachusetts; 2024 for New Jersey. For other states, wage cost to reach $15 an hour wage floor phased in evenly in six steps beginning in 2019 and ending in 2024.
- While OES data for elementary and secondary schools are for public and private schools, private schools are only 10 percent of the total.
- While OES data for elementary and secondary schools are for public and private schools, private schools are only 10 percent of the total.
- This included retroactive pay increases for earlier years (some dating back to 2010) that were paid starting in 2014. Over the roughly seven-year term of most City of New York contracts, average annual increases were a little under 1.5 percent. (See 2010–2017 Memorandum of Agreement, District Council 37 and the City of New York, signed July 1, 2014, http://www.dc37.net/wp-content/uploads/dc37contracts/pdfs/2010contract.pdf.) Unionized New York local government employees outside of New York City received average annual wage increases of 2 percent in the years 2014 through 2017, following a three-year wage freeze. (See Mark Toor, “PEF Sets Potential State Pattern With New Pact,” The Chief, October 24, 2016, thechiefleader.com/news/news_of_the_week/pef-sets-potential-state-pattern-with-new-pact/article_28a6e998-84ec-11e6-954b-7ba4b6783f55.html.)
- Illinois raised 10th percentile wages for school employees more than at the median pay level, while Massachusetts was the only state that did not raise 10th percentile pay more than at the median for both groups of local government workers.
- Bureau of Labor Statistics, May 2013 and May 2017 OES data.
- Under Mayor Bill de Blasio, the City of New York announced in January of 2016 that it would increase the city budget by amounts needed to phase in increases to $15.00 by December 31, 2018 for all municipal workers, and for all nonprofit workers providing city-funded human services under city contracts.
- The 2018 OES data were released after this report was prepared
- According to the Bureau of Labor Statistics, fringe benefit costs are a higher percent of compensation costs for state and local government workers than for the average private sector worker (37.6 percent versus 30.3 percent). “Employer Costs for Employee Compensation—September 2018,” Bureau of Labor Statistics, December 14, 2018.
- Bureau of Labor Statistics, Employment Cost Index, State and Local Government Workers, all occupations, all industries. Wage gains for the fourth quarter of each year: 2013, 1.1 percent; 2014, 1.6 percent; 2015, 1.8 percent; 2016, 2.1 percent. See https://data.bls.gov/cgi-bin/dsrv. Another indication that the estimates presented here likely overstate the cost of reaching $15 an hour is that the recent Economic Policy Institute estimate for an increase in the federal minimum wage to $15 by 2024 put the number of directly and indirectly affected government workers at 3.1 million while the estimates in this report encompass 4.6 million local government employees. David Cooper, “Raising the federal minimum wage to $15 by 2024 would lift pay for nearly 40 million workers,” Economic Policy Institute, February 7, 2019, Appendix Table 3.
- See, for example, Fiscal Policy Institute Analysis of the Executive Budget, “New York State Economic and Fiscal Outlook, 2017–2018,” February 7,
- Bureau of the Census, 2016 Annual Surveys of State and Local Government Finances.
- Analysis of American Community Survey data.