
Affectionately known as “The Second City,” Chicago remains a popular center for commerce, arts, and law. According to U.S. Census data, the diverse city is home to over 2.7 million people, about 22.7 percent of whom live at or under the federal poverty line. Approximately a quarter of the city’s residents are under the age of eighteen. Racially, about 32 percent of the city’s population is white, 33 percent is black, 29 percent is Hispanic, and 5.5 percent identifies as Asian.1
The city’s public school system, however, is decidedly less diverse and less affluent than the city that hosts it. As of the current academic year, enrollment in Chicago Public Schools (CPS) is at 392,285 students. Of those, 80.74 percent are eligible for federal meal programs. Less than 10 percent of enrolled CPS students are white, while 39 percent are black and 46 percent are Hispanic. Despite the resources of the city, Chicago Public Schools is a high-poverty, racially isolated district, with around 17 percent English language learners.2
In order to combat racial and socioeconomic segregation within the district, and to encourage greater diversity and opportunity for the district’s most competitive and popular programs, CPS designed an innovative system of admissions for its magnet and selective enrollment schools. This system, modified from an earlier consent decree with the Justice Department, uses nuanced measures of privilege and disadvantage in order to ensure that the talents and potential of marginalized students will not be overlooked in a competitive admissions process. It also helps ensure that the most popular and challenging programs provide diverse and inclusive learning environments, rather than act as environments where the already advantaged might isolate themselves.
A History of School Integration Efforts in Chicago
By 1960, neighborhood and geographic segregation in the city became undeniable. African Americans comprised around one quarter of Chicago’s population, many of whom lived in the South and West sides of the city, in densely populated, low-income areas. To address the overcrowding in black schools, then-Superintendent Bill Willis used portable buildings, commonly referred to as “Willis Wagons,” to serve as additional classroom space rather than enrolling black students in nearby white schools.3 Upon his resignation six years later, new Superintendent James Redmond faced fierce opposition when he attempted to comply with laws that compelled school integration.4 Between 1970 and 1980, the white population of Chicago Public Schools fell by 60 percent, as many white families of means fled into the suburbs or enrolled their children in private schools to avoid integration. During the following decade, the white population would fall another 50 percent.5
By the spring of 1979, the federal government accused the city of supporting segregation in its schools, and announced its intention to file suit if there was no timely remedy. In 1980, CPS and the federal government entered into a Consent Decree with the United States Department of Justice, with four basic objectives: (1) desegregate schools, (2) provide compensatory programming for any schools remaining segregated, (3) maximize the student populations that will experience integration, and (4) do not arbitrarily impose the burdens of desegregation on any racial or ethnic group. Admissions to Chicago’s magnet and selective enrollment schools likewise became governed by this agreement.6
In 2001, when the United States and CPS revisited the plan, the court determined that CPS had not yet reached full compliance in several areas, including magnet schools and selective enrollment schools. In 2004, the resulting Modified Consent Decree acknowledged the demographic challenges of creating a fully integrated district, but compelled CPS to “use a variety of strategies to assign students to schools.” The resulting race-conscious plan set forth specific goals for the racial composition of every district school, classifying students as either “white” or “minority.” The plan defined an integrated school as have no fewer than 15 percent but no greater than 35 percent white students. The consent decree also did not make any racial or ethnic distinctions within the minority category—black, Hispanic, Asian, and multiracial students were all grouped together to determine minority enrollment.7 While Chicago struggled to develop an adequate plan for meeting the racial integration goals for most schools, enrollment in magnet and selective schools was one area in which the district was able to create more racially integrated schools through specific consideration of race in admissions.
In September 2009, a federal judge scrapped the desegregation agreement that had been in place for nearly thirty years, worrying advocates for school integration and diversity. However, CPS hinted at its dedication prior to the lifting of court supervision when it announced that it was considering the use of socioeconomic status (SES) as an admissions factor in magnet and selective enrollment schools.8 The district followed through on its word. On December 16, 2009, Chicago Public Schools’ Board of Education adopted a one-year policy which introduced a new diversity model for magnet and selective enrollment schools based primarily on socioeconomic status. Less than one year later, the board adopted a modified policy that governed applications for the 2011–2012 school year enrollments. Both times, the policies were subject to public comments and review by a Blue Ribbon Commission appointed by the Chief Executive Officer.9
Stories of School Integration
View the profiles of school districts and charter schools pursuing socio-economic integration.How My Family’s Immigration Story Connects to Integration
New York City Public Schools: Small Steps in the Biggest District
Chicago Public Schools: Ensuring Diversity in Selective Enrollment and Magnet Schools
Hartford Public Schools: Striving for Equity through Interdistrict Programs
Stamford Public Schools: From Desegregated Schools to Integrated Classrooms
Dallas Independent School District: Integration as Innovation
Jefferson County Public Schools: From Legal Enforcement to Ongoing Commitment
Eden Prairie Public Schools: Adapting to Demographic Change in the Suburbs
Champaign Schools: Fighting the Opportunity Gap
Cambridge Public Schools: Pioneers of Equitable Choice
The Current Plan
The new policy regarding admissions to CPS magnet and selective enrollment programs has a wide-ranging set of objectives. These objectives include: (1) maintaining, to the extent permitted by law, the diversity achieved by CPS prior to the termination of the consent decree, (2) promoting socioeconomic diversity within schools by eliminating, preventing, and reducing economic isolation as measured by a variety of means, (3) providing a unique or specialized curriculum or approach, and (4) improving achievement for all students participating in a magnet or selective enrollment school or program.10
Fundamentally, the consideration of socioeconomic factors in selection process is a critical component of maintaining a reasonable level of diversity in Chicago’s most competitive schools.
Fundamentally, the consideration of socioeconomic factors in selection process is a critical component of maintaining a reasonable level of diversity in Chicago’s most competitive schools. CPS uses several SES factors that relate to the census tract in which an applicant resides at the time of application. These factors include: (1) median family income, (2) adult educational attainment, (3) the percentage of single-family households, (4) home-ownership percentage, (5) percentage of population that speaks a language other than English, and (6) a school performance variable. After a composite SES score is determined for each tract, CPS will designate an SES tier (one through four) for each census tract in the city.11
The specifics of the admissions policies differ according to the type of limited enrollment school. If a student wishes to attend a CPS magnet school, they will generally be admitted through a controlled lottery-like system. While the district uses non-testing admissions procedures for its magnet schools, a threshold level of previous academic achievement is generally required for eligibility for many high school programs. At both levels, applicants who are siblings of currently enrolled students will be offered seats to the extent that space remains; if there are more siblings than slots, then a lottery will be conducted as necessary. But after placing siblings, SES factors begin the play a role. Some schools will hold a proximity lottery, which will allocate an additional 40 percent of the seats to students who live close to the school, but they are typically only permitted to do so if the surrounding neighborhoods are themselves racially and economically varied. When there is no proximity lottery, the remaining seats will be allocated to the four-tiered citywide SES lottery process. Students will be ranked within their tier and seats will be divided equally among the four tiers.12
A student who wishes to apply to a selective enrollment school will endure a related, but more rigorous process. Selective Enrollment schools and programs include Regional Gifted Centers, Classical Schools, Academic Centers, International Gifted Programs, and Selective Enrollment High Schools and High School IB Programs. All applicants have two opportunities to be chosen for enrollment in one of these programs—the first solely based off of composite score results from testing or other traditional academic criteria, and the second through achieving a high ranking within their assigned SES tier based on those same academic measures. A total of 30 percent of available seats are filled solely using testing/academic criteria from a city-wide pool. The remaining available seats—70 percent—shall be filled in rank order from the lists that rank applicants within each of the four SES tiers, with an even number of students matriculating from each tier. In practice, this means that highly qualified students from more marginalized backgrounds will not be required to earn the same score on standardized tests as their peers in more affluent socioeconomic environments.13
Impact on Integration and Student Outcomes
Chicago’s selective enrollment public schools are far more diverse than comparable programs in other large urban areas, which too often shut out capable black, Hispanic, and low-income students that comprise the overwhelming majority of their traditional student population.
Maintaining Racial Diversity in Schools and Programs
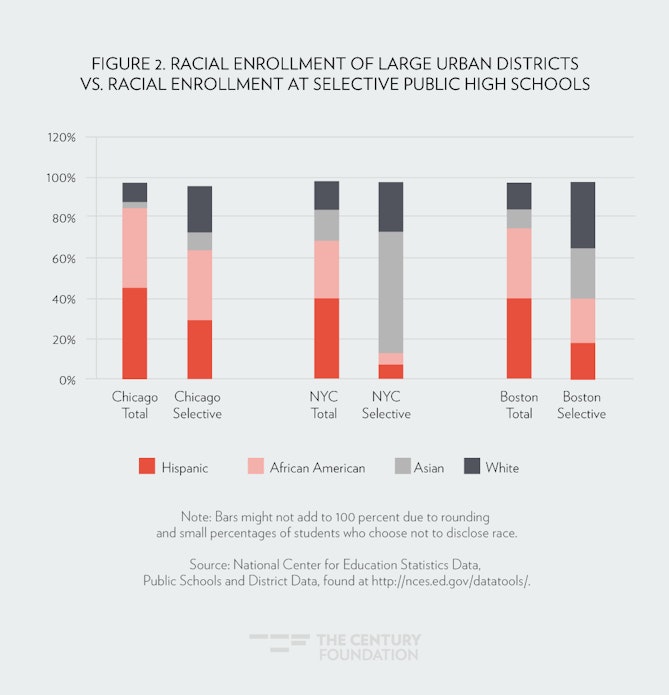
Across Chicago’s ten selective enrollment public high schools, enrollment demographics continue to meet the racial diversity standards outlined in the original consent decree long after it no longer governs admissions protocol. In the 2013–2014 academic year, about 22 percent of students attending a CPS selective enrollment high school were white; nearly 30 percent were Hispanic, 35 percent black, and almost 9 percent Asian.14 In the comparable cities with “exam schools” of New York and Boston, white and Asian students were overrepresented much more dramatically. For example, although over 40 percent of schoolchildren in New York City identify as Hispanic, that population represents only 7.2 percent of enrollment in their public selective high schools; in Boston, selective school enrollment numbers also reveal significant declines in black and Hispanic enrollment and simultaneous overrepresentation of white and Asian students.15
Chicago’s success in maintaining relatively racially balanced schools—despite the removal of race as an explicit selection factor in 2009—is due in large part to the particular measures of socioeconomic diversity used in the admissions plan. The census tract data that compose the SES tiers used by the district contain indicators of disadvantage that are highly racialized, including homeownership rates, use of languages other than English inside of the home, and percentages of single-parent households. These indicators offer a more complete picture of an applicant than do income-only indicators, such as free and reduced-price lunch eligibility.
Academic Success of Low-Income Students in the Selective School Environment
Under the current admissions system, low-income students who have the opportunity to attend very selective schools have continued to succeed within them. While a narrow achievement gap persists according to state administered test results, that gap is decidedly smaller than both the district-wide and state-wide economic achievement gaps. This same pattern applies to the black-white and Hispanic-white racial achievement gaps. Students admitted out of selection tiers of greater disadvantage not only perform brilliantly on state assessments—doing much better than the CPS district average of their more affluent peers—but keep up with students in their schools who are not classified as low-income.16
These students also graduate in four years at extremely high rates, indicating that low-income students are fully capable of excelling within these challenging curriculums. Chicago’s selective public schools continue to be the best in the district, and retain their popularity among families in Chicago.
Next Steps
Chicago’s explicit commitment to socioeconomic and racial diversity within its most competitive schools is unique and commendable. We can observe its effectiveness through the academic successes of its students, the continued popularity of the selective enrollment schools, and the sustained racial diversity of the program as a whole. Moving forward, CPS must address two remaining issues. First, the district ought to explore ways to address the less than ideal racial diversity of certain individual selective schools—namely the most competitive high schools. Secondly, the district should further evaluate ways to attract even higher enrollment of higher-poverty youth into their selective schools.
Redistributing Racial Diversity
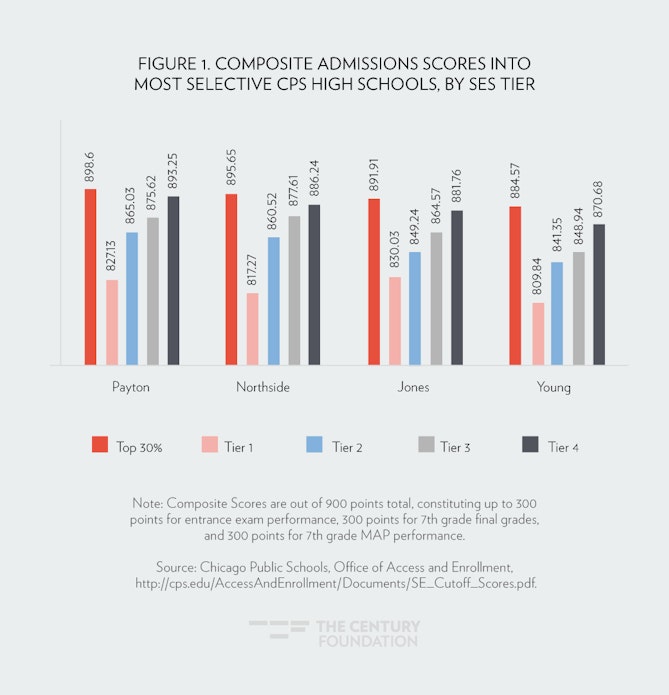
While the total minority enrollment across all selective CPS schools appears balanced and promising, minority enrollment in the most selective of those schools remains disproportionately low. Walter Payton, the most selective and most coveted school in the district, is also the least racially representative school. There, white students make up 42.1 percent of the school, black students 17.8 percent, and Hispanic students, 24 percent.17
Under the current admissions system, a student can rank several schools on a single application but will only ever receive one offer—presumably the highest ranked school for which their composite scores or tier placement qualifies them. Minimally, CPS needs to determine the numbers of high achieving, minority and low-SES applicants who rank the most selective schools most highly on their own applications, and employ significant outreach to attempt to increase those numbers.
Increasing Individual-Level Socioeconomic Diversity
The use of census tract data is a nuanced, appropriate, and effective way to reasonably estimate the relative socioeconomic status of an individual applicant, but—like nearly any measure—remains imperfect. As a result, the percentages of low-income students—even when employing the blunt measure of free and reduced-price lunch eligibility—leaves something to be desired. Despite the tier system, meals program eligibility rates at many of the schools do not come close to approaching the high district rate. For example, only 31 percent of students at Walter Payton qualified for the program in 2013–2014; Young Magnet High School did only slightly better at 40.51 percent, and Jones College Prep came in at under 48 percent.18
As gentrification rapidly increases in cities across America, cities depending on census tract or neighborhood characteristics as primary determinants of SES cannot rely on even slightly old data and expect to have an accurate portrait of the status of a place.
This is possibly because the admissions process, even with the control of the tier system, still attracts the most affluent and privileged families from each census tract. As not every person who lives within a particular neighborhood will fit each of the generalizable characteristics of that neighborhood, many students arriving from tiers that represent lower socioeconomic positions might not actually occupy that status themselves. Officials would do well to rigorously seek to identify talented low-income youth in earlier grade levels and provide them with information and encourage their eventual application to selective schools. The school system also needs to diligently monitor neighborhoods as they change in economics and demographics. As gentrification rapidly increases in cities across America, cities depending on census tract or neighborhood characteristics as primary determinants of SES cannot rely on even slightly old data and expect to have an accurate portrait of the status of a place.
A more substantial intervention might be to either reduce or eliminate the number of students who gain admission to selective enrollment schools based solely on composite scores, outside of the tier system. While 30 percent of seats are currently allocated to the highest scores, significantly cutting back on that population, which tends to come from more privileged backgrounds, would make more seats available for students of all tiers, thus better balancing schools by socioeconomic status.

This profile is part of The Century Foundation’s Stories of School Integration series.
Notes
- “QuickFacts: Chicago City, Illinois,” United States Census Bureau, http://www.census.gov/quickfacts/map/IPE120213/1714000/accessible#footnotes.
- “CPS Stats and Facts,” Chicago Public Schools Office of Accountability, September 2016, http://cps.edu/About_CPS/At-a-glance/Pages/Stats_and_facts.aspx.
- Roger L. Pulliam, “Historical Review of Black Education: Chicago,” Negro Educational Review 29, no. 1 (January 1978): 24.
- Paul E. Peterson, School Politics, Chicago Style (Chicago, IL: University Press, 1976), 161.
- “History of Chicago Public Schools,” Catalyst Chicago, http://catalyst-chicago.org/cps-history/.
- United States of America v. Board of Education of the City of Chicago (United States District Court Northern District of Illinois, Eastern Division September 24, 2009), http://cps.edu/About_CPS/Departments/Law/Documents/ConsentDecree.pdf.
- Ibid.
- Sarah Karp, “Federal Judge Ends Chicago Schools Desegregation Decree,” Catalyst Chicago, September 24, 2009, http://catalyst-chicago.org/2009/09/federal-judge-ends-chicago-schools-desegregation-decree/.
- “Admissions Policy for Magnet, Selective Enrollment and Other Options for Knowledge Schools and Programs,” Chicago Public Schools Policy Manual, August 27, 2014, http://policy.cps.edu/download.aspx?ID=82.
- Ibid.
- Ibid.
- Ibid.
- Ibid.
- “CPS Stats and Facts,” Chicago Public Schools Office of Accountability, September 2016, http://www.cps.edu/About_CPS/At-a-glance/Pages/Stats_and_facts.aspx.
- “Data About Schools,” Our Schools, http://schools.nyc.gov/AboutUs/schools/data/default.htm.
- Illinois Report Card,” Academic Progress: Jones College Prep High School, http://www.illinoisreportcard.com/School.aspx?source=Trends.
- National Center for Education Statistics, “Common Core of Data: Chicago,” http://nces.ed.gov/ccd/districtsearch/district_detail.asp?ID2=1709930.
- National Center for Education Statistics, “Common Core of Data: Chicago,” http://nces.ed.gov/ccd/districtsearch/district_detail.asp?ID2=1709930.